

Nasdaq 100 Talking Points:
- The Nasdaq 100 is bouncing this morning after a stark sell-off yesterday drove down to fresh yearly lows. Corporate earnings are on the radar with Meta/FB and Paypal reporting this afternoon, followed by a big day tomorrow with Apple, Amazon and Intel all reporting after the bell. This may provide some further bounce but the backdrop remains bearish in US equities.
- The Nasdaq 100 has shown a stark sell-off in the first month of Q2, currently down by more than -14% from the prior March high.
- I looked at bearish US equities setups as my Top Trade for Q2 and that’s continued to fill-in and next week brings the FOMC rate decision that’s expected to bring a 50 bps hike.
- The analysis contained in article relies on price action and chart formations. To learn more about price action or chart patterns, check out our DailyFX Education section.
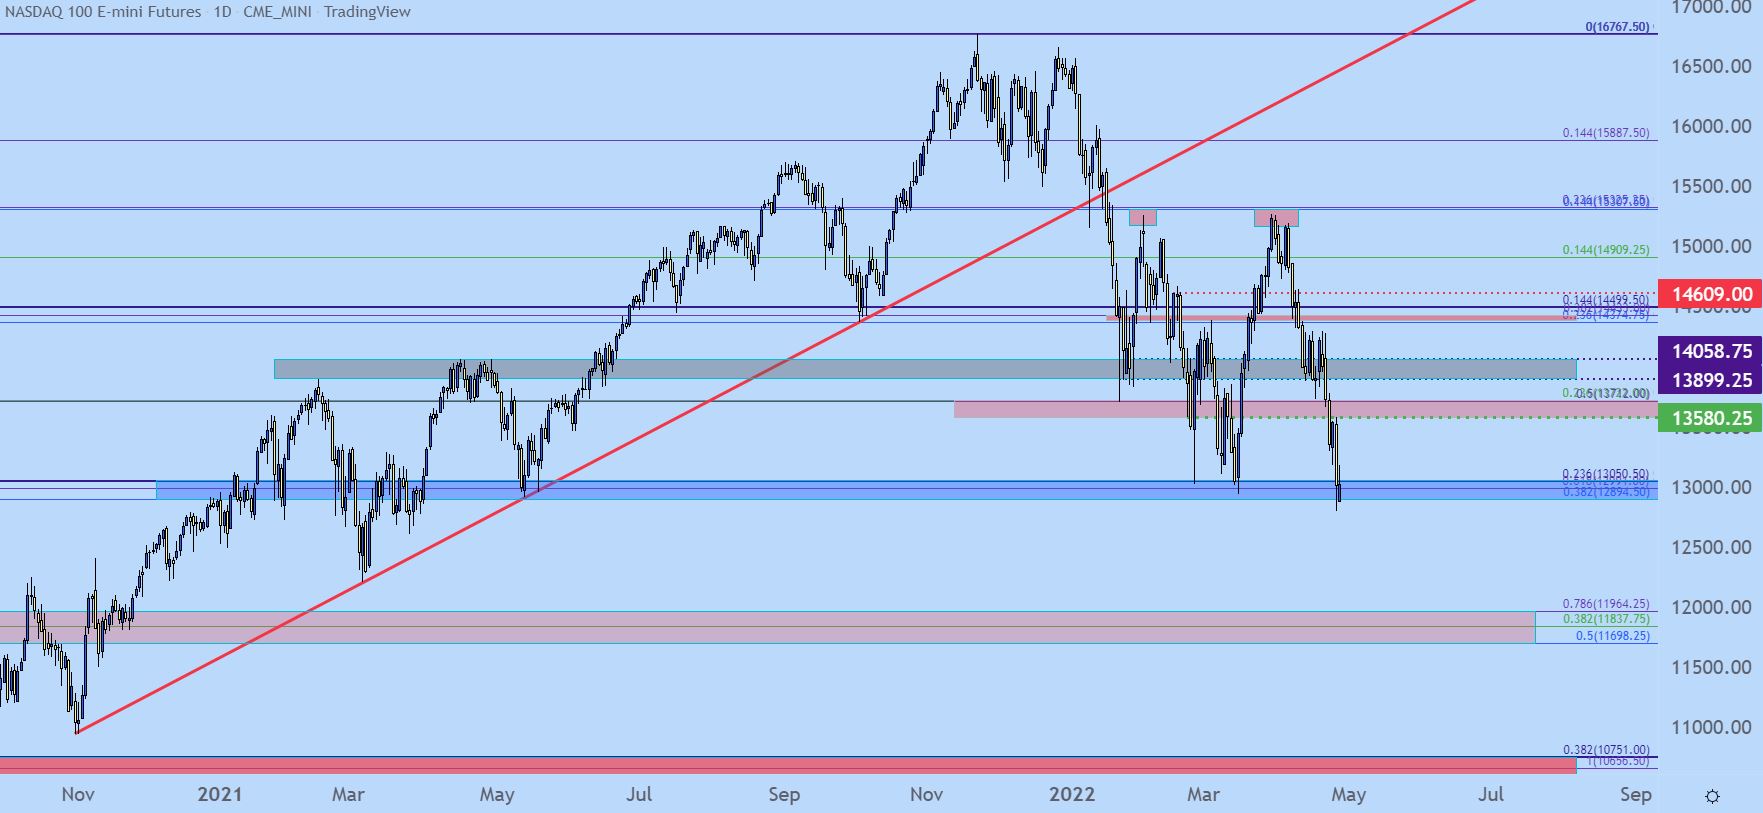
The Nasdaq 100 set a fresh yearly low after a brutal session yesterday. Prices pushed below the swing point from the March bounce, which took place around the FOMC rate decision in the middle of last month, and with the FOMC rate decision on the calendar for a week from now, there’s the threat of more pain.
Between here and that Fed meeting is a slew of corporate earnings reports and as we saw yesterday from Microsoft all hope is not yet lost on the short-term front. And later today brings a few more reports from big tech with Meta/FB and Paypal, although tomorrow is the big day with all of Apple, Amazon and Intel reporting.
At this point, the Nasdaq 100 is grasping on to support after yesterday’s breach. I’m tracking this support from 12,894-13,050, and this area has been in-play since first showing as resistance in December of 2020. It eventually became support the following May as prices launched up to fresh all-time-highs; but it came back into the picture in late-February as sellers were starting to gain control of the matter. A quick bounce developed in late-Feb but price immediately returned a couple of weeks later and this was the spot that held the lows ahead of the FOMC rate decision.
Sellers pushed through this area late in yesterday’s session to set a fresh yearly low in the Nasdaq 100.
Nasdaq 100 Daily Price Chart
Chart prepared by James Stanley; Nasdaq 100 on Tradingview
Nasdaq 100 – Double Top Breached
Taking a step back to the weekly chart and there’s a double top formation that’s been brewing in early 2022 trade. The early-February and late-March swing highs match fairly closely together around 15,300, and the low in between those two points was around 13,000. That provides for approximately 2,300 points of deviation from the top to the neckline.
The setup triggers with a breach of support, such as we saw yesterday, and traders will often project targets based on the size of the formation. And in this case, given the 2,300 points of deviation that would provide for a targeted move of 2,300 points, which points to support potential down to around 10,750. Perhaps coincidentally, that level correlates with a 38.2% Fibonacci retracement and a price swing from September of 2020.
So, the risk aversion situation would need to get even worse to drive this scenario towards fruition but, given the Fed’s stance of recent, a move of that magnitude cannot be ruled out.
Nasdaq 100 Daily Price Chart
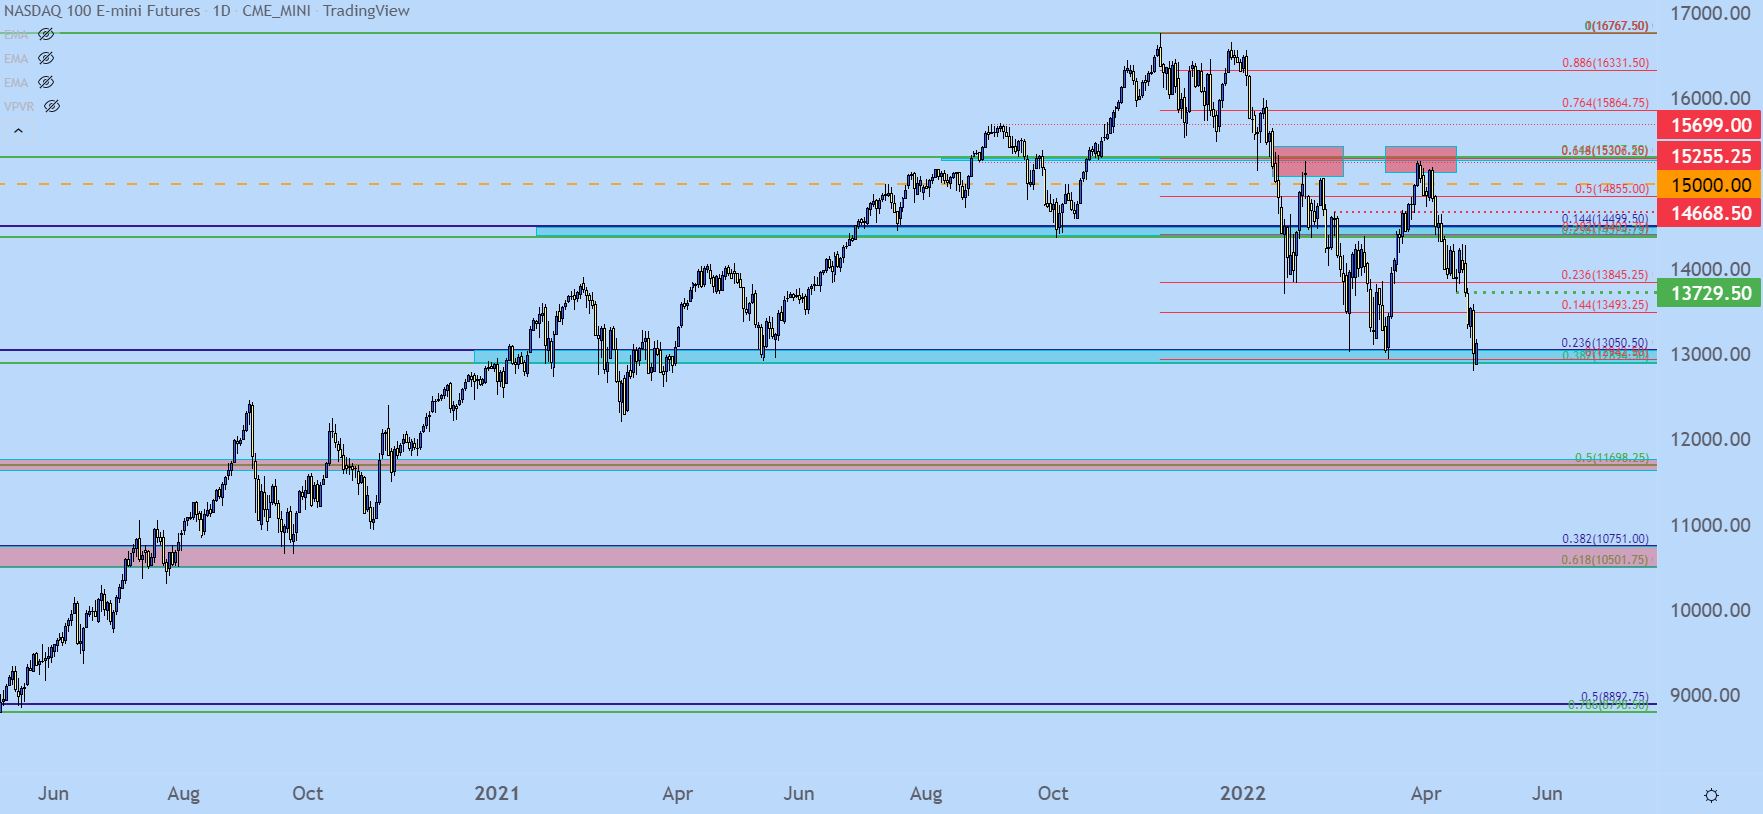
Chart prepared by James Stanley; Nasdaq 100 on Tradingview
Nasdaq 100 Shorter-Term
That intrusion on support has been faded overnight with prices popping back above that support zone. And given the earnings releases on the calendars combined with how well companies have learned to manage investor expectations, there could be more topside here as shorts cover following a strong downside thrust.
And given how aggressively this sell-off priced-in yesterday and last Thursday and Friday, a bounce could be a welcome respite here. But, there’s remaining resistance potential here that’s already started to come into play at 13,184, a swing-low turned swing-high that’s currently being traded through. This puts focus higher, towards the level around 13,321. And if that doesn’t hold, there’s a third zone that I’m following from 13,466 up to 13,500.
Nasdaq 100 30 Minute Price Chart
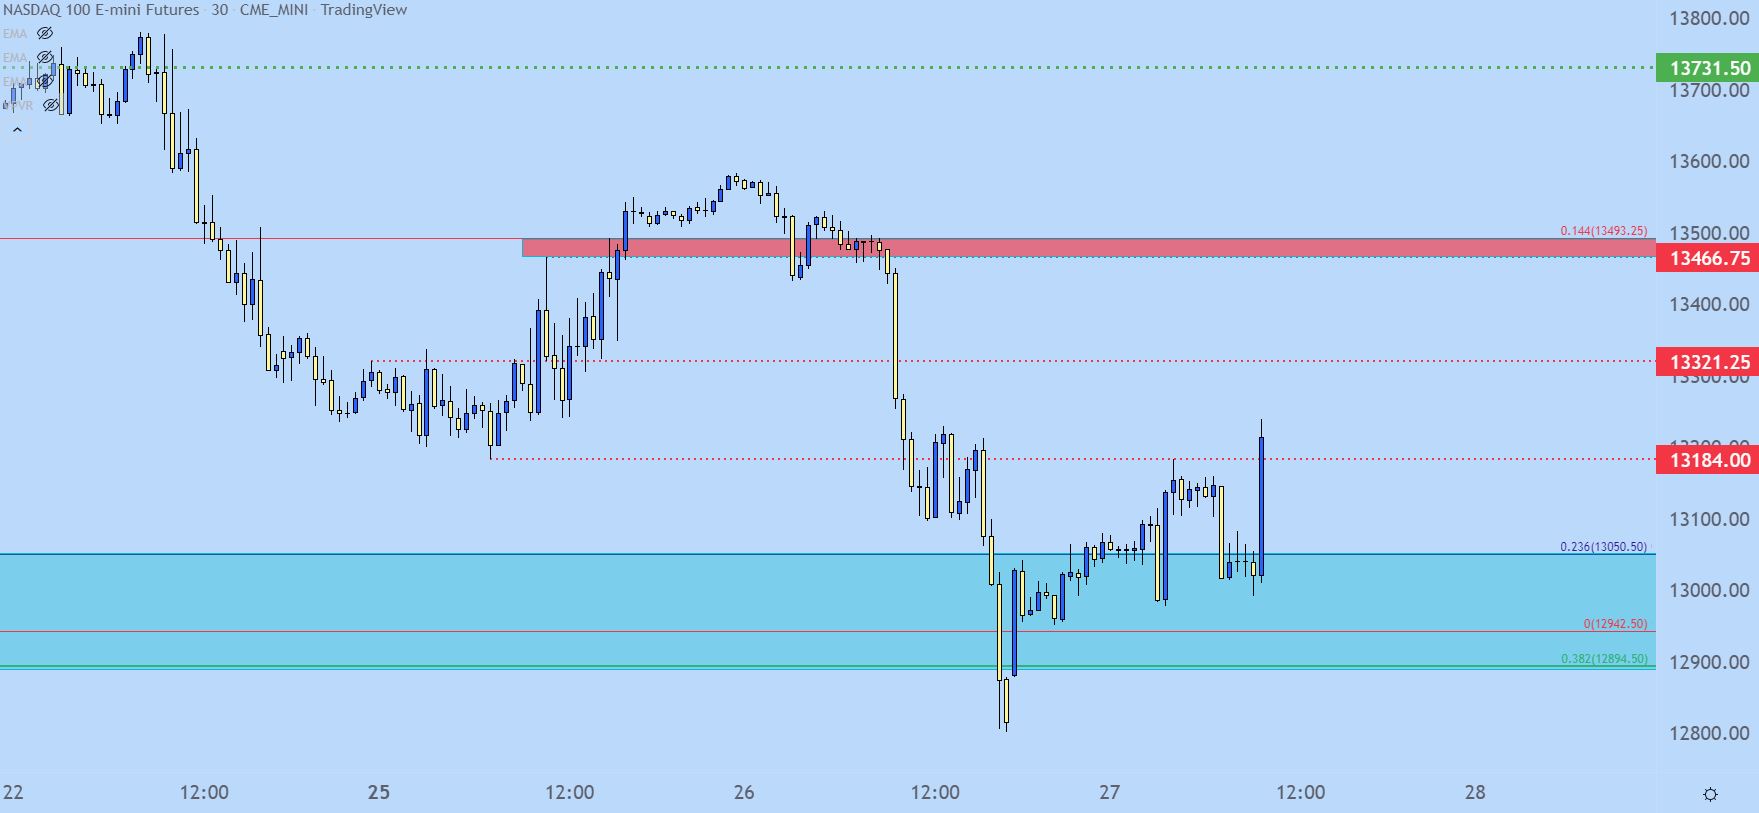
Chart prepared by James Stanley; Nasdaq 100 on Tradingview
— Written by James Stanley, Senior Strategist for DailyFX.com
Contact and follow James on Twitter: @JStanleyFX
Be the first to comment