

Jose Luis Pelaez Inc
What a difference a few weeks make. Since June 16th’s market bottom, stocks are up 15%, the Nasdaq 20%, and growth stocks like Amazon (AMZN) up almost 40%.
Ycharts 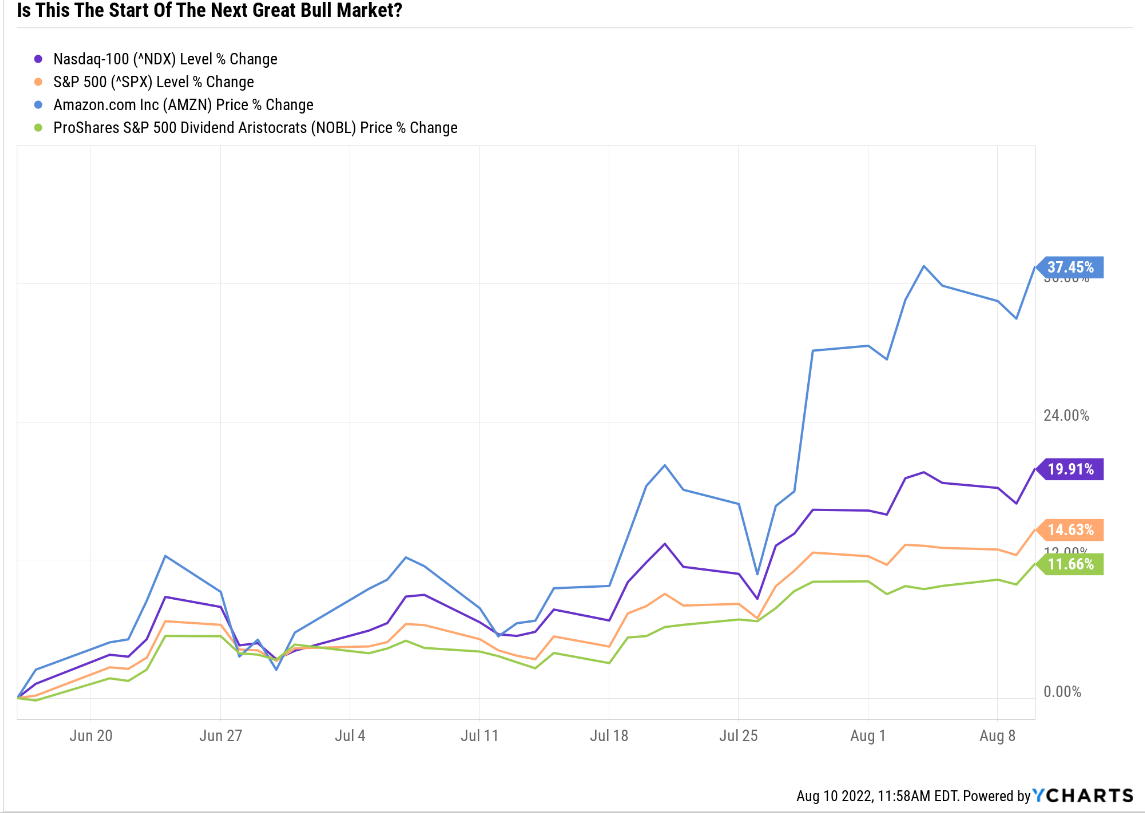
Do you know what new bull markets look like? Just like this.
But that doesn’t mean this is actually the start of a bull market. That will likely depend on whether or not we’re getting a recession in 2023.
Daily Shot 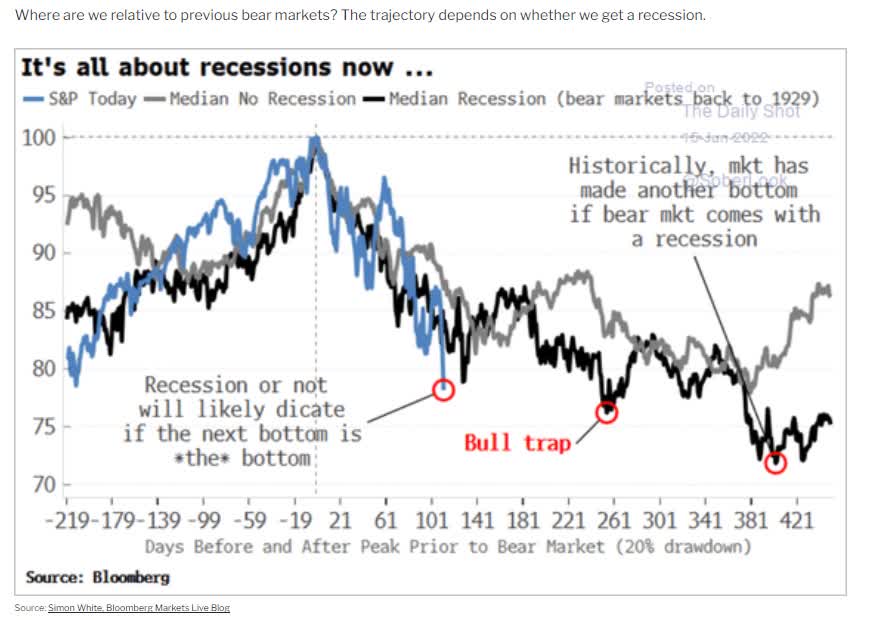
The historically average non-recessionary bear market has three bear market rallies before hitting the final bottom.
The average recessionary bear market has four. This is the 4th rally we’ve attempted so it might be the real thing… or the final head-fake before the historically normal and terrifying plunge to the actual bottom.
Daily Shot 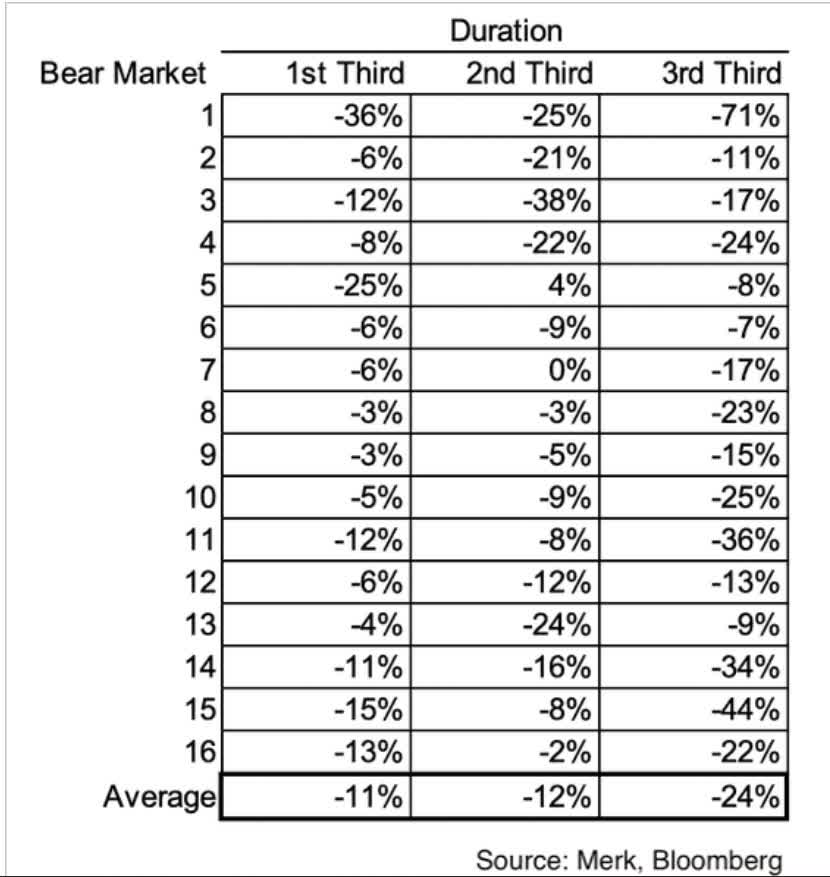
The average recessionary bear market decline is 60% generated in the final third, the terminal crash.
This is what I mean.
Ycharts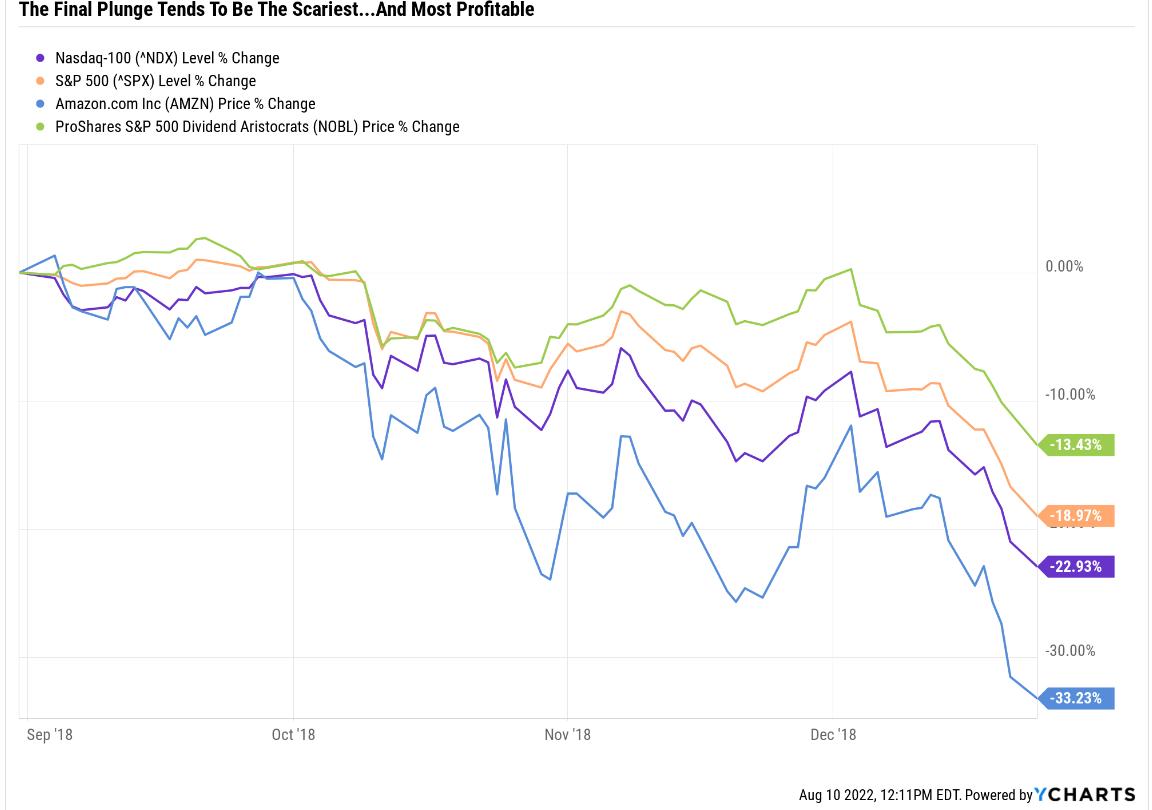
In the 2018 bear market, the market traded choppy for several months, with 3 failed bear market rallies and a final 17% crash in three weeks.
Of course, we all know what happened next.
Ycharts 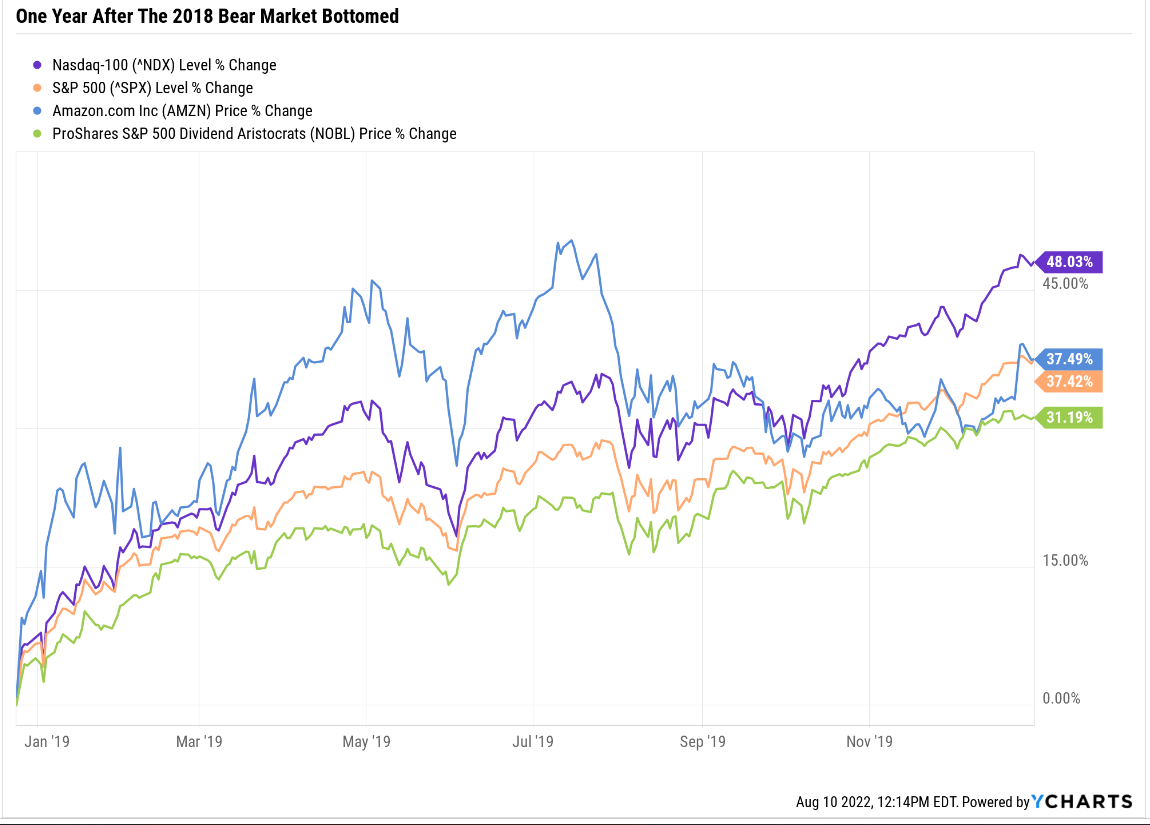
The 3 weeks of market hell were followed by an epic year-long market heaven with stocks soaring 37% and tech stocks rallying almost 50%.
And guess what? This is exactly how the stock market acts. The bigger and more terrifying the decline, the more profitable the inevitable bull market.
Charlie Bilello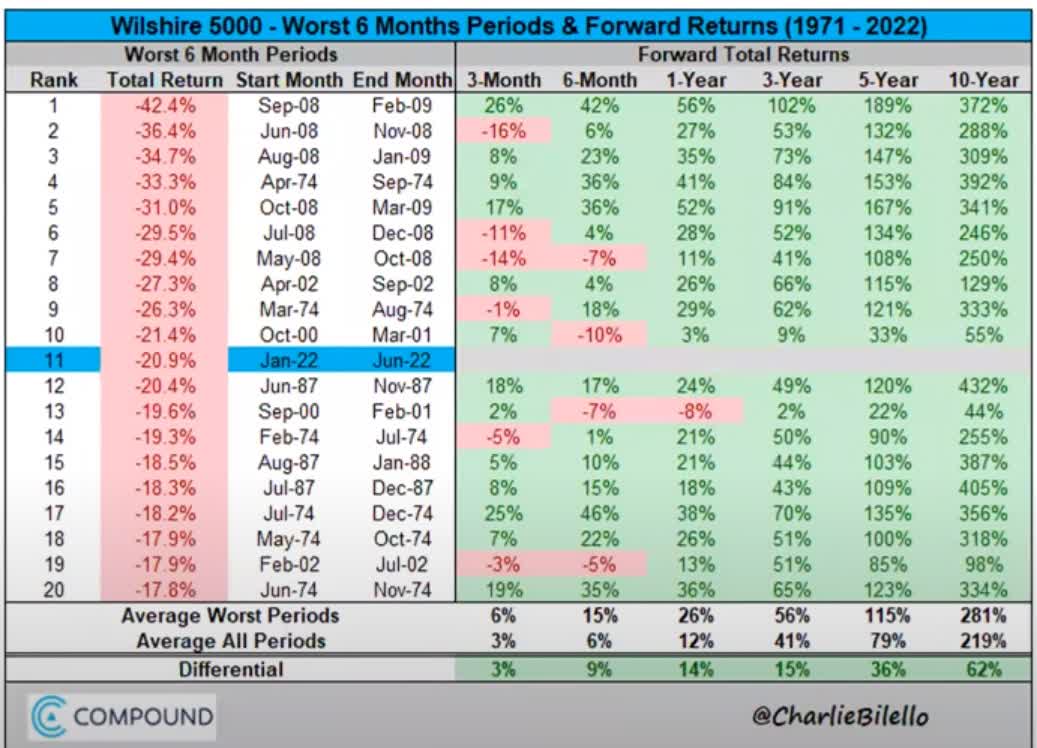
After an 18+% six-month decline like we saw in the first half of the year, stocks have never failed to deliver positive 3 years returns. And only in the tech crash did they fail to go up after a year.
The average 10-year gain is 281%, a nearly 4X return representing 14.4% annual returns.
“Volatility isn’t risk, it’s the source of future returns.” – Joshua Brown, CEO of Ritholtz Wealth Management
“Fortunes are made in bear markets.” – Todd Sullivan
If this bear market is over, then stocks might trade flat while the Fed finishes slaying the demon of inflation. Or we might even rally to new highs by the end of the year.
CNBC 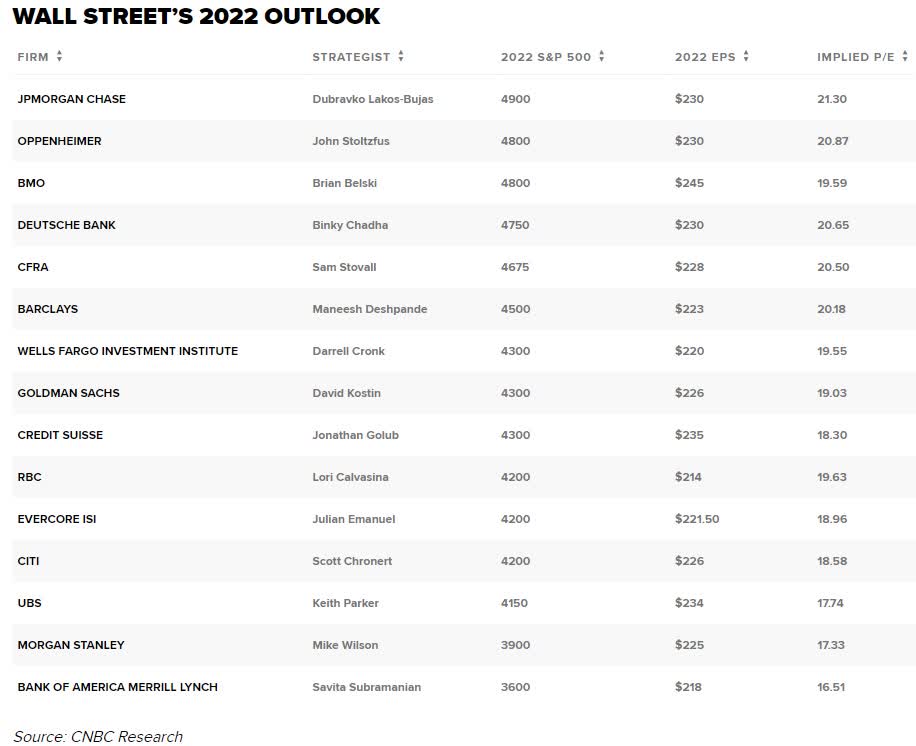
Mind you, only JPMorgan thinks that’s likely, though there are plenty of bullish blue-chip economist teams.
If it’s not over? Then we historically likely have one final plunge to go.
But in 10 years, it won’t matter if you nailed the exact bottom because you’ll still be rich.
Ycharts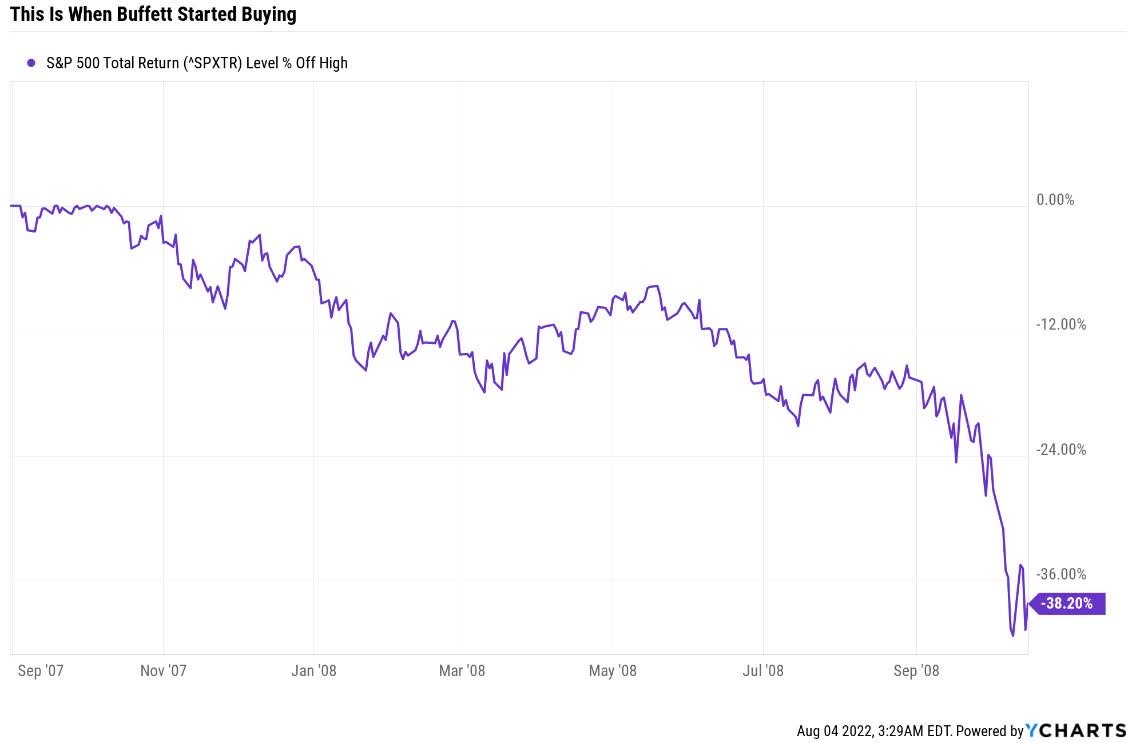
In 2008, Buffett started buying when the market was down 38%. Sounds smart, right? Greedy when others are fearful? It was the historically average bear market bottom, after all.
Ycharts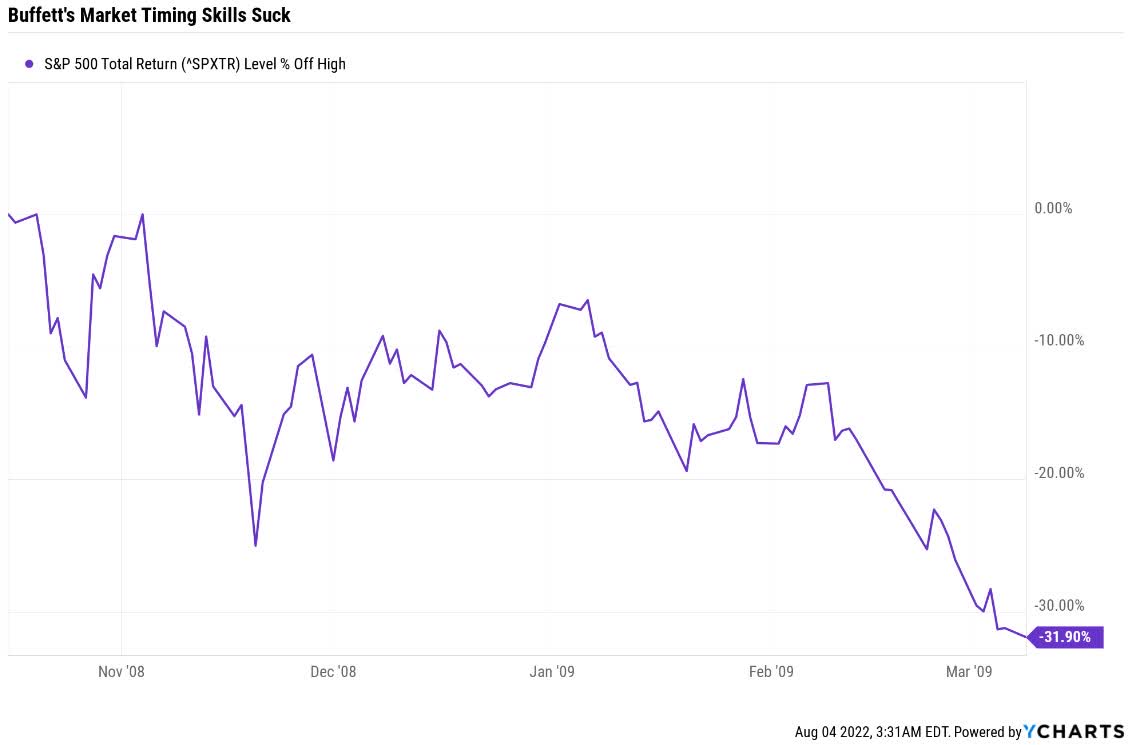
Actually, stocks fell another 32% from there in the 2nd biggest market crash in US history.
Buffett’s timing sucked. And yet look at the returns he and other investors earned who didn’t try to time the bottom and just bought blue-chip bargains.
Ycharts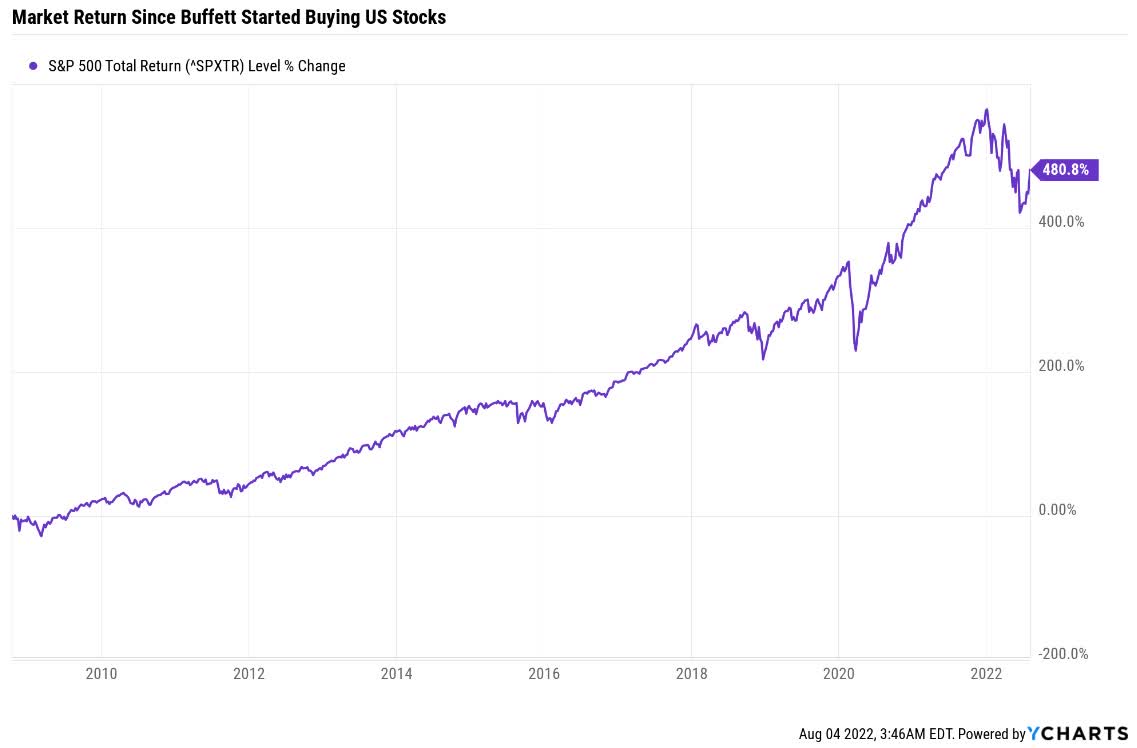
Buffett didn’t try to buy the bottom, he just kept buying, and his investors got rich.
“Don’t try to buy at the bottom and sell at the top. This can’t be done – except by liars.” – Bernard Baruch
That’s why I want to point out 7 high-yield aristocrat bargains that you could potentially safely buy today, no matter whether the market has 20% to 40% more to fall, or has already started a new 10-year bull market.
Buy these blue-chips in a diversified and prudently risk-managed portfolio, and just keep buying as your investing plan says to, and in 10 years, you will feel like you bought the bottom in the 2022 bear market.
How To Find The 10 Best High-Yield Aristocrats In Any Market…In 2 Minutes
I use the Dividend Kings Zen Research Terminal to make every article. This is our flagship tool that runs on the DK 500 Masterlist.
The DK 500 Master List is one of the world’s best watchlists, including
- every dividend aristocrat (S&P companies with 25+ year dividend growth streaks)
- every dividend champion (every company, including foreign, with 25+ year dividend growth streaks)
- every dividend king (every company with 50+ year dividend growth streaks)
- every foreign aristocrat (every company with 20+ year dividend growth streaks)
- every Ultra SWAN (wide moat aristocrats and future aristocrats, as close to perfect companies as exist on Wall Street)
- 40 of the world’s best growth stocks
Let me show you the simple and easy screen I used to find the best high-yield aristocrats you can safely buy today.
Screening For The Best High-Yield Aristocrats For This Likely Recession
| Step | Screening Criteria | Companies Remaining | % Of Master List |
| 1 | Reasonable Buy Or Better (Never Overpay For Stocks) | 296 | 58.93% |
| 2 | Dividend Champions List (Includes foreign aristocrats) | 74 | 14.88% |
| 3 | Yield 4+% (High-Yield Blue-Chip ETFs Yield 3.6%) | 16 | 3.37% |
| 4 | LT Consensus Total Return Potential 8+% (My Rule Of Thumb For Defensive Blue-Chips) | 10 | 2.18% |
| 5 | Dividend Safety Score 81+% (Very Safe, 2% or less severe recession cut risk) | 8 | 1.79% |
| 6 | Quality Score 80+% (Master List Average, Super SWAN Quality) | 7 | 1.59% |
(Source: DK Research Terminal)
This took me 2 minutes, and here are the results.
My, Oh My, 7 High-Yield Dividend Aristocrat Strong Buys
(Source: DK Zen Research Terminal)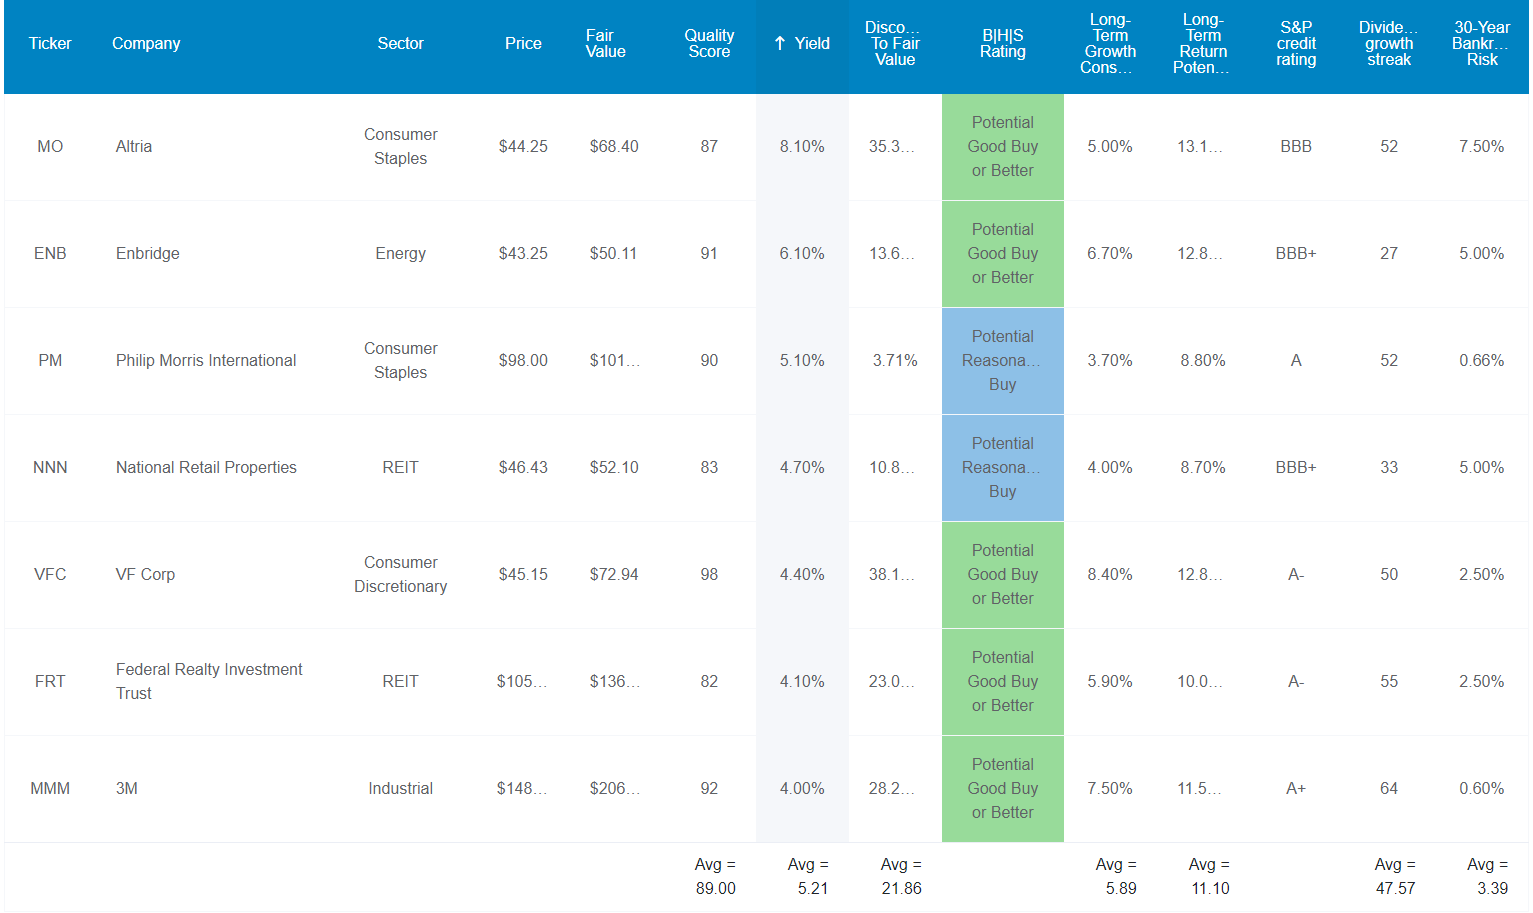
I’ve linked to articles exploring each company’s long-term growth prospects, investment thesis, risk profile, valuation, and return potential.
- Altria (MO)
- Enbridge (ENB)
- Philip Morris International (PM)
- National Retail Properties (NNN)
- V.F. Corp. (VFC)
- Federal Realty Investment Trust (FRT)
- 3M (MMM)
FAST Graphs Up Front
Altria 2024 Consensus Total Return Potential
(Source: FAST Graphs, FactSet)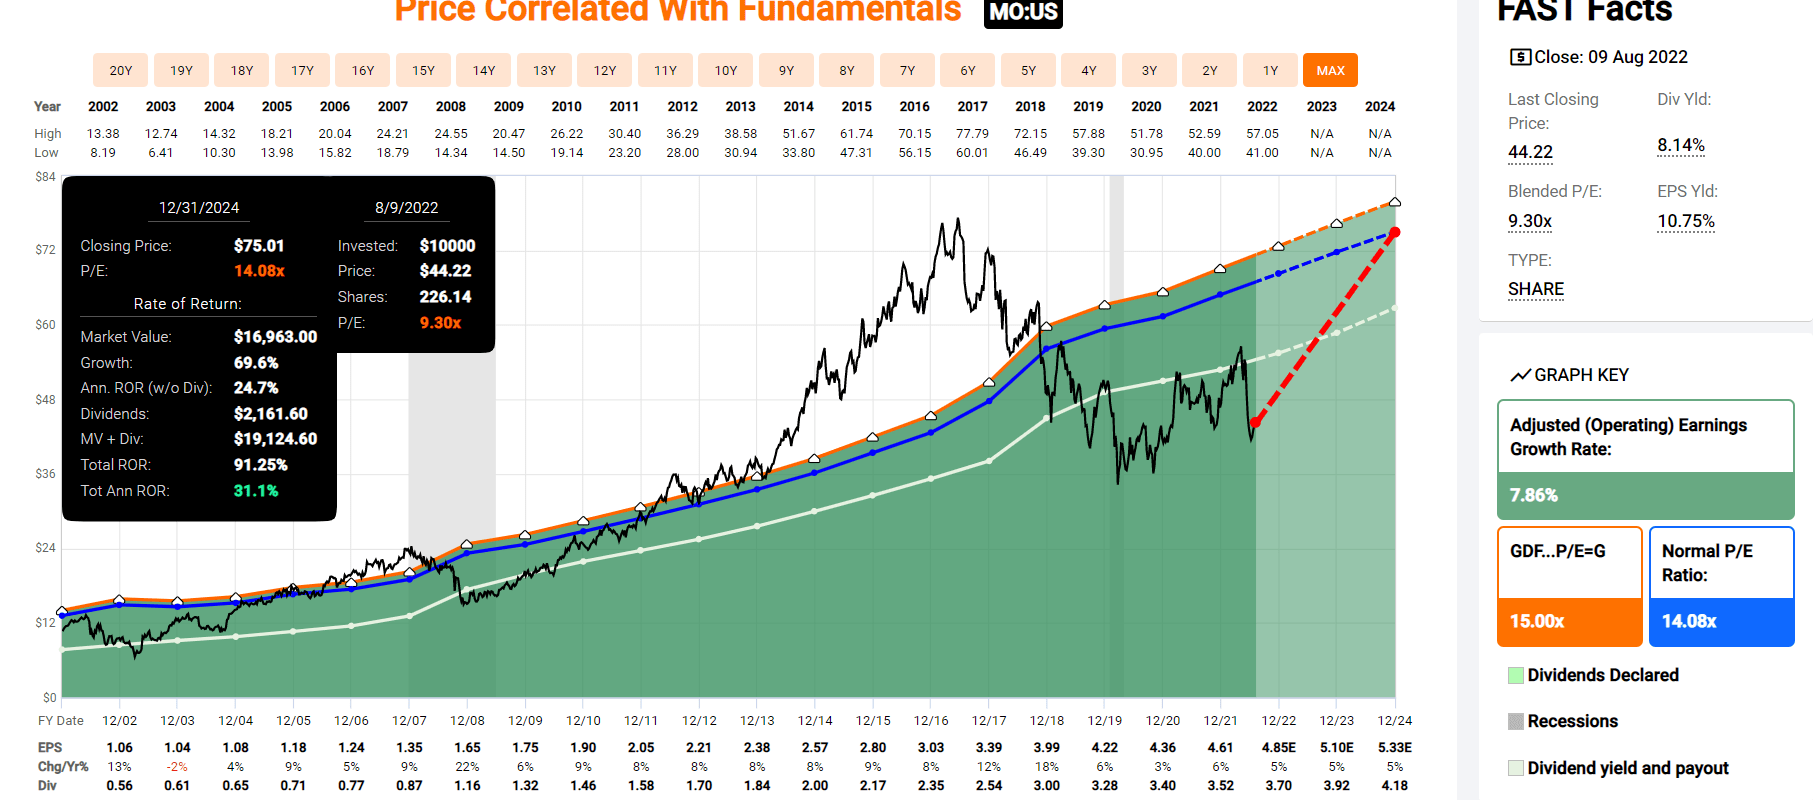
Enbridge 2024 Consensus Total Return Potential
(Source: FAST Graphs, FactSet)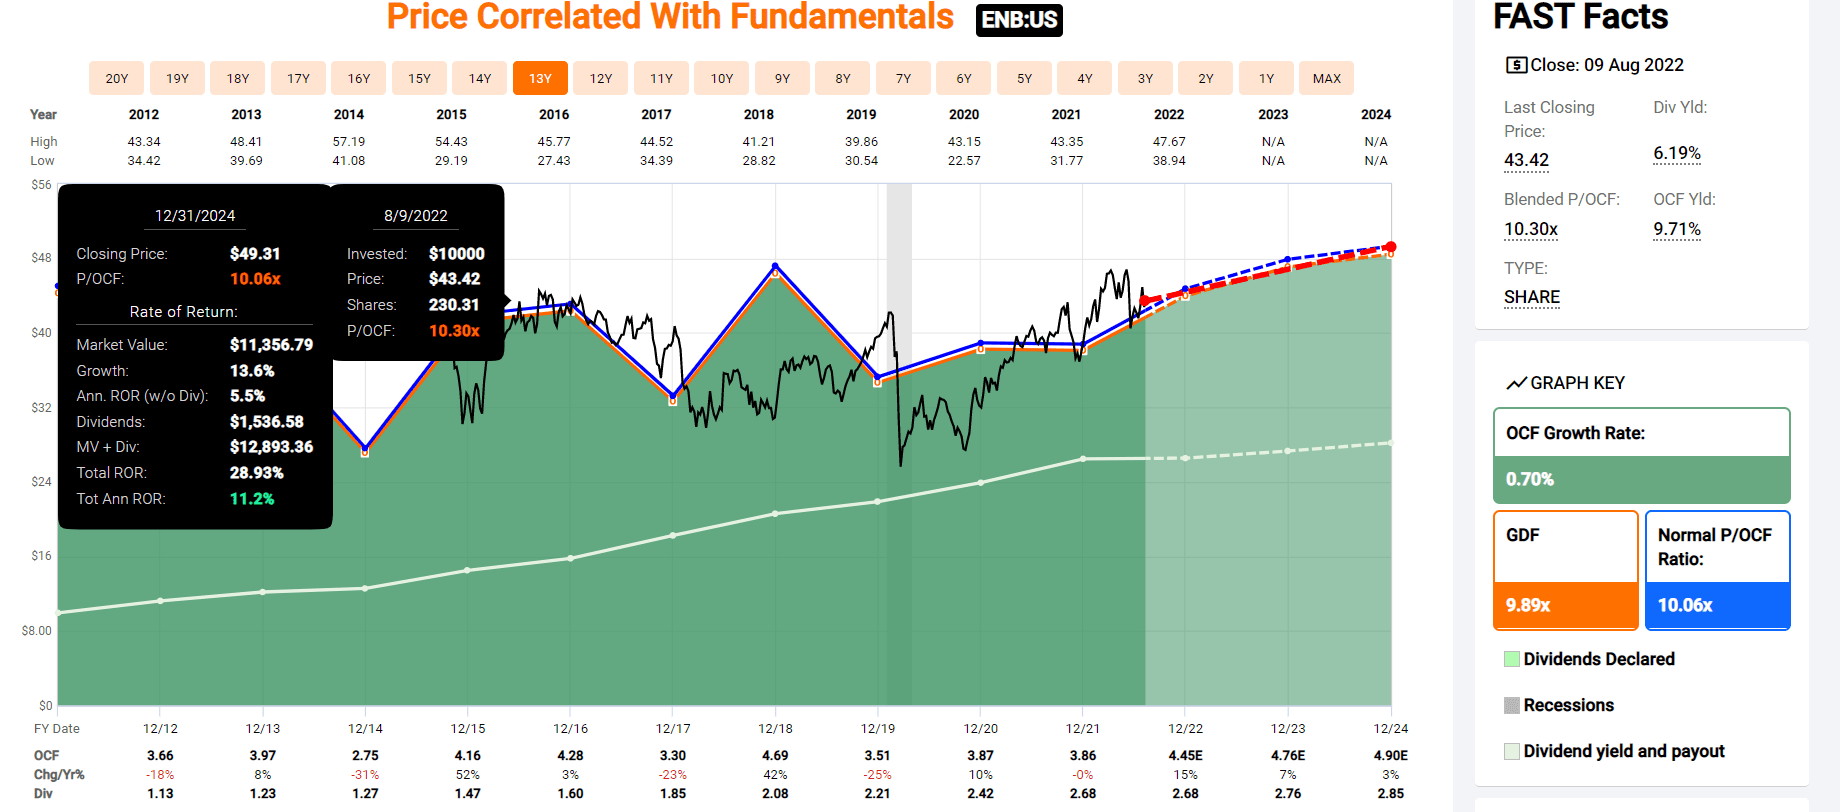
Philip Morris 2024 Consensus Total Return Potential
(Source: FAST Graphs, FactSet)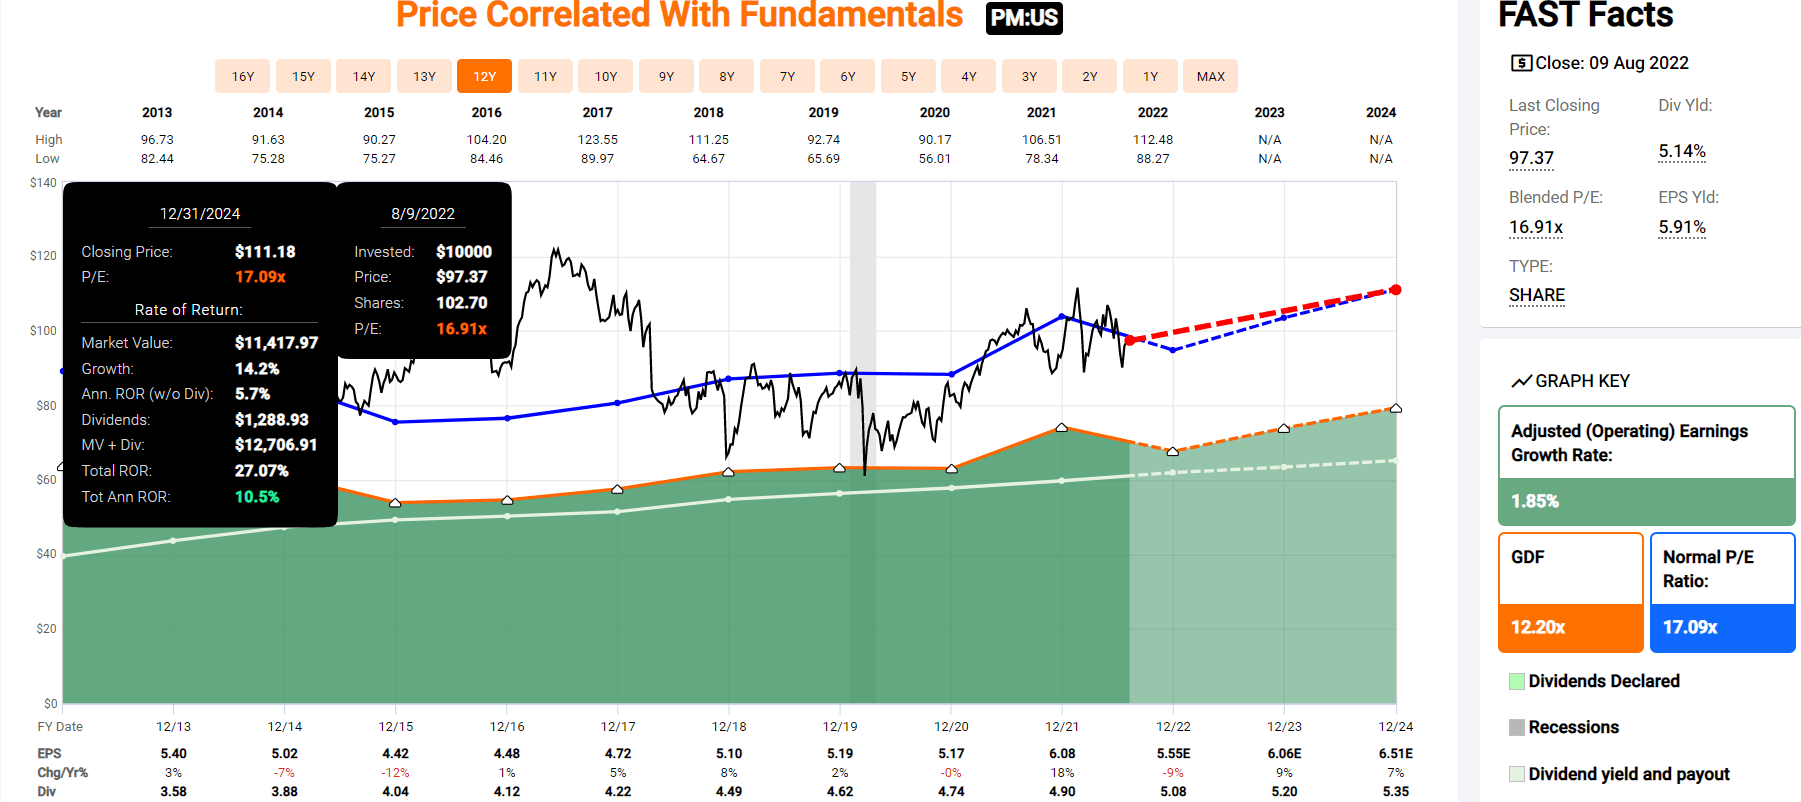
National Retail Properties 2024 Consensus Total Return Potential
(Source: FAST Graphs, FactSet)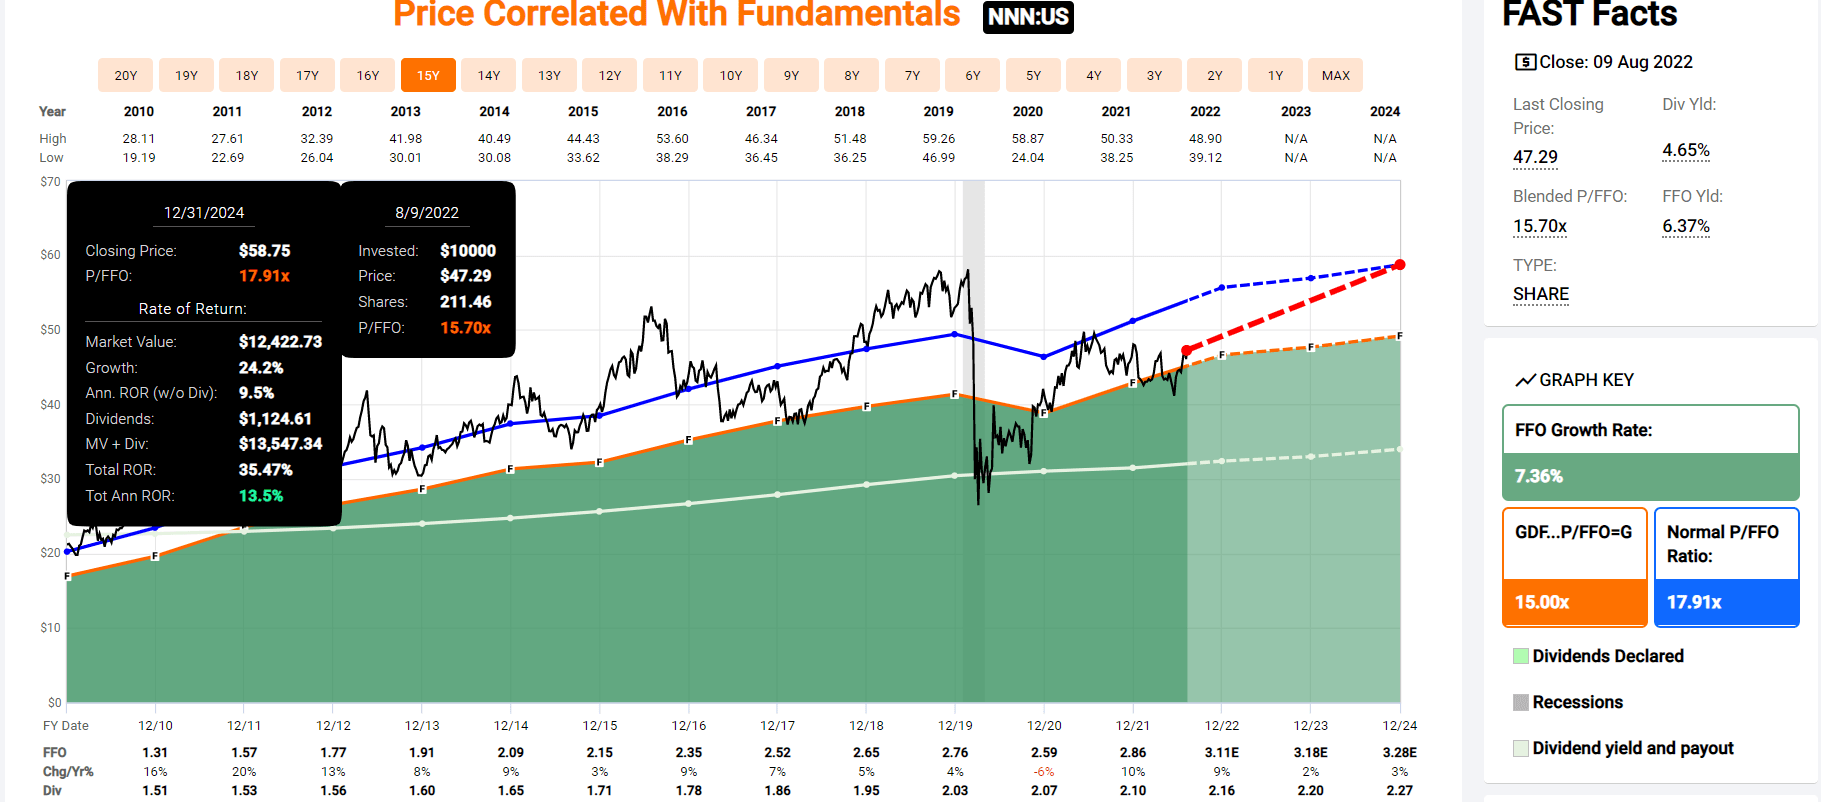
V.F. Corp. 2024 Consensus Total Return Potential
(Source: FAST Graphs, FactSet)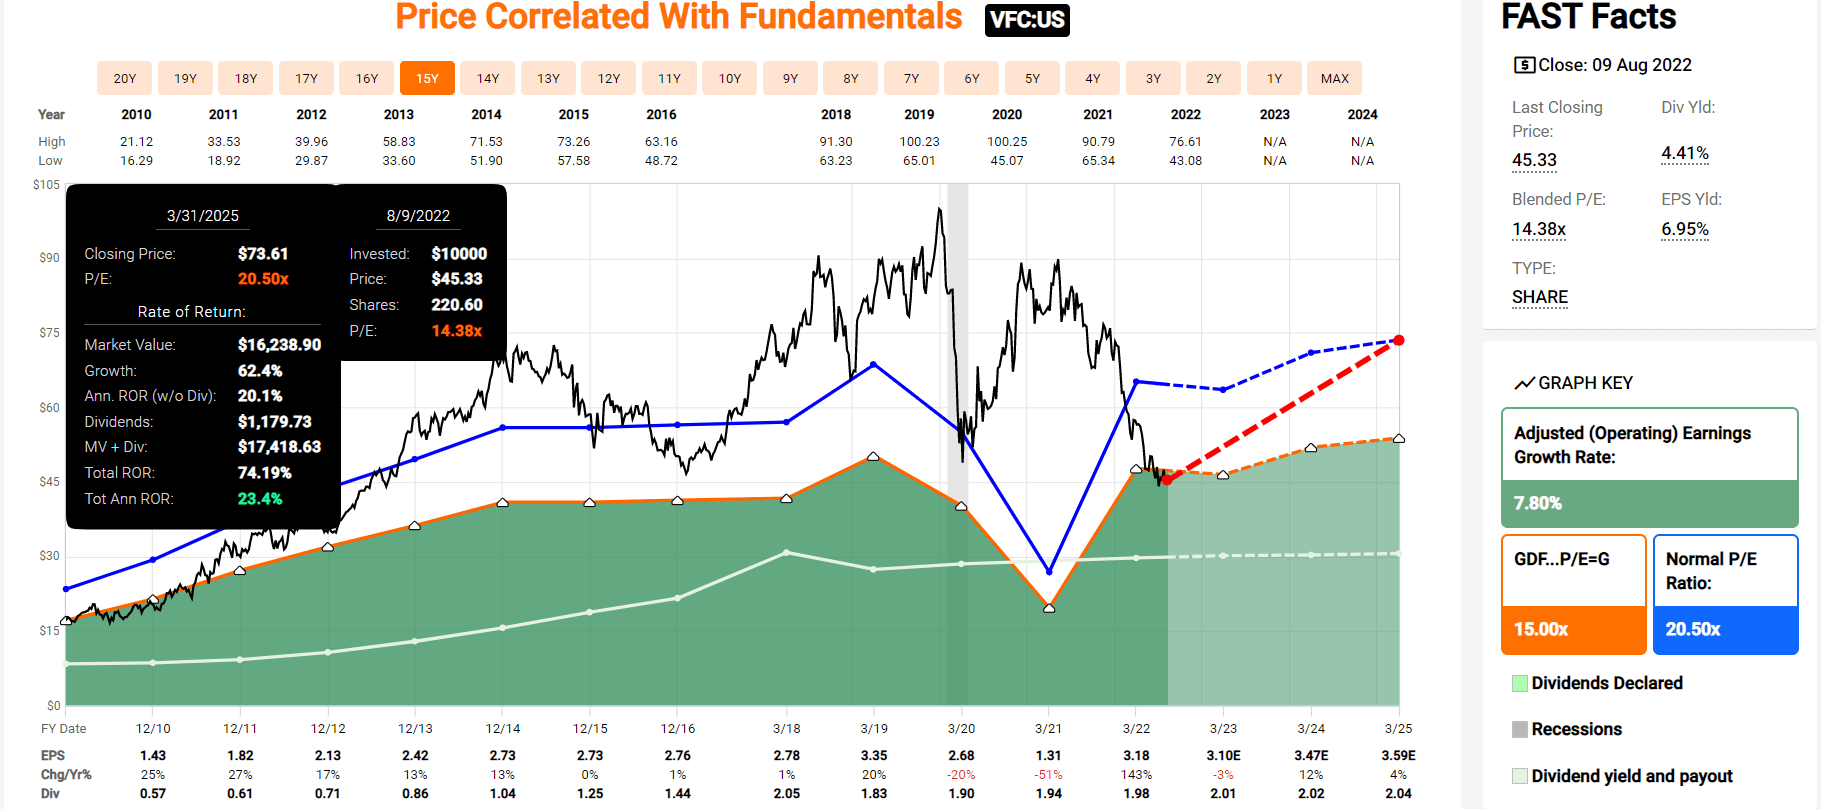
Federal Realty 2024 Consensus Total Return Potential
(Source: FAST Graphs, FactSet)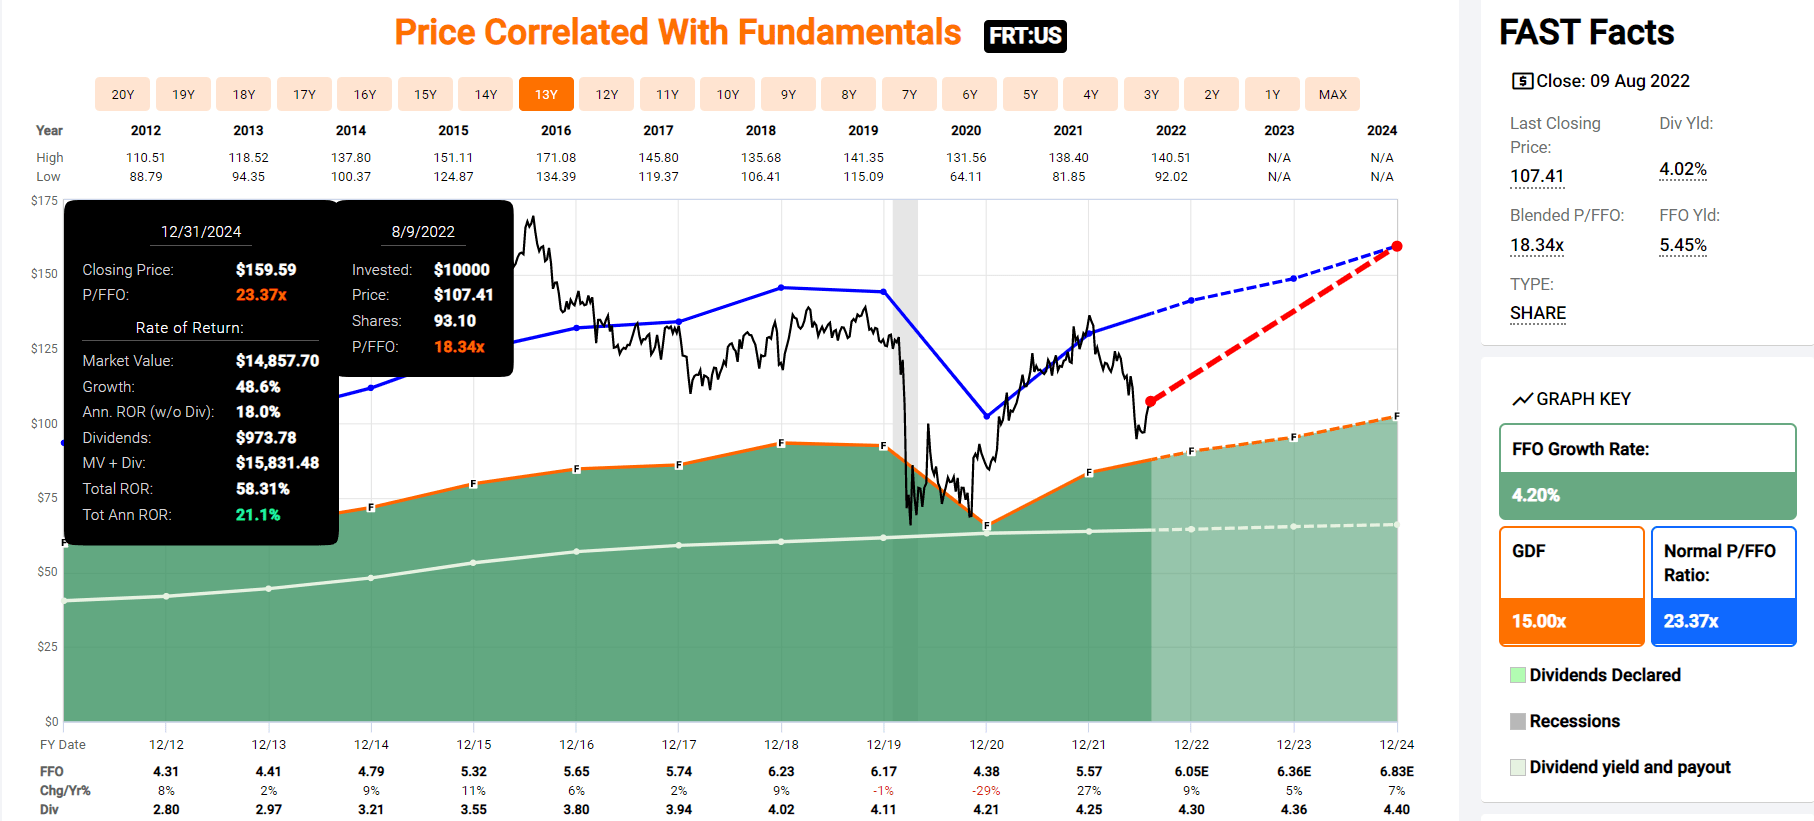
3M 2024 Consensus Total Return Potential
(Source: FAST Graphs, FactSet)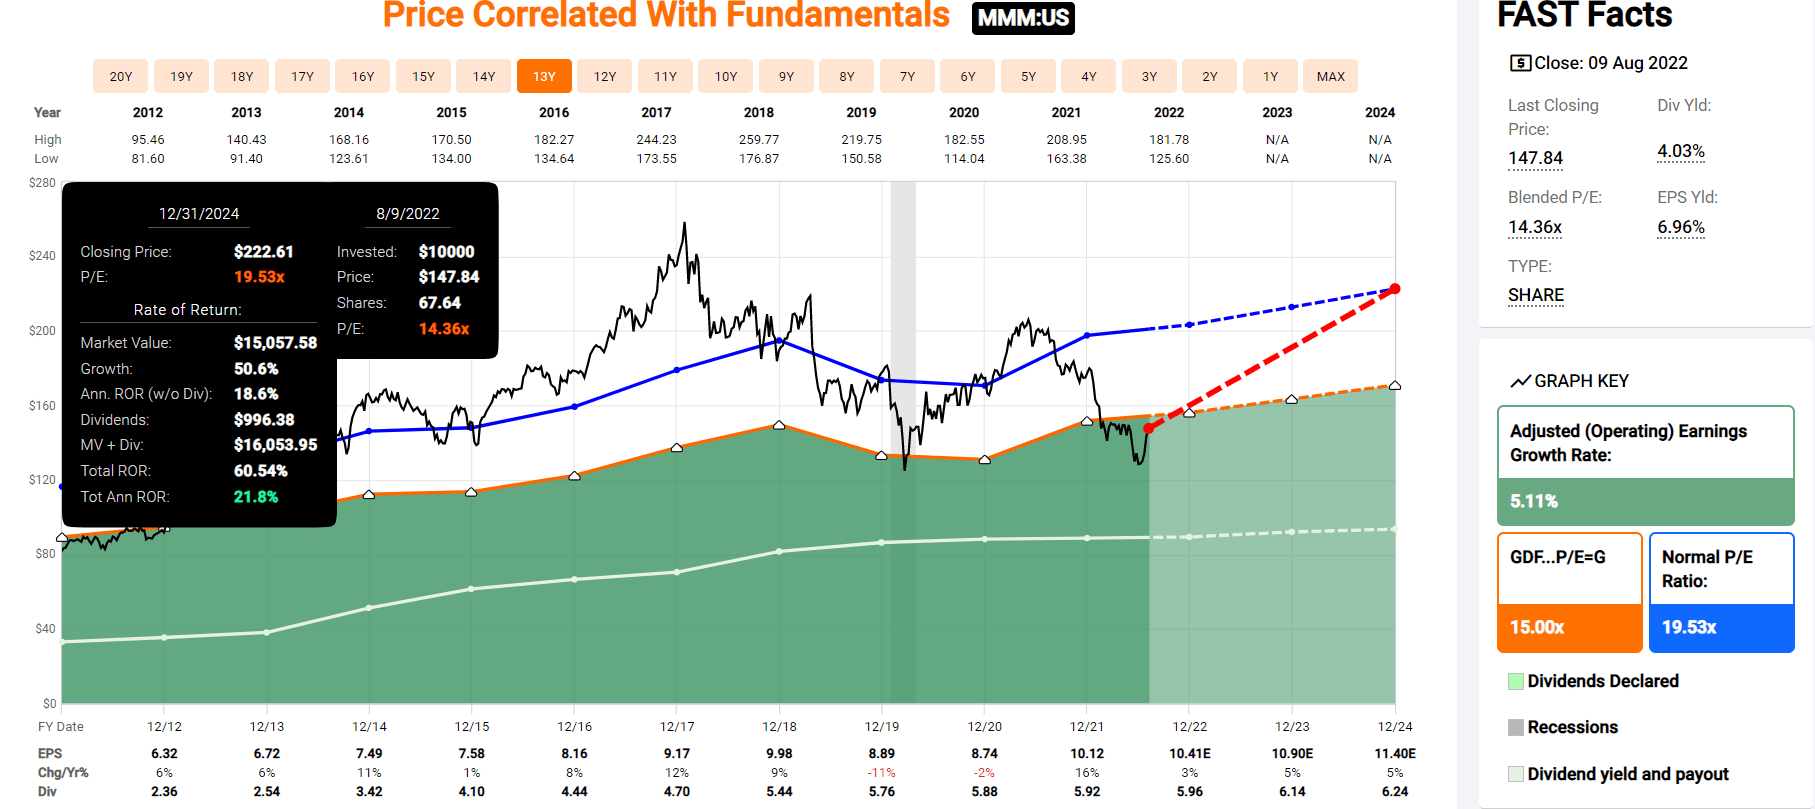
Now compare these to the S&P 500 consensus return potential.
S&P 500 2024 Consensus Total Return Potential
(Source: FAST Graphs, FactSet)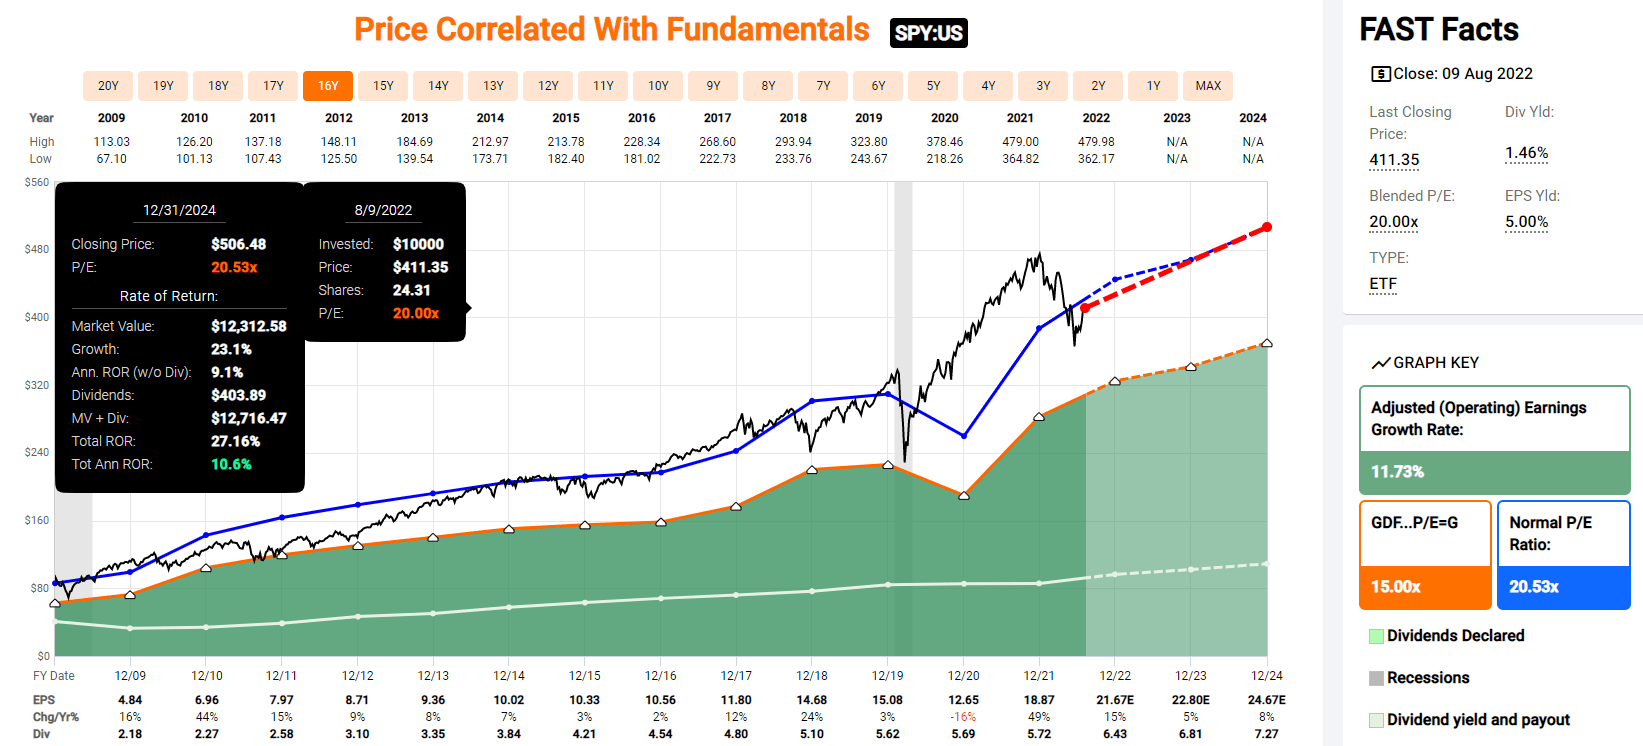
The analyst consensus is that the market could deliver around 11% annual returns through 2024.
- 19% CAGR average for these aristocrats (54% total returns by the end of 2024)
- almost 2X the S&P 500 consensus
- literally, Buffett-like returns from high-yield aristocrat bargains hiding in plain sight
But my goal isn’t to help you score a quick 54% return in three years; I’m trying to help you achieve life-changing, 10x inflation-adjusted long-term returns with maximum safe yield.
And here’s how these high-yield aristocrats can do that.
Seven Of The Potentially Safest Quality High-Yield Blue-Chips On Earth
These aren’t just blue-chips; they are Ultra SWAN (sleep well at night) aristocrats, as close to perfect quality dividend blue-chips as exist on Wall Street.
(Source: DK Zen Research Terminal)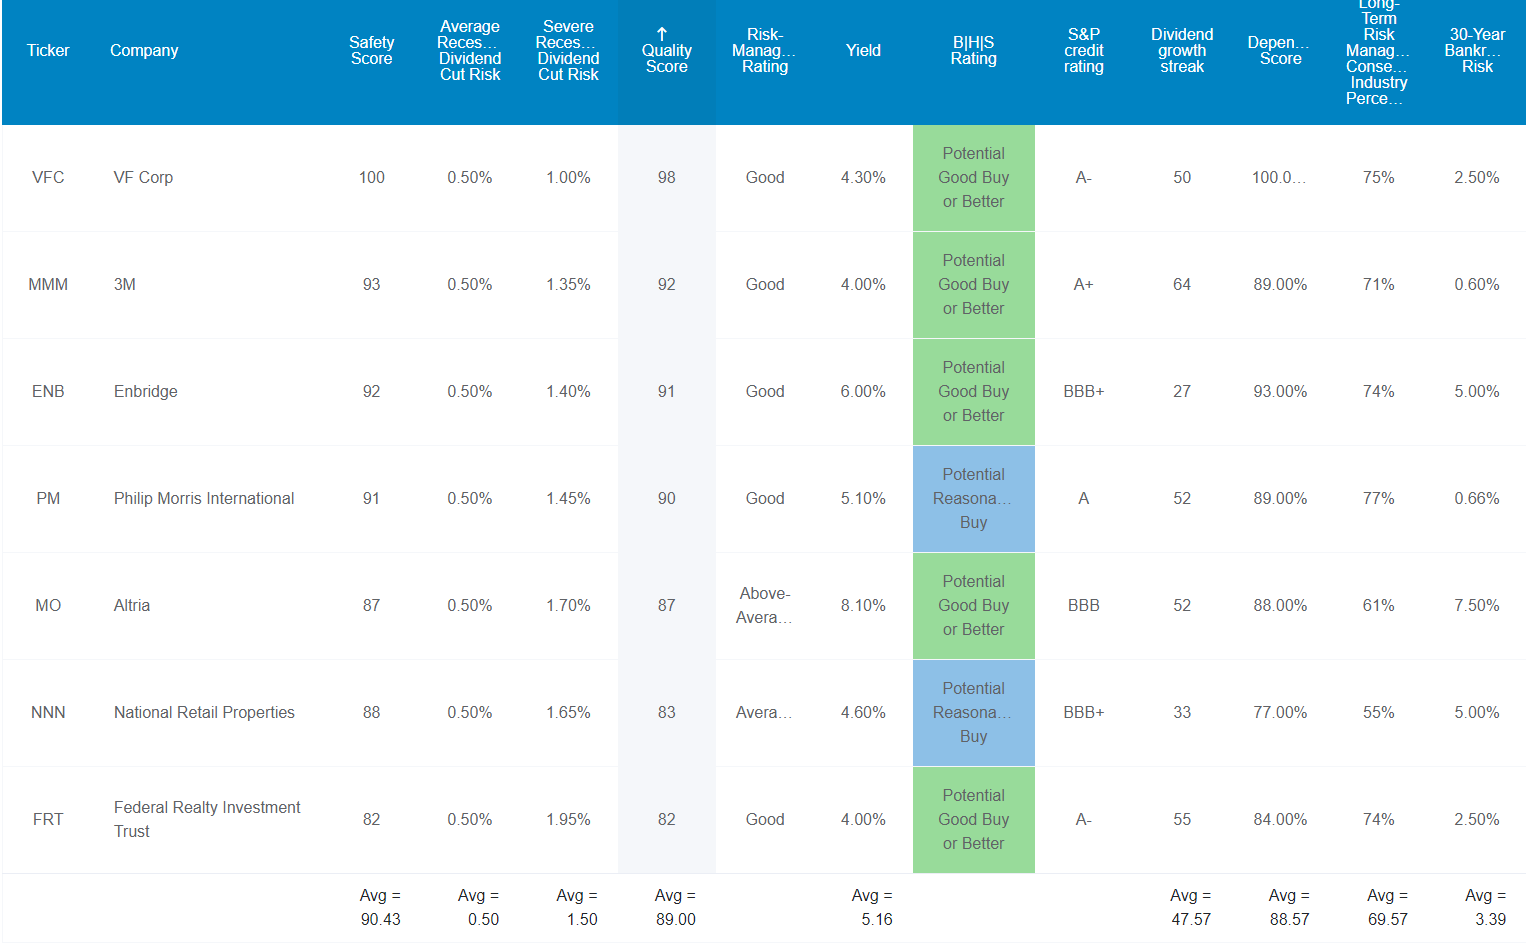
How can we tell? By comparing their fundamentals to those of the dividend aristocrats.
Higher Quality Than The Dividend Aristocrats: The Bluest Of Blue-Chips
| Metric | Dividend Aristocrats | 7 High-Yield Dividend Aristocrat Strong Buys | Winner Dividend Aristocrats |
Winner 7 High-Yield Dividend Aristocrat Strong Buys |
| Quality | 87% | 89% | 1 | |
| Safety | 90% | 90% | 1 | 1 |
| Average Recession Dividend Cut Risk | 0.5% | 0.5% | 1 | 1 |
| Severe Recession Dividend Cut Risk | 1.5% | 1.5% | 1 | 1 |
| Dependability | 84% | 89% | 1 | |
| Dividend Growth Streak (Years) | 44.8 | 47.6 | 1 | |
| Long-Term Risk Management Industry Percentile | 67% Above-Average | 70% Good | 1 | |
| Average Credit Rating | A- Stable | A- Stable | 1 | 1 |
| Average Bankruptcy Risk | 3.04% | 3.39% | 1 | |
| Average Return On Capital | 88% | 259% | 1 | |
| Average ROC Industry Percentile | 69% | 87% | 1 | |
| 13-Year Median ROC | 74% | 172% | 1 | |
| Forward PE | 20.5 | 14.2 | 1 | |
| Discount To Fair Value | -1% | 21% | 1 | |
| DK Rating | Hold | Strong Buy | 1 | |
| Yield | 2.4% | 5.2% | 1 | |
| LT Growth Consensus | 8.7% | 5.9% | 1 | |
| Total Return Potential | 11.1% | 11.1% | 1 | 1 |
| Risk-Adjusted Expected Return | 7.5% | 7.5% | 1 | 1 |
| Inflation & Risk-Adjusted Expected Return | 5.3% | 5.3% | 1 | 1 |
| Conservative Years To Double | 13.5 | 13.5 | 1 | 1 |
| Total | 10 | 19 |
(Source: DK Zen Research Terminal)
These high-yield aristocrats tie or slightly beat the average aristocrat, including with an average recession dividend cut risk of 0.5% and 1.5% in a severe recession.
- 1 in 200 chance of cutting in a historically average recession since WWII
- 1 in 67 chance of cutting in a Pandemic or Great Recession level downturn
The dividend aristocrats average a 45-year dividend growth streak, more than double the Ben Graham standard of excellence. These aristocrats average a 48-year streak, just two years shy of making this a dividend king portfolio.
Joel Greenblatt considers return on capital his gold standard proxy for quality and moatiness.
- Return on capital = annual pre-tax income/the money it takes to run the business
- S&P 500’s 2021 ROC was 14.6%
The aristocrats average an 88% return on capital, 6X that of the S&P 500.
These high-yield aristocrats average 259% ROC over the last year.
- 3X that of the aristocrats
- 18X that of the S&P 500
Or, to put it another way, according to one of the greatest investors in history (40% annual returns for 21 years), these high-yield aristocrats Ultra SWANs are 18X higher quality than the average S&P 500 company.
Their average ROC industry percentile is 87% meaning they have higher ROC and quality (and wider moats) than all but 13% of their industry peers.
And their 13-year median ROC is 172%, not just sky-high but indicating their respective moats and quality have improved over time.
S&P estimates their average 30-year bankruptcy risk at 3.4%, an A-stable credit rating, similar to the aristocrats’ A-stable average.
- 30-year bankruptcy risk is a useful proxy for fundamental risk as defined by Warren Buffett
- risk is NOT volatility, it’s the probability of permanently losing your money
Six rating agencies estimate their long-term risk-management, ranging from political and regulatory risks to labor relations and environmental risks, in the 70th percentile.
Some Of The Best Risk Management Teams On Earth: 66th Percentile Among The World’s Best Blue-Chips
| Classification | Average Consensus LT Risk-Management Industry Percentile |
Risk-Management Rating |
| S&P Global (SPGI) #1 Risk Management In The Master List | 94 | Exceptional |
| Strong ESG Stocks | 78 |
Good – Bordering On Very Good |
| Foreign Dividend Stocks | 75 | Good |
| Ultra SWANs | 71 | Good |
| 7 High-Yield Aristocrat Strong Buys | 70 | Good |
| Low Volatility Stocks | 68 | Above-Average |
| Dividend Aristocrats | 67 | Above-Average |
| Dividend Kings | 63 | Above-Average |
| Master List average | 62 | Above-Average |
| Hyper-Growth stocks | 61 | Above-Average |
| Monthly Dividend Stocks | 60 | Above-Average |
| Dividend Champions | 57 | Average |
(Source: DK Research Terminal)
How good are these aristocrats’ risk management? They are in the top 33% of the world’s best companies including such legendary dividend blue-chips as:
- Stanley Black & Decker (SWK): Super SWAN dividend king
- Kimberly-Clark (KMB): Ultra SWAN dividend aristocrat
- Caterpillar (CAT): Ultra SWAN dividend aristocrat
- British American Tobacco (BTI): Ultra SWAN global aristocrat
- Johnson & Johnson (JNJ): Ultra SWAN dividend king
- T. Rowe Price (TROW): Ultra SWAN dividend aristocrat
Ok, so now that you see why I trust these aristocrats and so can you, let’s see why you might want to buy them today.
Wonderful Companies At Wonderful Prices
(Source: DK Zen Research Terminal)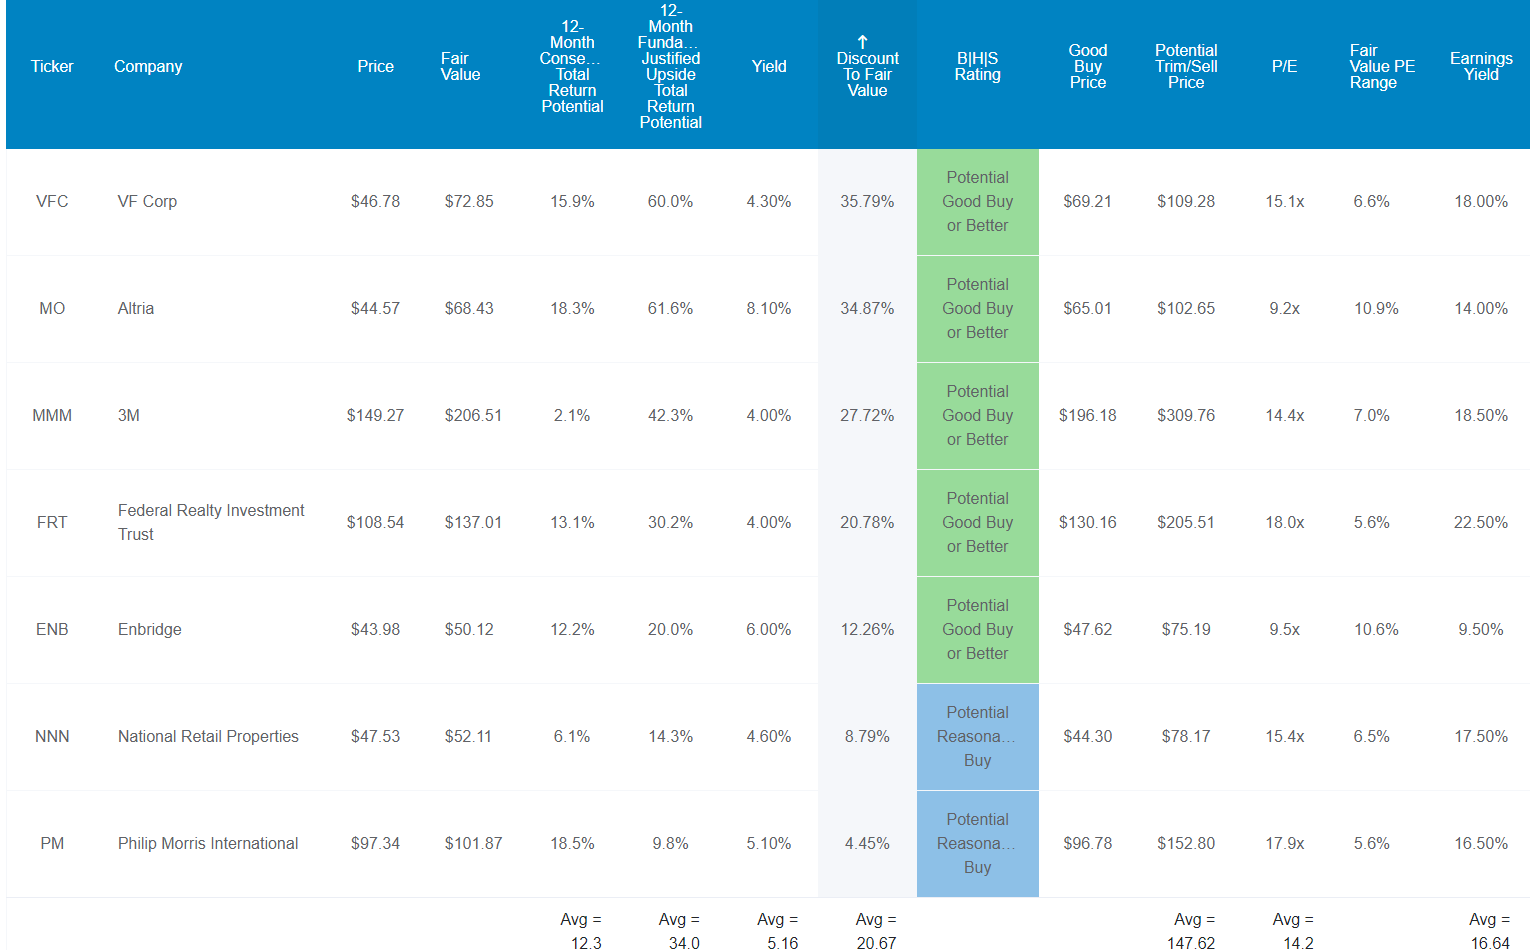
The S&P 500 now trades at almost 18X earnings and the aristocrats 20.5X.
These high-yield aristocrats, which, according to Joel Greenblatt, are 18X higher quality than the S&P 500 and 3X higher quality than the aristocrats, trade at 14.2X earnings.
- 20% lower PE than the market
- for 18X higher quality
- and 3.3X higher and much safer yield
Analysts expect a modest 12% total returns in the next year, though 19% CAGR returns over the next 2.5 years (54%, 2X the S&P 500’s consensus).
But they are so undervalued that if they grow as expected over the next year and return to historical mid-range fair value, you’ll earn a 34% return.
- 34% 12-month fundamentally justified total return potential
But my goal isn’t to help you earn 12% or 34% in a year, or 54% in three years.
My goal is to help you earn a 10X inflation-adjusted return so you can retire in safety and splendor.
And here’s how these 7 high-yield aristocrat strong buys can do that.
Long-Term Fundamentals To Help You Retire In Safety And Splendor
(Source: DK Zen Research Terminal)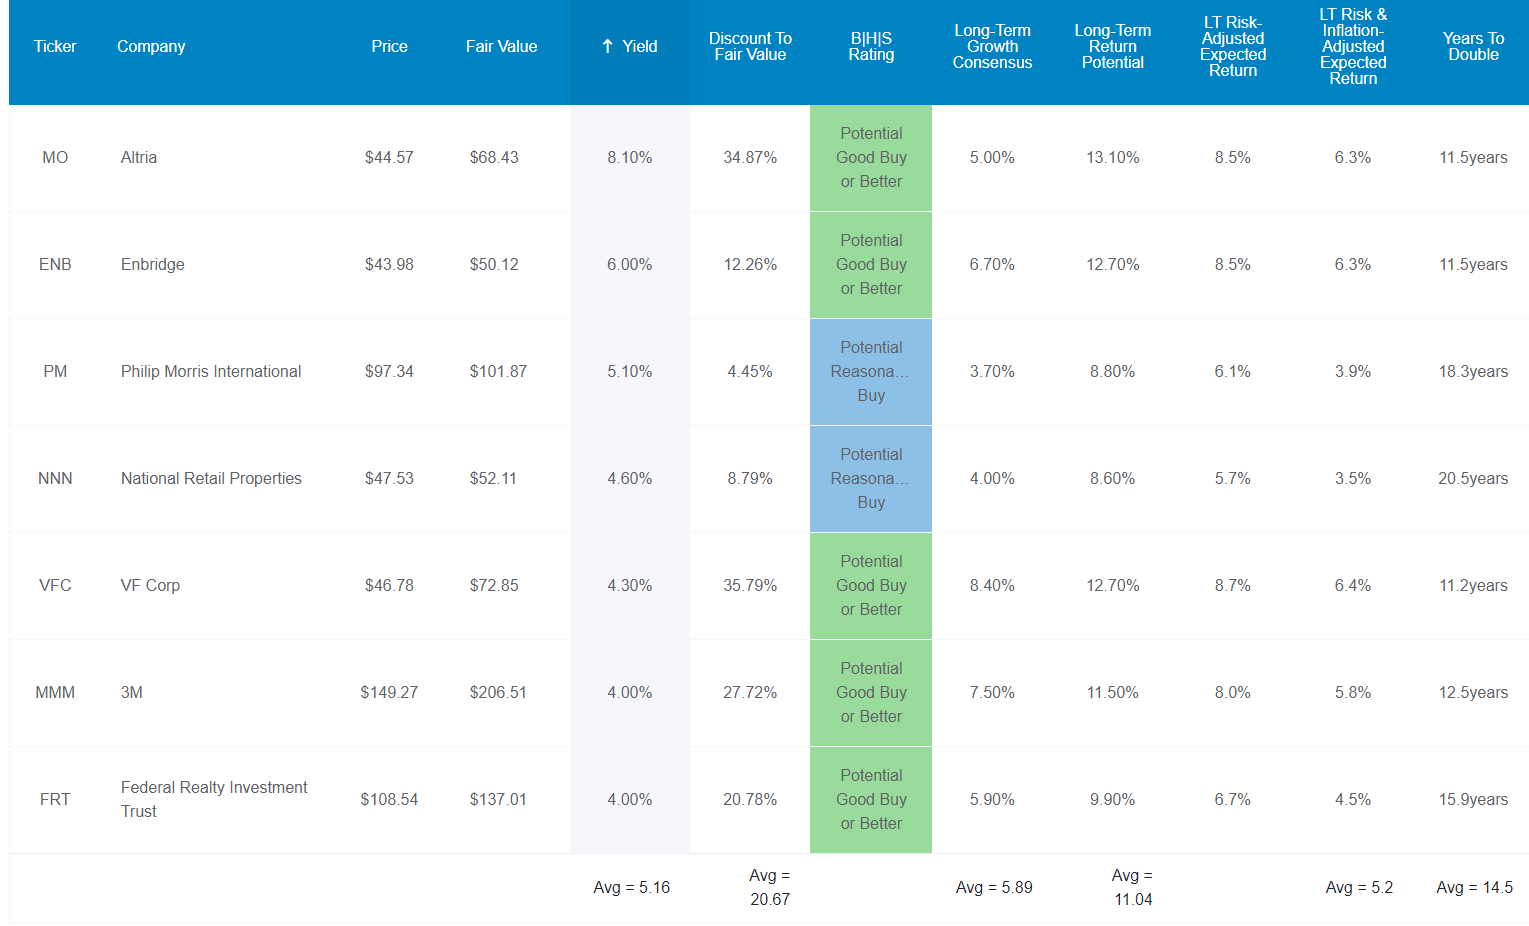
These high-yield aristocrat Ultra SWANs offer one of the potentially safest 5.2% yields on earth, and they are expected to grow at almost 6% and deliver 11% long-term returns. Doesn’t sound very exciting, does it?
| Investment Strategy | Yield | LT Consensus Growth | LT Consensus Total Return Potential | Long-Term Risk-Adjusted Expected Return | Long-Term Inflation And Risk-Adjusted Expected Returns | Years To Double Your Inflation & Risk-Adjusted Wealth |
10-Year Inflation And Risk-Adjusted Expected Return |
| 7 High-Yield Aristocrat Strong Buys | 5.2% | 5.9% | 11.1% | 7.7% | 5.5% | 13.1 | 1.71 |
| Dividend Aristocrats | 2.5% | 8.6% | 11.1% | 7.7% | 5.5% | 13.1 | 1.71 |
| S&P 500 | 1.6% | 8.5% | 10.1% | 7.1% | 4.9% | 14.8 | 1.61 |
(Sources: Morningstar, FactSet, Ycharts)
That’s equal to the dividend aristocrat’s long-term return potential consensus and 1% more than the S&P 500.
- but with more than 2X the yield of the aristocrats
- and over 3X the yield of the S&P 500
Inflation-Adjusted Consensus Total Return Potential Forecast: $1,000 Initial Investment
| Time Frame (Years) | 7.9% CAGR Inflation-Adjusted S&P Consensus | 8.9% Inflation-Adjusted Aristocrat Consensus | 8.9% CAGR Inflation-Adjusted 7 High-Yield Aristocrat Strong Buys Consensus | Difference Between Inflation-Adjusted 7 High-Yield Aristocrat Strong Buys Consensus And S&P Consensus |
| 5 | $1,461.18 | $1,530.17 | $1,530.17 | $68.99 |
| 10 | $2,135.06 | $2,341.43 | $2,341.43 | $206.37 |
| 15 | $3,119.71 | $3,582.79 | $3,582.79 | $463.08 |
| 20 | $4,558.47 | $5,482.29 | $5,482.29 | $923.83 |
| 25 | $6,660.75 | $8,388.86 | $8,388.86 | $1,728.10 |
| 30 (retirement time frame) | $9,732.58 | $12,836.40 | $12,836.40 | $3,103.82 |
| 35 | $14,221.09 | $19,641.92 | $19,641.92 | $5,420.83 |
| 40 | $20,779.62 | $30,055.54 | $30,055.54 | $9,275.92 |
| 45 | $30,362.83 | $45,990.17 | $45,990.17 | $15,627.35 |
| 50 (investing lifetime) | $44,365.65 | $70,372.93 | $70,372.93 | $26,007.27 |
(Sources: DK Research Terminal, FactSet)
These are stable blue-chips that have been growing at steady rates for decades and are expected to continue to do so for decades more.
Over 30 years, analysts think they and the aristocrats could deliver 13X inflation-adjusted returns. And over 50 years, potentially 70X real returns.
- 23X nominal return over 30 years
- 185X nominal return over 50 years
| Time Frame (Years) | Ratio Aristocrats/S&P Consensus | Ratio Inflation-Adjusted 7 High-Yield Aristocrat Strong Buys Consensus vs. S&P consensus |
| 5 | 1.05 | 1.05 |
| 10 | 1.10 | 1.10 |
| 15 | 1.15 | 1.15 |
| 20 | 1.20 | 1.20 |
| 25 | 1.26 | 1.26 |
| 30 | 1.32 | 1.32 |
| 35 | 1.38 | 1.38 |
| 40 | 1.45 | 1.45 |
| 45 | 1.51 | 1.51 |
| 50 | 1.59 | 1.59 |
(Sources: DK Research Terminal, FactSet)
Think 1% higher returns over time don’t matter? It means potentially 60% higher inflation-adjusted wealth over an investing lifetime.
- $300,000 extra inflation-adjusted wealth for the average retired couple
And don’t forget you’re getting 3.3X the market’s yield, and a much safer yield at that, on day one.
That sounds good, but what evidence is there that these aristocrats can deliver 11% long-term returns?
Historical Returns Since April 2008 (Equal Weighting, Annual Rebalancing)
“The future doesn’t repeat, but it often rhymes.” – Mark Twain
Past performance is no guarantee of future results. Still, studies show that blue-chips with relatively stable fundamentals over time offer predictable returns based on yield, growth, and valuation mean reversion.
Bank of America
So let’s look at how 5.2% yielding Ultra SWAN aristocrat performed over the last 14 years when about 91% of total returns were the result of fundamentals, not luck.
(Source: Portfolio Visualizer Premium)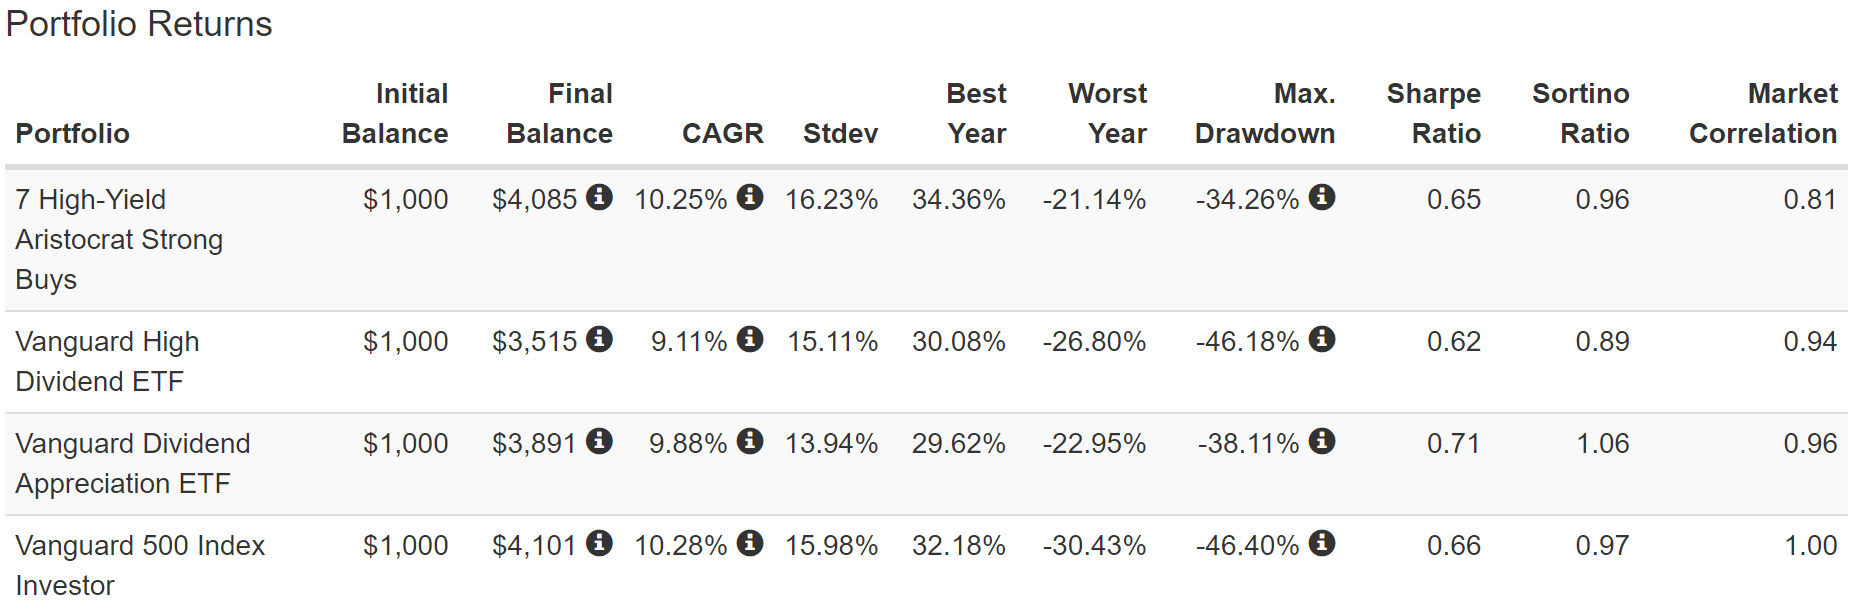
Despite long bear markets for many of these aristocrats, collectively, they delivered 10.3% CAGR total returns over the last 14 years, from one bear market to another.
They matched the S&P 500 over time and slightly beat the Vanguard High Dividend Yield ETF (VYM) and Vanguard Dividend Appreciation ETF (VIG).
VYM and VIG are two of the gold standard dividend blue-chip ETFs that I can recommend to help you create a rock-solid core for your Ultra sleep well at night retirement portfolio.
These 7 high-yield aristocrats suffered similar volatility to the market… except when it mattered most, during the Great Recession when they fell just 34%.
- a 60/40 retirement portfolio fell 32% during this time
- these aristocrats almost matched a 60/40 for defensiveness but with no bonds and with 3% higher annual returns since 2008
(Source: Portfolio Visualizer Premium)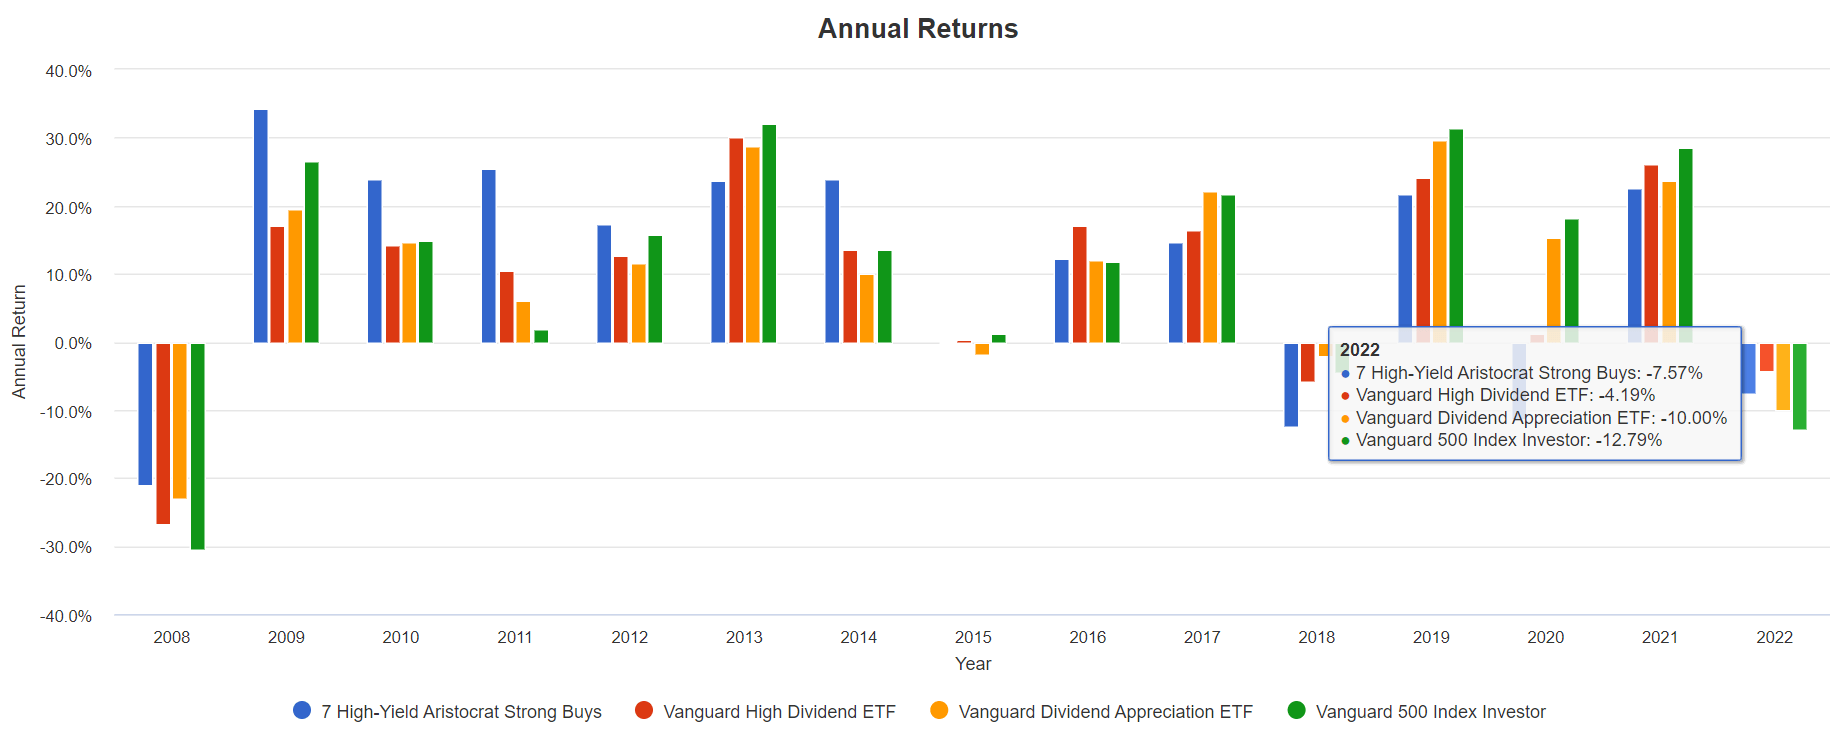
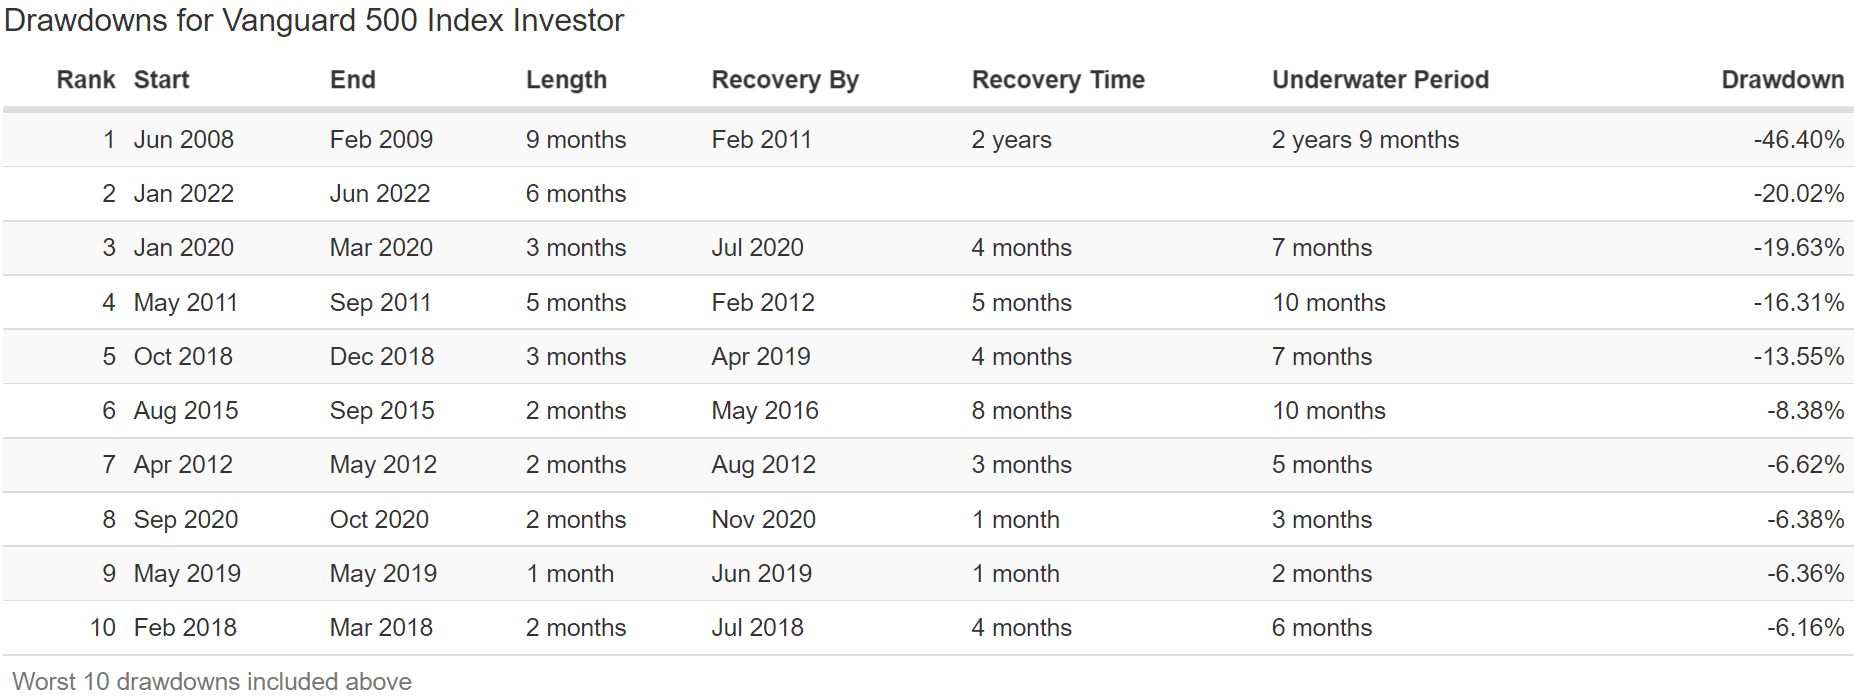
They were the most defensive in 2008, falling just 21% vs. the S&P 500’s 30%.
In 2022 they are down 7.6%, about half the S&P 500’s 13%.
(Source: Portfolio Visualizer Premium)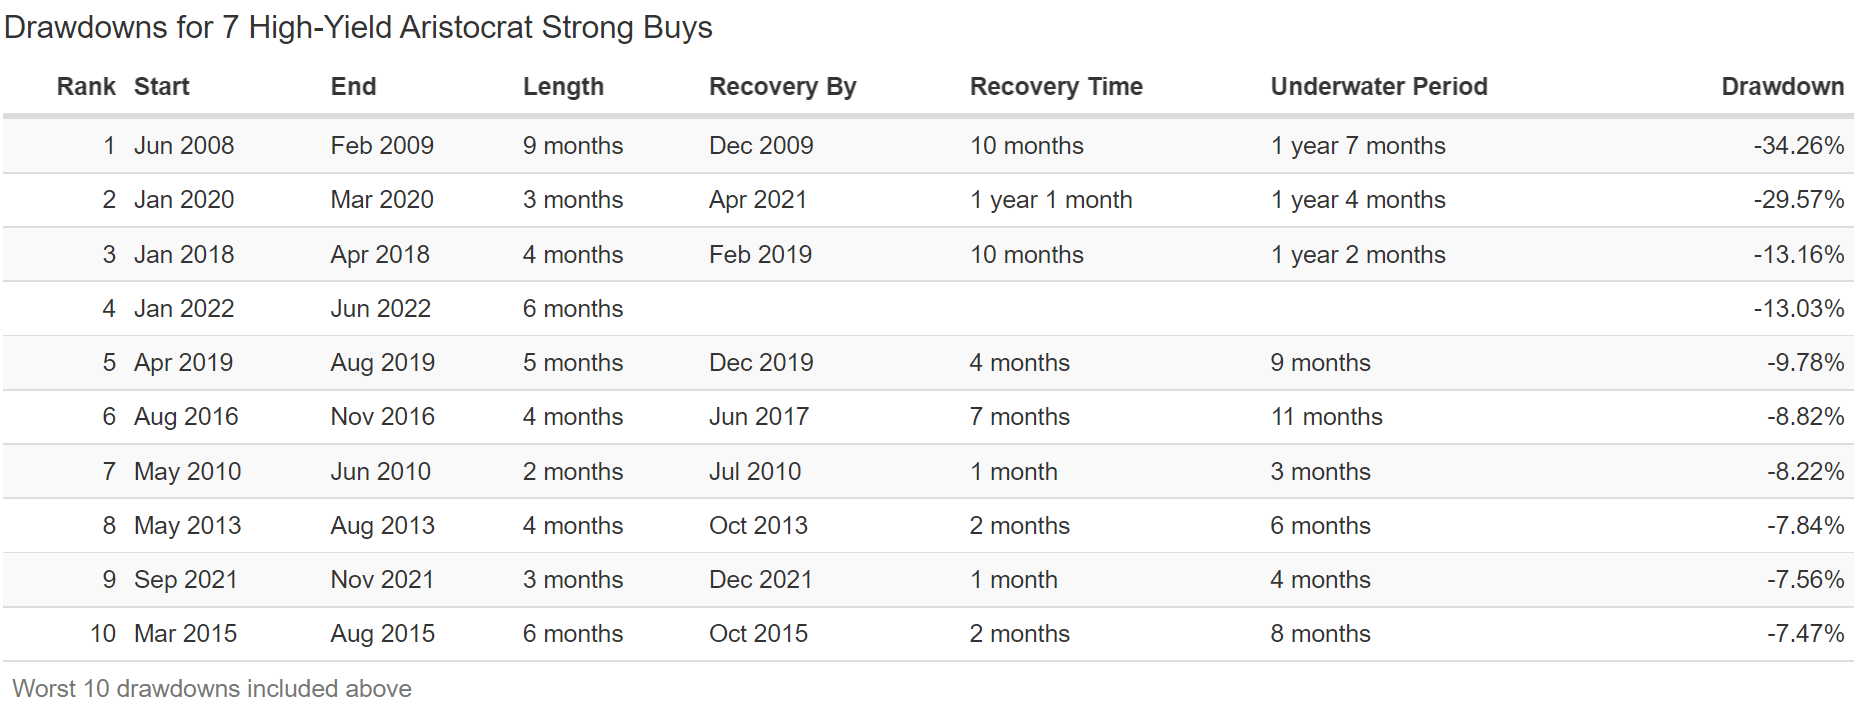
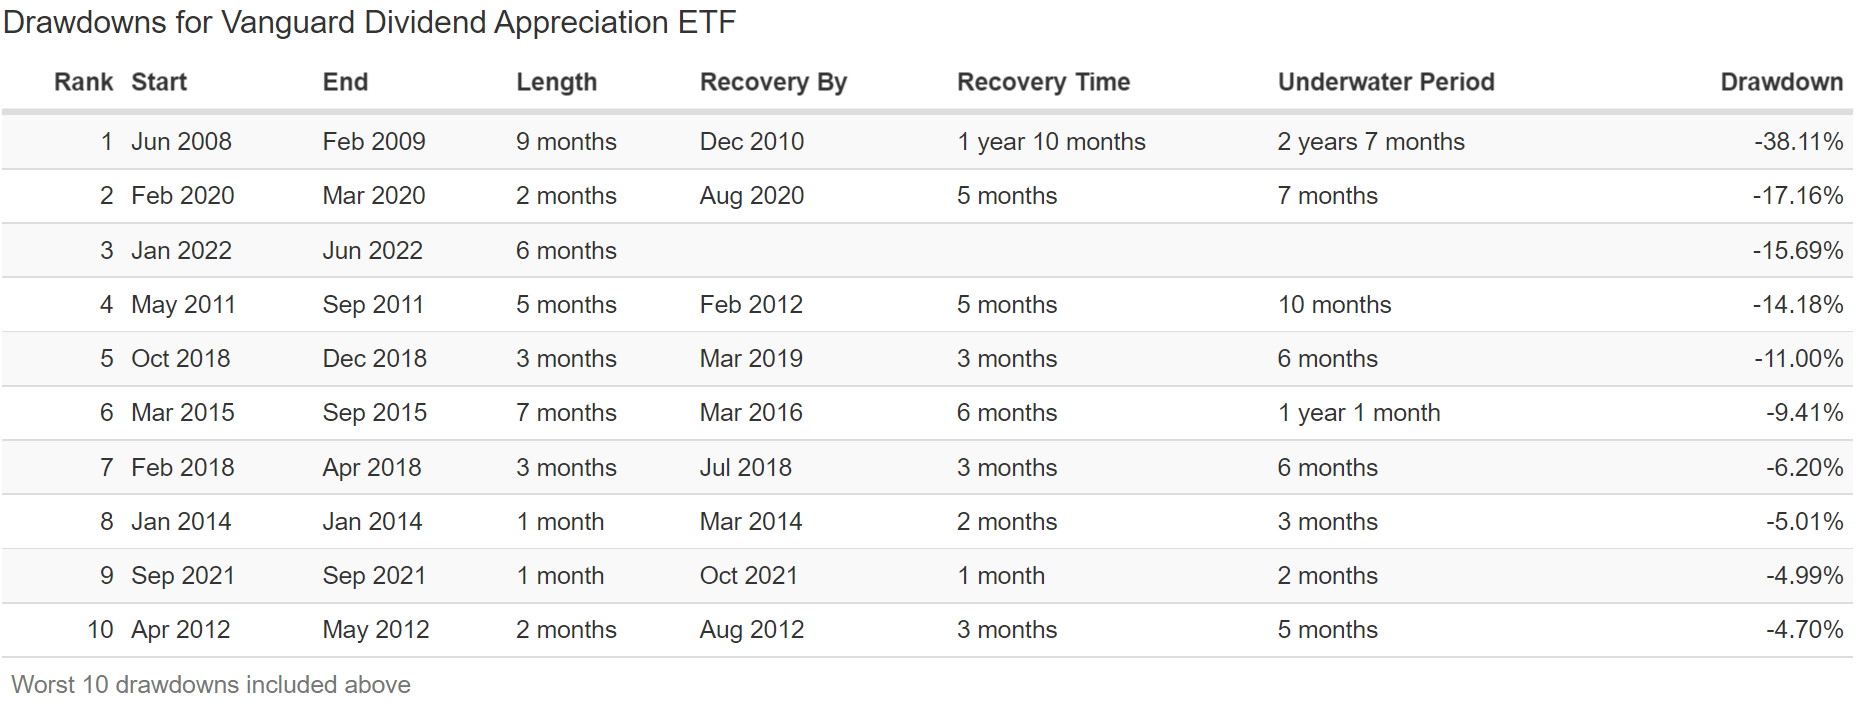
They did fall more in the pandemic, a 30% decline Vs. The S&P 500’s 20% March decline.
But in the 2022 bear market, they fell only 13% Vs. the S&P 500’s 20% (24% intraday low).
(Source: Portfolio Visualizer Premium) (Source: Portfolio Visualizer Premium) (Source: Portfolio Visualizer Premium)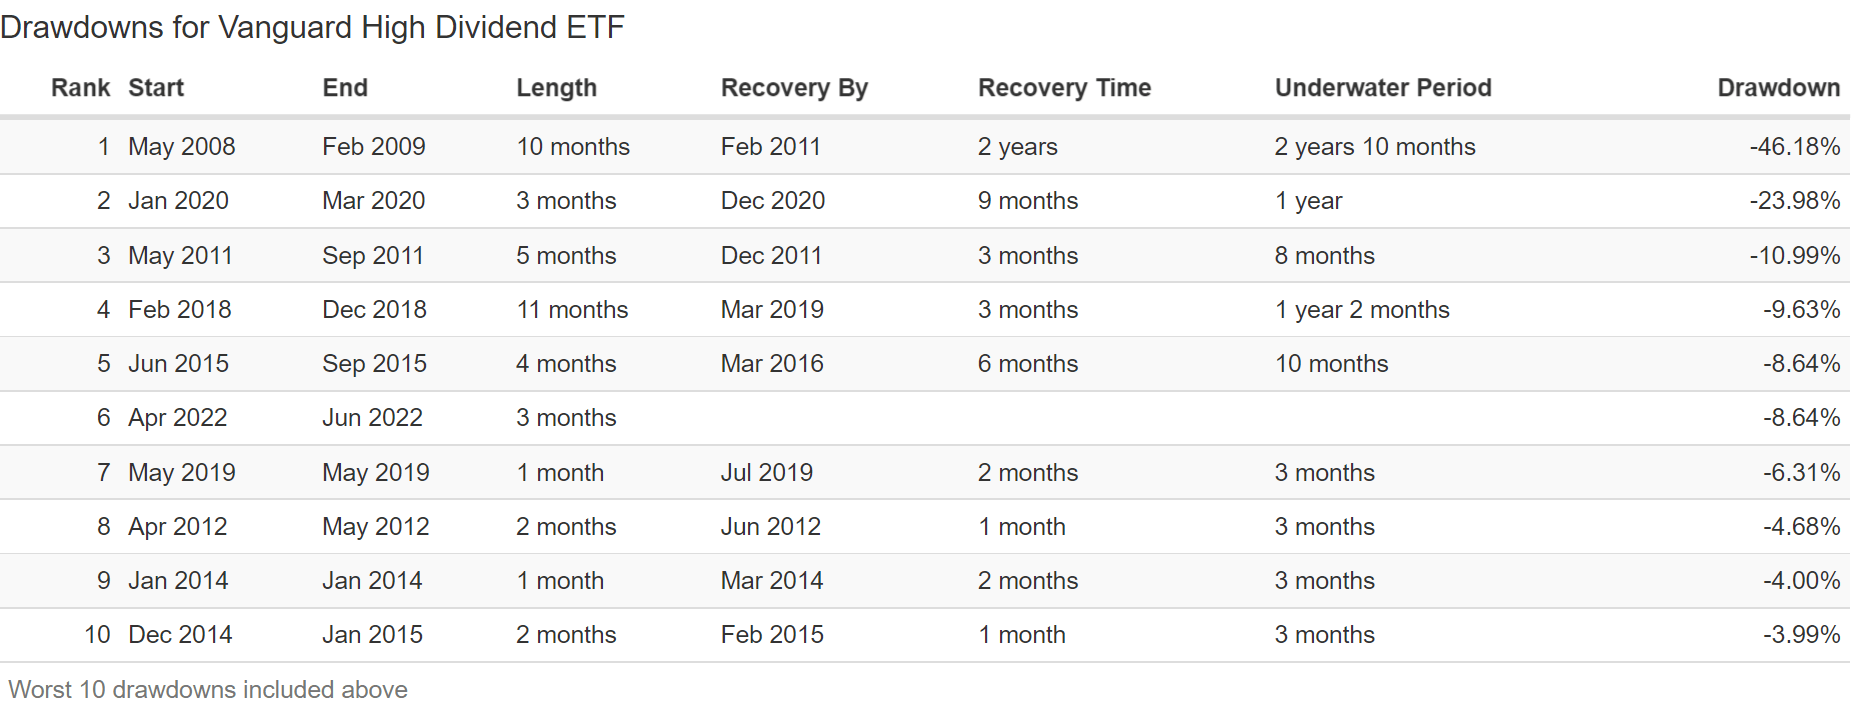
They weren’t as defensive as VYM, which didn’t even suffer a correction in this bear market.
- the benefit of owning 443 of the world’s best high-yield blue-chips vs. just 7 companies
But that’s still a very impressive performance in this bear market as well as 2018’s 20% plunge in the S&P when they fell just 13%.
- 35% smaller declines in mild bear markets
- 32% smaller declines in market crashes
And let’s not forget the main reason for owning high-yield aristocrats, safe and steady income.
Dividend Growth Blue-Chips You Can Trust
(Source: Portfolio Visualizer Premium) 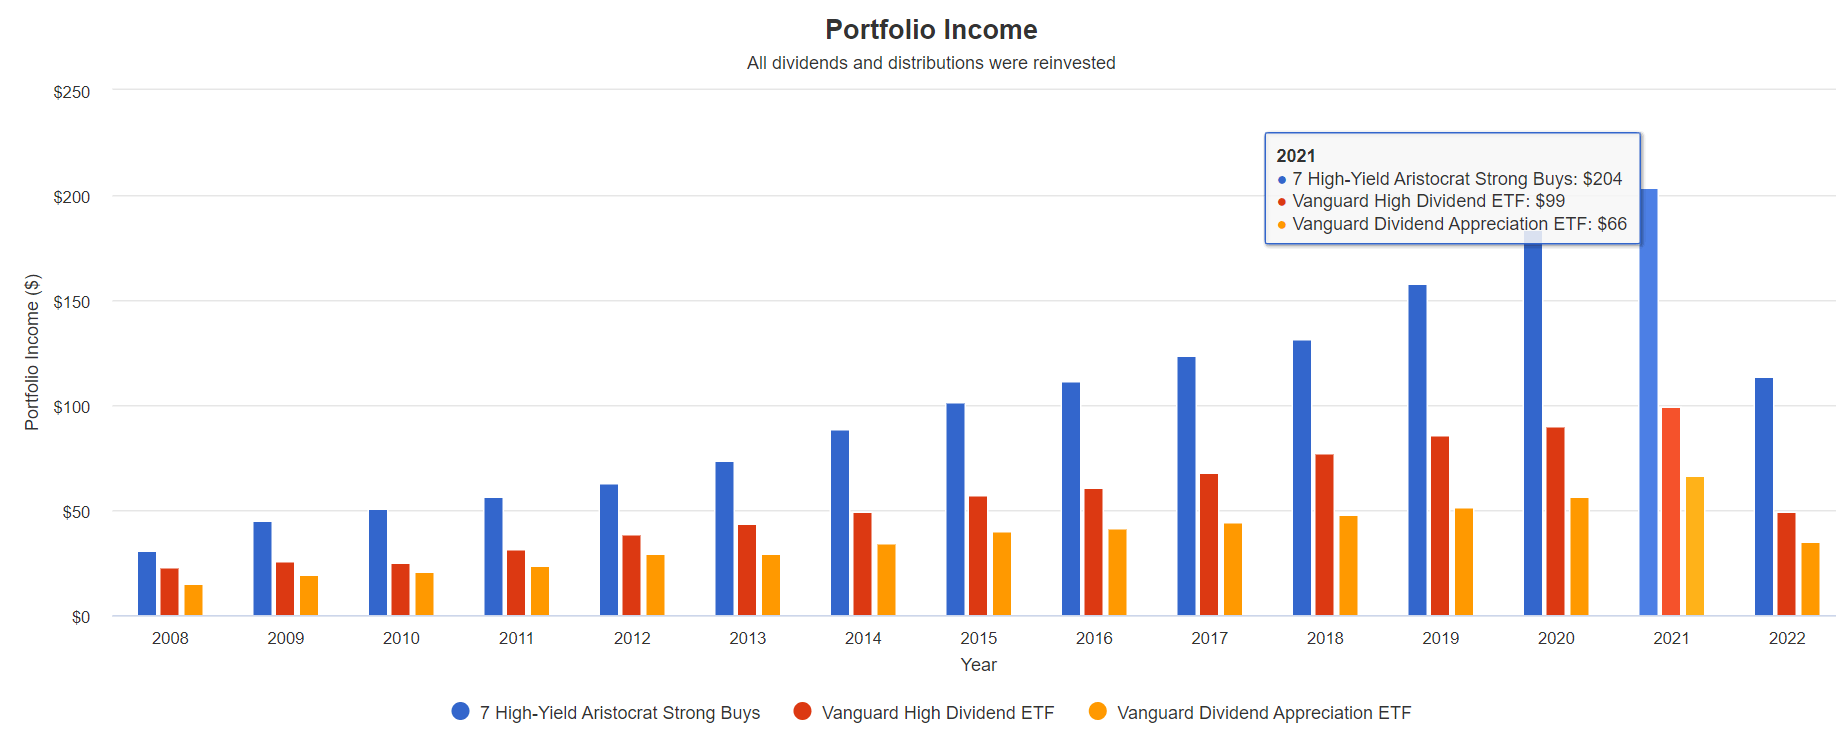
Very stable annual income growth from these high-yield aristocrats and VIG and VYM (which is why they are gold standard dividend ETFs).
| Portfolio | 2009 Income Per $1000 Investment | 2022 Income Per $1000 Investment | Annual Income Growth | Starting Yield |
2022 Yield On Cost |
| S&P 500 | $17 | $58 | 9.90% | 1.7% | 5.8% |
| Vanguard High Dividend ETF | $26 | $100 | 10.92% | 2.6% | 10.0% |
| Vanguard Dividend Appreciation ETF | $19 | $70 | 10.55% | 1.9% | 7.0% |
| 7 High-Yield Dividend Aristocrat Strong Buys | $45 | $226 | 13.22% | 4.5% | 22.6% |
(Source: Portfolio Visualizer Premium)
Over the last 13 years, these high-yield aristocrats delivered 13% annual income growth, 20% more than VIG, VYM, and 30% more than the S&P 500.
Cumulative Dividends Since 2009: $1,000 Initial Investment
| Metric | S&P 500 | Vanguard High Dividend ETF | Vanguard Dividend Appreciation ETF | 7 High-Yield Dividend Aristocrat Strong Buys |
| Total Dividends | $537 | $850 | $572 | $1,615 |
| Annualized Income Growth Rate | 9.90% | 10.92% | 10.55% | 13.22% |
| Total Income/Initial Investment | 0.54 | 0.85 | 0.57 | 1.62 |
| Inflation-Adjusted Income/Initial Investment | 0.38 | 0.61 | 0.41 | 1.15 |
| More Inflation-Adjusted Income Than The S&P 500/ETF | 3.01 | 1.9 | 2.82 |
(Source: Portfolio Visualizer Premium)
Investors who bought these aristocrats in 2009 when they yielded only 4.5% (5.2% today) are now sitting on a 23% yield on cost portfolio. They’ve recouped 115% of their inflation-adjusted initial investment, and their fundamental risk of losing all their money is significantly reduced.
- They are “playing with house money.”
- Shark Tank like royalties to get your money back
- and you still own the assets
These aristocrats paid 1.9X to 3X more in inflation-adjusted dividends than the S&P 500, VIG, or VYM, showcasing the power of individual dividend blue-chips to deliver far more income than any ETF can match.
What about the future?
Future Income Growth Consensus
| Analyst Consensus Income Growth Forecast | Risk-Adjusted Expected Income Growth | Risk And Tax-Adjusted Expected Income Growth |
Risk, Inflation, And Tax Adjusted Income Growth Consensus |
| 14.2% | 9.9% | 8.4% | 6.2% |
(Source: Portfolio Visualizer Premium)
Analysts expect the higher yield of these aristocrats to help them deliver 14% annual income growth in the future. When adjusted for the risk of these companies not growing as expected, inflation and taxes this is 6.2% real expected income growth.
Now compare that to what they expect from the S&P 500.
| Time Frame | S&P Inflation-Adjusted Dividend Growth | S&P Inflation-Adjusted Earnings Growth |
| 1871-2021 | 1.6% | 2.1% |
| 1945-2021 | 2.4% | 3.5% |
| 1981-2021 (Modern Falling Rate Era) | 2.8% | 3.8% |
| 2008-2021 (Modern Low Rate Era) | 3.5% | 6.2% |
| FactSet Future Consensus | 2.0% | 5.2% |
(Sources: S&P, FactSet, Multipl.com)
- 1.7% post-tax inflation-adjusted income growth from the S&P 500
- S&P 500’s historical post-tax inflation-adjusted income growth rate (current tax code) is 5.8% CAGR
- in the future, buybacks are expected to be the main way for the S&P 500 to return cash to shareholders rather than dividends
What about a 60/40 retirement portfolio?
- 0.5% consensus inflation, risk, and tax-adjusted income growth.
In other words, these 7 high-yield aristocrats’ strong buys are expected to potentially generate about 4X faster real income growth than the S&P 500 and 12X faster income growth than a 60/40.
- and 3X the yield of the S&P 500 and 60/40 and a safer yield at that
This is the power of high-yield aristocrat bargain hunting in this bear market.
Bottom Line: These 7 High-Yield Aristocrat Strong Buys Can Help You Potentially Retire Rich And Stay Rich In Retirement
2022 has been a terrifying time for many investors, with historic inflation, soaring interest rates, geopolitical turmoil, and skyrocketing commodity prices.
The good news is that inflation appears to be easing, thanks to falling commodity prices, and supply chains are showing signs of less stress.
Daily Shot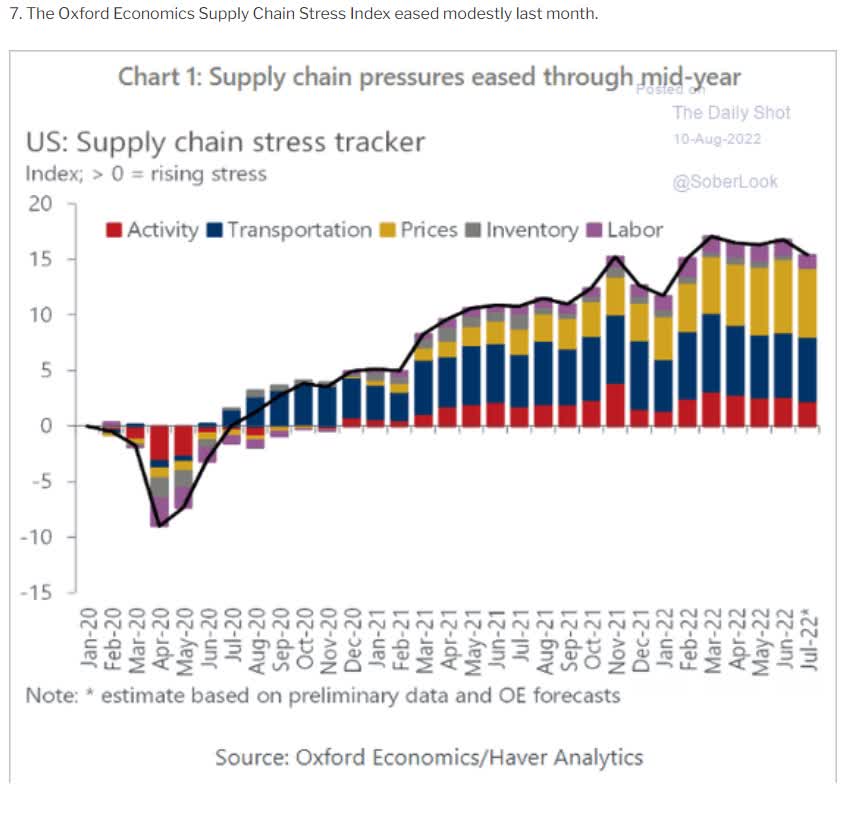
This means inflation is likely to keep trending lower. However, that doesn’t mean inflation is going to come down quickly.
Cleveland Federal Reserve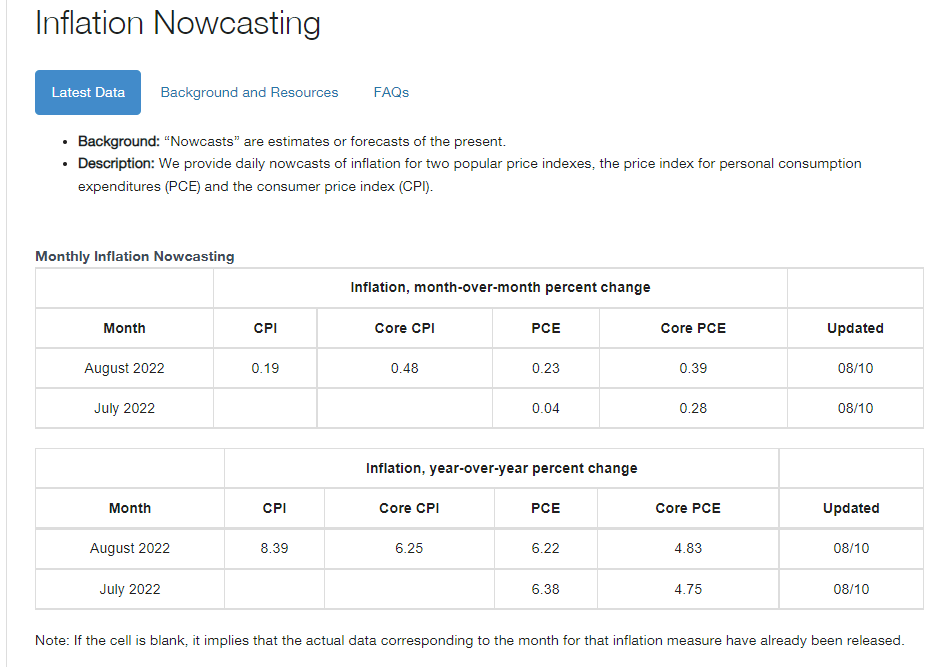
The Cleveland Fed’s daily inflation forecasting model estimates that CPI YOY inflation will fall to 8.4% next month while core (ex-food and fuel) rises slightly.
Inflation might prove sticky, with things like rent and wages keeping inflation higher for longer and forcing the Fed to hike more than expected.
This has been the biggest macroeconomic risk of 2022 and will likely persist into 2023.
But you don’t need to be an economist or inflation expert to do well in the stock market. In fact, you only have to remember one thing to set yourself up for success.
“We’re buying above-average quality companies, at below average prices.” – Joel Greenblatt
If you buy great companies at reasonable to attractive valuations and hold for the long-term within a diversified and prudently risk-managed portfolio, then you don’t have to worry about what happens with inflation, or interest rates, or the stock market in the short-term.
Ycharts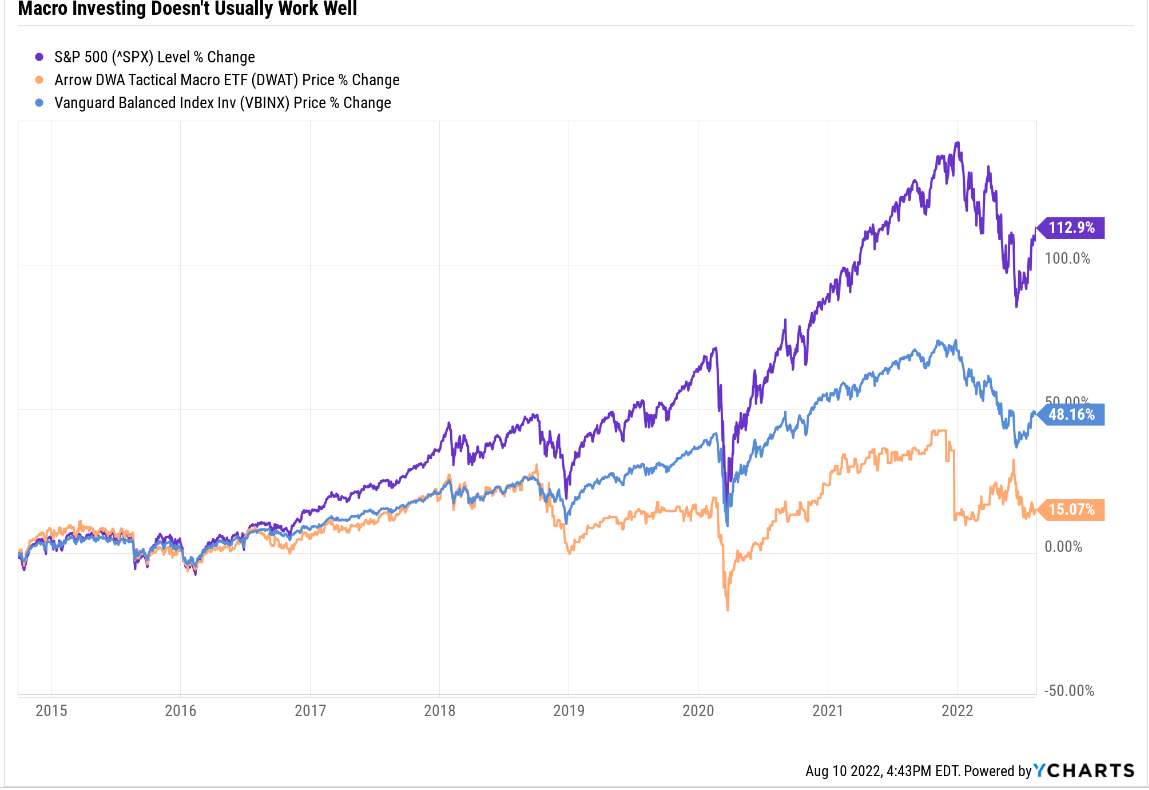
As you can see, “macro investing” doesn’t usually work well for investors.
- DWAT had delivered -8% inflation-adjusted returns over the last 7 years
- -1% CAGR real returns trying to be “tactical” with investing
- and charging a 1.7% expense ratio to help investors lose money
- because they try to time the market
Wanna know why?
“Nobody can predict interest rates, the future direction of the economy or the stock market. Dismiss all such forecasts and concentrate on what’s actually happening to the companies in which you’ve invested.” – Peter Lynch
The best companies on earth are managed by the best risk-managers in their respective industries. This includes such high-yield aristocrats as MO, VFC, ENB, MMM, FRT, PM, and NNN.
I can’t tell you what their prices will do in the short-term, but here is what I can tell you with very high confidence.
- a potentially very safe 5.2% yield (as safe as the dividend aristocrats)
- A- stable average credit rating and 3.4% fundamental risk
- 18X higher quality than the S&P 500 and 3X higher quality than the dividend aristocrats, according to Joel Greenblatt
- risk management in the top 30% of their industries
- 48-year average dividend growth streak (since 1974)
- 5.9% long-term growth prospects
- 11% annual (aristocrat matching) long-term return potential
- similar to what they’ve delivered for the last 11 years
- 20% historically undervalued (14.2X earnings) – 20% cheaper than the S&P 500
- 12X inflation-adjusted return potential over the next 30 years
Companies like these, within a diversified portfolio with the right asset allocation for your risk profile and goals, is how you practice high-yield investing right.
These aren’t sucker yields, value traps, or speculative “god, I hope this works out” Hail Marys.
These are seven of the most battle-tested dividend blue-chips on earth, in our opinion. Their management teams are in the top 30% of their industries at managing risk. They have A- rated balance sheets and 3.4% fundamental risk.
And most importantly, they have decades-long track records of steady and dependable growth that have helped many income investors retire in safety and splendor.
Do you want to sleep well at night knowing your hard-earned money is safe? No matter what the economy or stock market does next?
Do you dream of being able to retire off dividends alone, making the stock market’s crazy swings irrelevant to your standard of living?
Then high-yield aristocrat bargain hunting could be for you. Because with these seven aristocrats in your portfolio, you don’t have to pray for luck; you’ll make your own over time.
“Luck is what happens when preparation meets opportunity.” – Roman philosopher, Seneca the Younger
Be the first to comment