

valentinrussanov/E+ via Getty Images
A Quick Take On MN8 Energy
MN8 Energy, Inc. (MNX) has filed to raise $100 million in an IPO of its common stock, according to an S-1 registration statement.
The firm is a large operator of solar energy and related battery storage facilities in the United States.
When we learn more about management’s pricing and valuation assumptions for the IPO, I’ll provide an update.
MN8 Overview
New York, NY-based MN8 Energy, Inc. was founded as a unit of Goldman Sachs Asset Management to develop, acquire and operate solar energy facilities and storage capabilities in the U.S.
As of June 30, 2022, the company had over 850 solar projects in 27 states with an aggregate capacity of operating or under construction of 2.3 gigawatts and 270 megawatts of battery storage projects.
Management is headed by president and CEO Jon Yoder, who has been with the firm since August 2022 and was previously Managing Director and Head of the Renewable Power Group at Goldman Sachs Asset Management.
The firm has more than 200 enterprise customers who utilize the firm’s energy as part of their decarbonization efforts.
As of June 30, 2022, MN8 has booked fair market value equity investment of $1 billion as of June 30, 2022 from investors including The Regents of the University of California and Goldman Sachs Asset Management and affiliates.
MN8 – Customer Acquisition
The firm seeks to develop customer relationships with power users, whether from enterprises or public utilities.
The chart below shows the company’s current footprint and related metrics:
Company Facility Footprint (SEC EDGAR)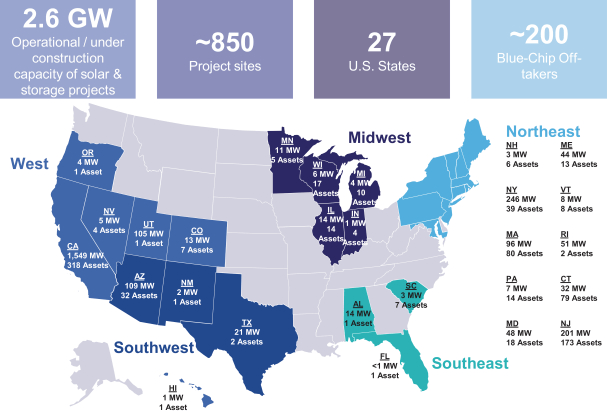
General and Administrative expenses as a percentage of total revenue have varied as revenues have increased, as the figures below indicate:
|
General and Administrative |
Expenses vs. Revenue |
|
Period |
Percentage |
|
Six Mos. Ended June 30, 2022 |
5.5% |
|
2021 |
14.1% |
|
2020 |
12.3% |
(Source – SEC)
The General and Administrative efficiency multiple, defined as how many dollars of additional new revenue are generated by each dollar of General and Administrative spend, rose to 3.3x in the most recent reporting period, as shown in the table below:
|
General and Administrative |
Efficiency Rate |
|
Period |
Multiple |
|
Six Mos. Ended June 30, 2022 |
3.3 |
|
2021 |
0.5 |
(Source – SEC)
MN8’s Market & Competition
According to a 2022 market research report by Precedence Research, the global market for solar power was an estimated $197 billion in 2021 and is forecast to reach $368 billion by 2030.
This represents a forecast CAGR of 7.2% from 2021 to 2030.
The main drivers for this expected growth are an increase in demand for renewable energy and government incentives for adoption of solar technologies.
Also, the chart below shows the historical and projected future growth trajectory of the global solar power market through 2030:
Global Solar Power Market Size (Precedence Research)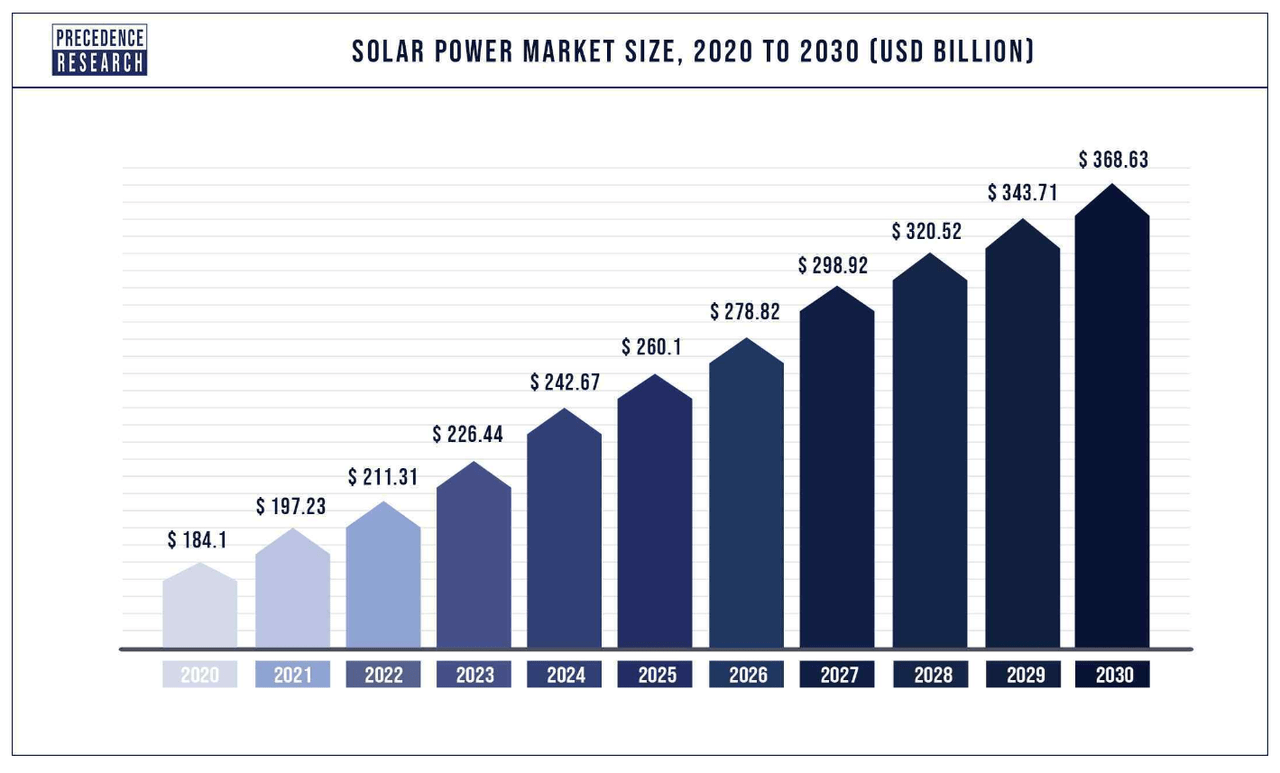
Major competitive or other industry participants include:
MN8 Energy Financial Performance
The company’s recent financial results can be summarized as follows:
-
Growing topline revenue
-
Variable gross profit and gross margin
-
Uneven operating income
-
Reduced cash flow from operations.
Below are relevant financial results derived from the firm’s registration statement:
|
Total Revenue |
||
|
Period |
Total Revenue |
% Variance vs. Prior |
|
Six Mos. Ended June 30, 2022 |
$ 178,310,000 |
22.1% |
|
2021 |
$ 294,441,000 |
8.0% |
|
2020 |
$ 272,684,000 |
|
|
Operating Profit (Loss) |
||
|
Period |
Operating Profit (Loss) |
Operating Margin |
|
Six Mos. Ended June 30, 2022 |
$ 52,296,000 |
29.3% |
|
2021 |
$ 66,204,000 |
22.5% |
|
2020 |
$ 81,909,000 |
30.0% |
|
Net Income (Loss) |
||
|
Period |
Net Income (Loss) |
Net Margin |
|
Six Mos. Ended June 30, 2022 |
$ 51,169,000 |
28.7% |
|
2021 |
$ 174,636,000 |
97.9% |
|
2020 |
$ 18,240,000 |
10.2% |
|
Cash Flow From Operations |
||
|
Period |
Cash Flow From Operations |
|
|
Six Mos. Ended June 30, 2022 |
$ 56,618,000 |
|
|
2021 |
$ 125,760,000 |
|
|
2020 |
$ 140,763,000 |
|
As of June 30, 2022, MN8 had $242.3 million in cash and $3.2 billion in total liabilities.
Free cash flow during the twelve months ended June 30, 2022, was negative ($902.2 million).
MN8 Energy IPO Details
MN8 intends to raise $100 million in gross proceeds from an IPO of its common stock, although the final figure may be higher.
No existing shareholders have indicated an interest to purchase shares at the IPO price.
Management says it will use the net proceeds from the IPO as follows:
We intend to use the net proceeds from this offering to fund approximately $175.0 million to $225.0 million of development and construction activities on our renewables, battery storage and EV charging pipeline projects through the end of 2025. We intend to use any remaining net proceeds for general corporate purposes, which may include opportunistically funding solar, battery storage, energy acquisitions and other strategic opportunities.
Immediately after receipt of the net proceeds of this offering, management may use a certain amount to temporarily pay down the balance of the new Revolver—including amounts drawn thereunder to repay the Subscription Facility prior to this offering—to more efficiently manage the Company’s liquidity and minimize interest expense.
(Source – SEC)
Management’s presentation of the company roadshow is not available.
Regarding outstanding legal proceedings, management said it is not aware of any legal proceedings that would have a material adverse effect on its financial condition or operations.
The listed bookrunners of the IPO are Goldman Sachs, BofA Securities, J.P. Morgan and other investment banks.
Commentary About MN8’s IPO
MN8 Energy, Inc. is seeking public capital market investment for new project development and to pay down debt.
The company’s financials have shown increasing topline revenue, fluctuating gross profit and gross margin, variable operating but lowered cash flow from operations.
Free cash flow for the twelve months ended June 30, 2022, was negative ($902.2 million).
General and Administrative expenses as a percentage of total revenue have varied as revenue has increased; its General and Administrative efficiency multiple has risen 3.3x in its most recent reporting period.
The firm currently plans to pay no dividends to holders of its common stock.
MN8’s trailing twelve-month CapEx Ratio was 0.14x, which indicates it has spent heavily on capital expenditures as a percentage of its operating cash flow.
The market opportunity for solar energy is large and expected to grow substantially over the coming years as companies and individuals seek to reduce their reliance on carbon producing fuels.
Goldman Sachs is the lead underwriter. IPOs led by the firm over the last 12-month period have generated an average return of negative (41.3%) since their IPO. This is a lower-tier performance for all major underwriters during the period.
The primary risk to the company’s outlook is the recent rise in the cost of capital, which has significant implications for its heavily capital-dependent approach.
When we learn more about management’s pricing and valuation assumptions for the IPO, I’ll provide an update.
Expected IPO Pricing Date: To be announced.
Be the first to comment