

White gas and oil pipeline on lush grassy background. Petmal/iStock via Getty Images
Introduction
In December last year, I analyzed a mid-stream O&G ETF, AMZA (NYSEARCA:AMZA), with a bullish, alpha-generating outlook. Since then, 5.04% alpha vs the S&P 500 (SPY) (SPX) has been made on that pick. Now, I update my analysis of this sector and arrive at a more neutral view due to lower O&G demand for Europe and continued broad-based slowdown in global manufacturing PMIs.
The focal point of my analysis would be another mid-stream O&G ETF, Global X MLP & Energy Infrastructure ETF (NYSEARCA:MLPX). However, based on the sector-specific analysis, I derive the same neutral/hold positioning conclusions for both AMZA and MLPX.
MLPX ETF Exposure Mix
Top 5 Holdings Mix
MPLX ETF Top 5 Holdings (MLPX ETF Website, Author’s Analysis)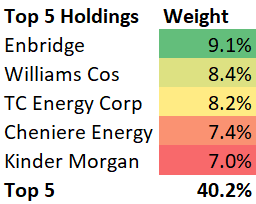
MPLX’s top 5 holdings include Enbridge (ENB), Williams Cos (WMB), TC Energy Corp (TRP), Cheniere Energy (LNG) and Kinder Morgan (KMI).
MLPX has a much broader portfolio than AMZA, whose top 5 holdings make up 74.3% of overall assets. Moreover, MLPX has more distributed weight as well across its holdings. This makes MLPX a better fit for betting on the underlying MLPs theme rather than taking on inordinate amounts of security-specific risks on stocks such as Energy Transfer (ET), for which I have done a separate analysis.
Why I am neutral on mid-stream O&G
I have a neutral stance on mid-stream O&G, including the MLPX and AMZA ETFs for 3 key reasons:
- A warmer EU winter implies lower volume demand
- Slowing economic activity to curb top-line growth
- A low-growth economic outlook is another headwind
A warmer EU winter implies lower volume demand
The war between Russia and Ukraine continues. Last year, a key theme of concern was how Europe would fare during winter as Russia restricted energy supplies to a highly dependent Europe. However, Europe has been experiencing a much warmer winter this time around, with temperatures up to 68 Fahrenheit (20 degrees Celsius) above normal levels. The impact of this stark contrast can be seen in pictures of European ski resorts now compared to in prior winters.
This is reducing Europe’s energy demand as its gas storage buffers still stand high at above 80%. The healthy demand environment and curtailments in demand has led to the transfer price of European gas to fall 83.1% from its all-time high of EUR 319.98/MWh to EUR 54.18/MWh.
Ultimately, this reduces volume demand for MLPX constituents, dragging down the top-line results.
Slowing economic activity to curb top-line growth
The world’s largest economies are seeing a contraction in their manufacturing PMIs. As O&G is a core requirement to virtually all manufacturing operations, this spells a subdued demand outlook for O&G volumes:
US
US ISM Manufacturing PMI (Trading Economics, Author’s Analysis)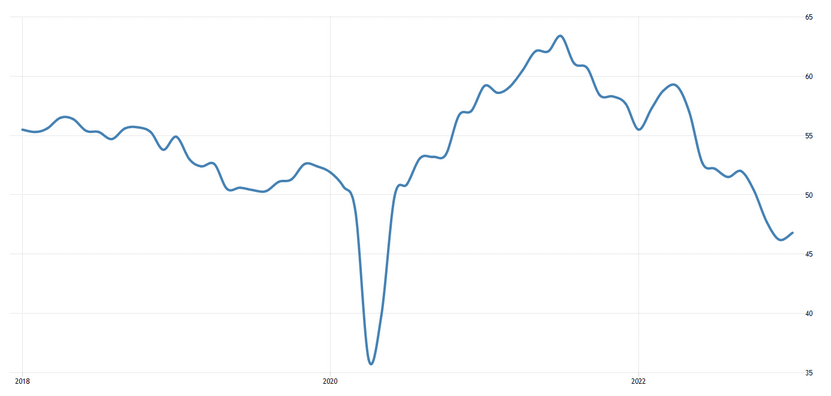
The US makes up 23.9% of the global economy. Its last December 2022 PMI reading is 46.8. As this is below 50, it indicates contracting manufacturing activities.
China
China Manufacturing PMI (Trading Economics, Author’s Analysis)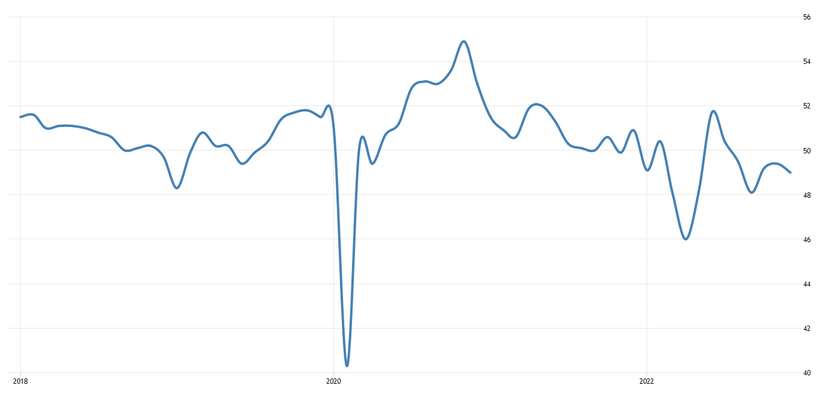
China, as the second-largest economy in the world, makes up 18.5% of the global economy. Its December 2022 PMI was also below 50 at 48, signalling contracting activities.
Japan
Japan Manufacturing PMI (Trading Economics, Author’s Analysis)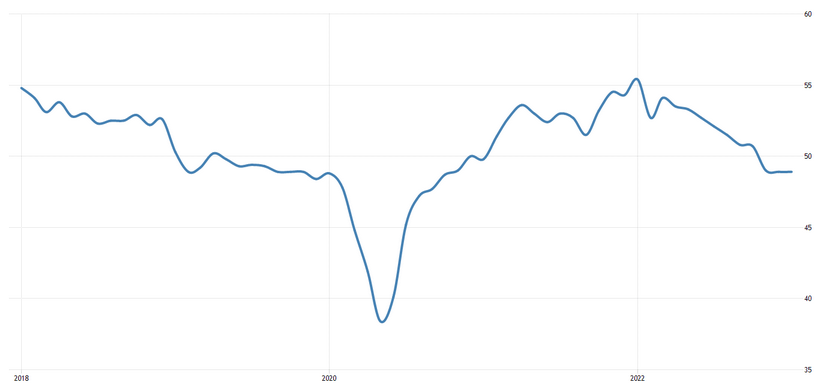
Japan is the third largest economy in the world making up 5.1% of the global economy. Its January 2023 manufacturing PMI reading is below 50 at 48.9, indicating contraction here as well.
A low-growth economic outlook is another headwind
The World Bank’s projections for global economic growth in 2023 are grim with an estimated growth rate of 1.7%. Consequently, this economic slowdown will have a ripple effect on energy demands for 2023. A decrease in consumer spending and production levels will result in reduced volume demand for O&G.
Takeaway
All in all, the combination of near-term momentum indicators such as the manufacturing PMIs (which I would weigh more) and dampened global economic growth forecasts lead to subdued prospects for mid-stream O&G’s top-line growth. I believe these near-term headwinds imply some correction for the MLPX ETF ahead.
Technical Analysis
If this is your first time reading a Hunting Alpha article using technical analysis, you may want to read this post, which explains how and why I read the charts the way I do, utilizing the principles of Flow, Location, and Trap.
I have already analyzed AMZA from a technical analysis perspective in my last article on it. This section will focus on MLPX:
Relative Read of MPLX vs S&P 500
MLPX vs SPX500 Technical Analysis (TradingView, Author’s Analysis)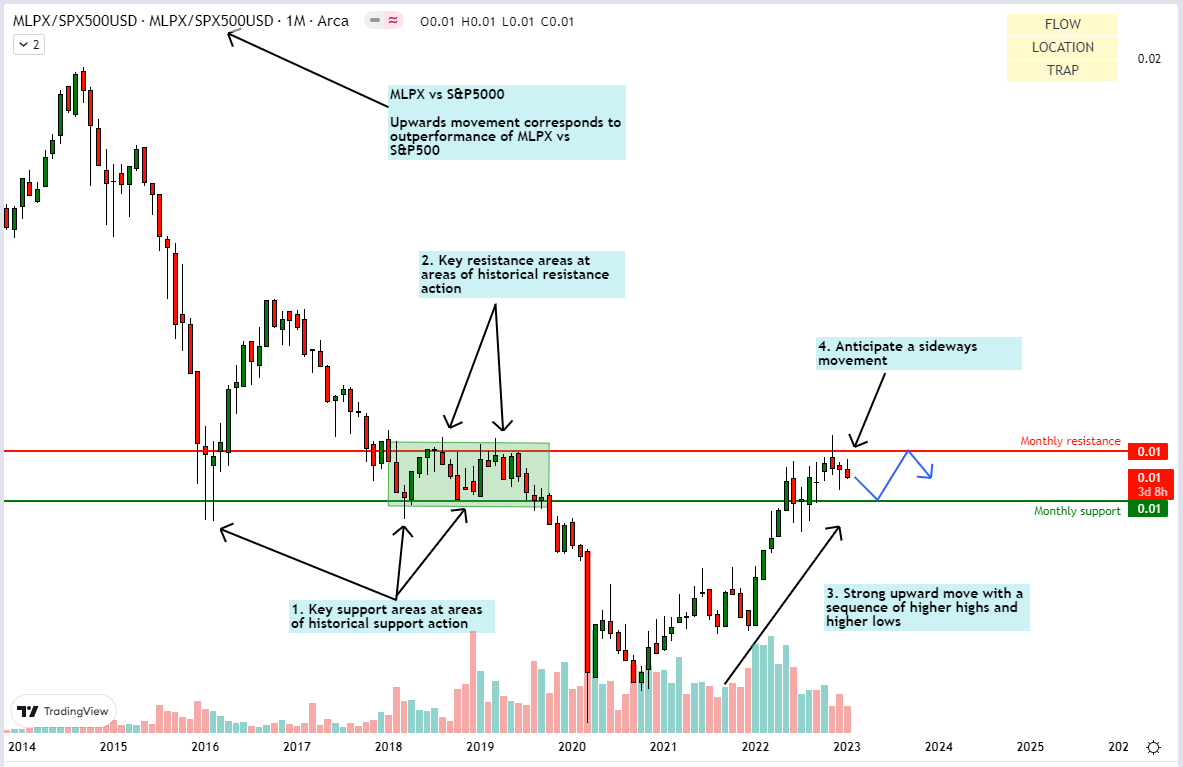
The relative chart of MLPX vs the S&P 500 (SPY) (SPX) shows the ratio price retracing to the downside at the historical monthly resistance, suggesting underperformance is ahead. I believe it will continue trading between the monthly resistance and monthly support range over the months and quarters ahead.
Standalone Read of MPLX
MLPX vs SPX500 Technical Analysis (TradingView, Author’s Analysis)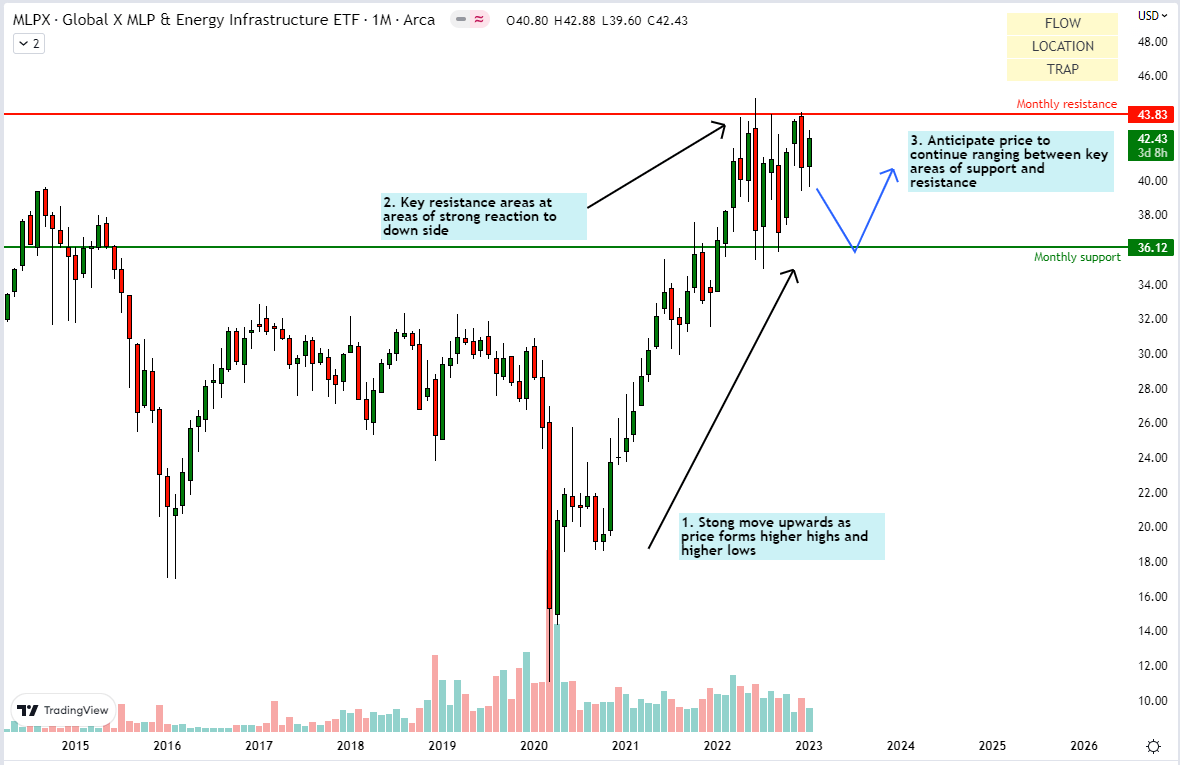
As seen in the chart above, MLPX reached a local high of $43.83 at the beginning of 2022. Currently, fundamentals driver are pointing to a sluggish demand for oil and gas. I anticipate MLPX ETF to continue to range between the key resistance and support areas. There are no false breakout traps on either side to justify taking a directional position.
Summary
My previous analysis of the mid-stream O&G sector via AMZA concluded with a bullish view. Since then, 5.04% of alpha has been made in just 1 month. Now, an updated analysis of EU’s O&G needs and the slowing global economy makes me incrementally less confident on the alpha vs S&P 500 potential of the mid-stream O&G sector over the medium term. Long term, I am still cautiously bullish as I believe the global energy deficit will lead to eventual capacity expansion. Thus, I rate both AMZA and MLPX a ‘hold’. Personally, I do not hold AMZA now due to lower confidence in its alpha potential over the next few months and quarters.
Editor’s Note: This article discusses one or more securities that do not trade on a major U.S. exchange. Please be aware of the risks associated with these stocks.
Be the first to comment