

benkrut/iStock via Getty Images
Economic factors will likely play a pivotal role in supporting Mid Penn Bancorp’s (NASDAQ:MPB) loan growth this year, which will, in turn, boost the bottom line. Further, margin expansion will help the earnings for this year. Overall, I’m expecting Mid Penn Bancorp to report earnings of $2.77 per share in 2022, up 2% year-over-year. Compared to my last report on Mid Penn Bancorp, I have revised downwards my earnings estimate for 2022 mostly because loan growth missed my expectations in the last quarter of 2021. The year-end target price suggests a high upside from the current market price. Therefore, I’m maintaining a buy rating on Mid Penn Bancorp.
Economic Factors to Buoy the Loan Portfolio
Mid Penn Bancorp acquired $811 million worth of loans from Riverview Financial Corporation in the last quarter of 2021. However, the total loan portfolio increased by only $734 million during the last quarter, which means that the legacy Mid Penn Bancorp portfolio declined by $77 million, or 3.3% during the quarter. When taken in conjunction with the sharp loan decline in the second and third quarters of last year, the loan trend becomes somewhat worrisome.
Mid Penn Bancorp still has a large Paycheck Protection Program (“PPP”) loan portfolio whose forgiveness in the coming months will have a material impact on the total loan portfolio size. According to details given in the earnings release, PPP loans outstanding totaled $111.3 million at the end of December 2021, representing 3.6% of total loans. As the remaining PPP portfolio makes up a sizable chunk of total loans, I’m expecting the forgiveness to drag the total loan portfolio’s growth this year.
On the other hand, economic factors will likely support the portfolio. Commercial and industrial loans (“C&I”) and commercial real estate (“CRE”) loans make up a majority of total loans. These two loan segments made up 85.7% of total loans at the end of December 2021. Therefore, the purchasing managers’ index (“PMI”) is a good indicator of future credit demand. As shown below, the PMI index has remained in the expansionary territory (above 50) in the recent past.
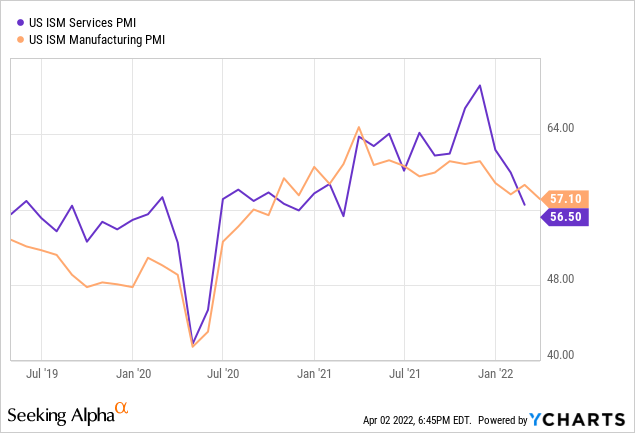
Further, Mid Penn Bancorp is based in Pennsylvania whose economic growth has been quite strong. The state reported a GDP growth of 6.4% in the last quarter of 2021, which is close to the national average of 6.9%, according to official sources.
Overall, I’m expecting the loan portfolio to grow by 2.9% to $3,181 million by the end of December 2022. This is below the estimate of $3,548 million I gave in my last report on Mid Penn Bancorp. I have revised downwards the loan estimate because the increase in loans during the last quarter missed my expectations.
Due to the acquisition of Riverview Financial Corporation in the fourth quarter of 2021, the average loan balance in 2022 will be much higher than last year. The anticipated 2.9% loan growth in 2022 will result in the loan balance for this year being 19% higher than last year’s loan balance. Meanwhile, I’m expecting deposits to outpace loan growth. The following table shows my balance sheet estimates.
| FY18 | FY19 | FY20 | FY21 | FY22E | |
| Financial Position | |||||
| Net Loans | 1,616 | 1,753 | 2,371 | 3,090 | 3,181 |
| Growth of Net Loans | 79.0% | 8.5% | 35.2% | 30.3% | 2.9% |
| Securities | 304 | 294 | 433 | 1,277 | 1,423 |
| Deposits | 1,726 | 1,912 | 2,475 | 4,002 | 4,332 |
| Borrowings and Sub-Debt | 118 | 60 | 257 | 167 | 148 |
| Common equity | 223 | 238 | 256 | 490 | 522 |
| Book Value Per Share ($) | 31.5 | 28.1 | 30.3 | 30.7 | 32.7 |
| Tangible BVPS ($) | 21.6 | 20.0 | 22.3 | 23.0 | 25.0 |
|
Source: SEC Filings, Author’s Estimates (In USD million unless otherwise specified) |
Top Line Appears Highly Sensitive to Rate Changes
Thanks to the C&I-heavy loan portfolio, the net interest income is quite sensitive to rate changes. According to the management’s interest-rate sensitivity analysis given in the 10-K filing, a 200-basis points increase in interest rates can boost the net interest income by 13.7% over twelve months. The results of the analysis are shown below.
2021 10-K Filing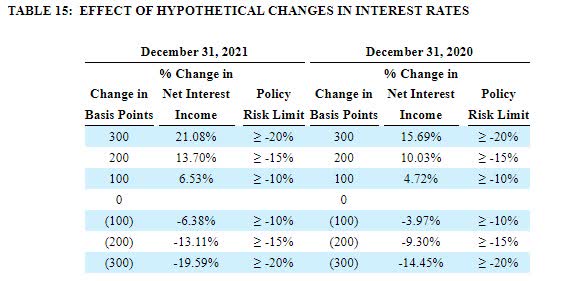
The analysis above does not assume significant balance sheet repositioning (refer to page 56 of the latest 10-K filing for the model assumptions). Mid Penn Bancorp has the opportunity to improve its balance sheet positioning this year. The company has built up a large cash position on its books last year. Cash and cash equivalents surged to $913.8 million at the end of December 2021 from $303.7 million at the end of December 2020 and $139 million at the end of December 2019. The excess cash gives Mid Penn Bancorp the flexibility to improve its asset mix as interest rates rise.
Considering these factors, I’m expecting the net interest margin to increase by twelve basis points in 2022. In my previous report on Mid Penn Bancorp, I had expected a smaller expansion in the margin. Since the release of my last report, the Federal Reserve has increased the magnitude of the projected interest rate hikes this year. Therefore, I have revised upwards my margin estimate for 2022.
Provision Expense to be at the Higher End of the Historical Trend
Allowances for loan losses were high enough to cover the portfolio’s credit risk at the end of December 2021. Allowances made up 0.47% of total loans, while non-performing loans made up 0.32% of total loans at the end of December 2021, as mentioned in the 10-K filing.
However, the current allowance level is much lower than the historical five-year average allowance of 0.58% of total loans. Therefore, the provisioning this year will most probably remain at the higher end of the historical trend. Overall, I’m expecting the provision expense to make up 0.08% of total loans in 2022. In comparison, the provision-expense-to-total-loan ratio averaged 0.05% from 2017 to 2019 and 0.08% in the last five years.
Expecting Earnings to Grow by 2% Year-Over-Year
The higher average loan balance and margin expansion will likely drive topline growth, which will, in turn, boost the earnings per share this year. Further, the efficiency ratio will likely improve following the acquisition of Riverview Financial Corporation in the last quarter of 2021. The management has identified cost savings of around 50% of Riverview’s non-interest expenses, as mentioned in the merger presentation. As a result, I’m expecting the efficiency ratio to improve to 64% in 2022 from 70% in 2021 and 67% in 2020.
Overall, I’m expecting Mid Penn Bancorp to report earnings of $2.77 per share in 2022, up 2% year-over-year. The following table shows my income statement estimates.
| FY18 | FY19 | FY20 | FY21 | FY22E | |
| Financial Summary | |||||
| Net interest income | 56 | 70 | 88 | 109 | 139 |
| Provision for loan losses | 1 | 1 | 4 | 3 | 3 |
| Non-interest income | 7 | 13 | 18 | 22 | 23 |
| Non-interest expense | 50 | 60 | 71 | 91 | 104 |
| Net income – Common Sh. | 10 | 18 | 26 | 29 | 44 |
| EPS – Diluted ($) | 1.48 | 2.09 | 3.10 | 2.71 | 2.77 |
|
Source: SEC Filings, Author’s Estimates (In USD million unless otherwise specified) |
In my last report on Mid Penn Bancorp, I estimated earnings of $2.96 per share for 2022. The downward earnings revision is attributable to the negative surprise in loan growth for the fourth quarter of 2021. As a result, I’m now expecting a lower average loan balance for 2022, which results in lower earnings estimate for this year.
Actual earnings may differ materially from estimates because of the risks and uncertainties related to the COVID-19 pandemic and the timing and magnitude of interest rate hikes.
MPB Currently Trading at a Large Discount to the Year-End Target Price
Mid Penn Bancorp is offering a dividend yield of 3.0% at the current quarterly dividend rate of $0.20 per share. The earnings and dividend estimates suggest a payout ratio of 29% for 2022, which is close to the five-year average of 34%. Therefore, I’m not expecting an increase in the dividend level.
I’m using the historical price-to-tangible book (“P/TB”) and price-to-earnings (“P/E”) multiples to value Mid Penn Bancorp. The stock has traded at an average P/TB ratio of 1.20 in the past, as shown below.
| FY18 | FY19 | FY20 | FY21 | Average | ||
| T. Book Value per Share ($) | 21.6 | 20.0 | 22.3 | 23.0 | ||
| Average Market Price ($) | 31.3 | 25.0 | 20.8 | 27.1 | ||
| Historical P/TB | 1.45x | 1.25x | 0.93x | 1.18x | 1.20x | |
| Source: Company Financials, Yahoo Finance, Author’s Estimates | ||||||
Multiplying the average P/TB multiple with the forecast tangible book value per share of $25.0 gives a target price of $30.0 for the end of 2022. This price target implies a 13.4% upside from the April 1 closing price. The following table shows the sensitivity of the target price to the P/TB ratio.
| P/TB Multiple | 1.00x | 1.10x | 1.20x | 1.30x | 1.40x |
| TBVPS – Dec 2022 ($) | 25.0 | 25.0 | 25.0 | 25.0 | 25.0 |
| Target Price | 25.0 | 27.5 | 30.0 | 32.5 | 35.0 |
| Market Price | 26.5 | 26.5 | 26.5 | 26.5 | 26.5 |
| Upside/(Downside) | (5.5)% | 4.0% | 13.4% | 22.8% | 32.2% |
| Source: Author’s Estimates |
The stock has traded at an average P/E ratio of around 12.5x in the past, as shown below.
| FY18 | FY19 | FY20 | FY21 | Average | ||
| Earnings per Share ($) | 1.48 | 2.09 | 3.10 | 2.71 | ||
| Average Market Price ($) | 31.3 | 25.0 | 20.8 | 27.1 | ||
| Historical P/E | 21.2x | 12.0x | 6.7x | 10.0x | 12.5x | |
| Source: Company Financials, Yahoo Finance, Author’s Estimates | ||||||
Multiplying the average P/E multiple with the forecast earnings per share of $2.77 gives a target price of $34.5 for the end of 2022. This price target implies a 30.4% upside from the April 1 closing price. The following table shows the sensitivity of the target price to the P/E ratio.
| P/E Multiple | 10.5x | 11.5x | 12.5x | 13.5x | 14.5x |
| EPS – 2022 ($) | 2.77 | 2.77 | 2.77 | 2.77 | 2.77 |
| Target Price | 29.0 | 31.8 | 34.5 | 37.3 | 40.1 |
| Market Price | 26.5 | 26.5 | 26.5 | 26.5 | 26.5 |
| Upside/(Downside) | 9.5% | 19.9% | 30.4% | 40.9% | 51.3% |
| Source: Author’s Estimates |
Equally weighting the target prices from the two valuation methods gives a combined target price of $32.3, which implies a 21.9% upside from the current market price. Adding the forward dividend yield gives a total expected return of 24.9%. Hence, I’m maintaining a buy rating on Mid Penn Bancorp.
Be the first to comment