Stephen Brashear
Introduction: Why is MSFT Stock Down?
Microsoft Corporation (NASDAQ:MSFT) stock lost 7.7% last Wednesday (October 26) following Q1 FY23 results and has not recovered, which means the share price is down 31% year-to-date:
|
MSFT Share Price (Last 1 Year)  Source: Google Finance (31-Oct-22). |
Microsoft has been a core holding for us since 2014, and we initiated our Buy rating on Seeking Alpha in December 2020. After the recent correction, MSFT stock’s gain since our initiation stands at just 7% (including dividends).
We believe MSFT stock is highly attractive and that investors have misinterpreted Q1 FY23 results. EPS grew just 3% in Q1, but this was largely due to currency. At constant currency, revenue, EBIT and EPS all grew by double-digits, and management expects the same for the full year, though with EBIT helped by an accounting change. Macro is weaker and this impacted some areas like Windows OEM revenues, but Cloud and other recurring revenue lines are still growing strong. Cost growth was higher than revenue growth in Q3, but is expected to “moderate materially through the year”.
MSFT stock is at 25.0x FY22 EPS and has a 3.1% Free Cash Flow Yield. Our forecasts indicate a total return of 110% (22.9% annualized) by June 2026. Buy.
Microsoft Buy Case Recap
Our Buy case on Microsoft is based on a combination of trends together driving a sustained low-teens EPS CAGR across multiple years:
- Technology spend as a percentage of GDP is expected to double in the next decade, driven by various structural trends, particularly digitalization.
- MSFT revenues will grow faster than Technology spend, as its many competitive advantages will help it to continue gaining market share.
- Earnings will grow faster than revenues, as costs on incremental revenues are low, giving MSFT natural operational leverage.
- Management will continue to return capital to shareholders in dividends (an approx. 1% yield) and buybacks (adding 1% to EPS growth each year).
Under current CEO Satya Nadella’s leadership, Microsoft has consistently delivered double-digit revenue growth, EBIT margin expansion and high-teens or higher EPS growth since FY18. FY21 growth was even higher with the boost from COVID-related demand, and FY22 delivered a further year of mid-teens plus growth on this higher earnings base:
|
MSFT Revenue & Earnings Growth (FY15-22) 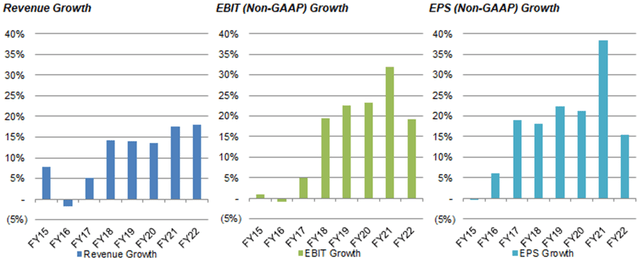 Source: MSFT company filings. |
We had assumed a 37.5x P/E for the end of our forecast period. This previously represented a de-rating but, with the recent correction in Technology stocks including MSFT, now implies a significant re-rating upwards.
Q1 FY23 results showed that double-digit growth is continuing on an underlying basis, though actual growth may be temporarily lower due to a number of short-term headwinds.
Microsoft Q1 FY23 Results Headlines
In Q1 FY23 (ending September 30), on a non-GAAP, constant-currency basis, revenues grew 16% and EBIT grew 15%; Net Income grew less, by 10%, due to a higher tax rate, and EPS grew 11% with an 1.1% lower share count:
|
MSFT P&L (Non-GAAP) (Q1 FY23 vs. Prior Periods) 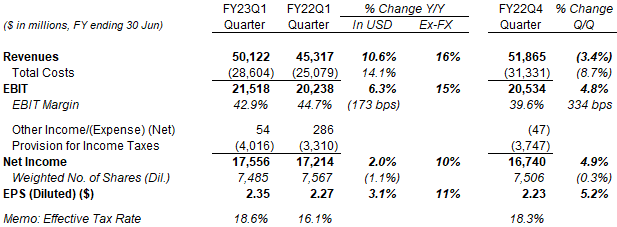 Source: MSFT company filings. |
The strong U.S. dollar was a 5 ppt headwind to revenues but only reduced costs by 3 ppt. Including currency, growth was 10.6% for revenues and 6.3% for EBIT. EPS grew just 3.1%, compared to 25.1% in the prior-year quarter.
Gross margin fell slightly, helped by an increase in the accounting estimates of the useful lives of server and network equipment, from 4 years to 6 years, following a similar increase at the start of FY21. Excluding this, Gross Margin fell roughly 3 ppt, driven by a mix shift to cloud revenues, higher energy costs impacting Azure margins, and the acquisition of Nuance in March 2022.
EBIT margin fell 1.7ppt year-on-year to 42.9%. Excluding the change in accounting estimates, EBIT margin likely shrunk by nearly 5 ppt, with 3 ppt due to the Gross Margin decline and the remainder due to Operating Expenses rising faster than revenues (15% reported and 18% in constancy currency, after headcount rose 22% year-on-year, including 6 ppt from the Nuance and Xandr acquisitions). This means underlying EBIT probably grew by about 5% year-on-year.
Management outlook is for a weaker Q2 but with revenues and EBIT still growing double-digits for the full-year FY23.
Microsoft Q2 & Full-Year FY23 Outlook
Management’s new outlook for Q2 FY23 implies, at mid-point, year-on-year revenue growth of just 2.2%. Cost of Revenue and Operating Expenses are both expected to grow faster, which means EBIT is expected to shrink 5.6% year-on-year (with margin down roughly 3 ppt) and Net Income is expected to shrink 9.5% year-on-year:
|
MSFT P&L Outlook vs. Prior Periods (Q1 FY23) 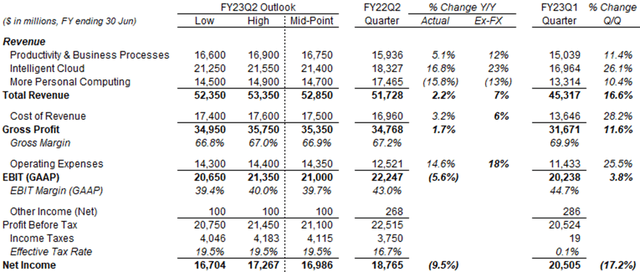 Source: MSFT company filings. |
Part of the weakness is again due to currency headwinds. At constant currency, the mid-point of the outlook implies year-on-year growth of 7% in revenue, though Cost of Revenue and Operating Expenses will again grow faster. Higher energy costs are expected to a $250m headwind in Q2 (and in Q3 and Q4, to total $800m+ in FY23).
Operating Expenses growth is expected to “moderate materially through the year”, and full-year EBIT margin decline is expected to be just 1 ppt (again hurt by currency but helped by the changing in accounting estimates). Management has started slowing cost growth, with sequential headcount growth expected to be “minimal” in Q2, and CFO Amy Hood indicated on the call that there will be “a material decline” in OpEx growth:
“We’re going to, frankly, lap some investments that we’ve made at the end of H2 … We closed Nuance at the end of Q3. We closed Xander in Q4. When we come and lap those, you will see a material decline in OpEx investment. You will also see us start to lap some of the headcount surges that we made last year in key areas”
Ultimately, she expects FY23 to be another year of double-digit revenue and EBIT growth (excluding currency):
“At the total company level, we continue to expect double-digit revenue and operating income growth on a constant currency basis. Revenue will be driven by around 20 percent constant currency growth in our commercial business … partially offset by the increased declines we now see in the PC market.”
We believe these expectations are realistic and supported by datapoints from Q1 FY23 results.
Strong Commercial to Offset Weak Consumer
Q1 FY23 results showed how strength in Microsoft’s recurring revenue lines, especially those in its Commercial businesses, will help offset macro-related weakness in some of its Consumer businesses.
Excluding currency, Productivity & Business Processes and Intelligent Cloud both grew revenues and EBIT by double-digits year-on-year during the quarter, but More Personal Computing revenues grew just 3%:
|
MSFT Revenue & EBIT By Segment (Q1 FY23 vs. Prior Periods) 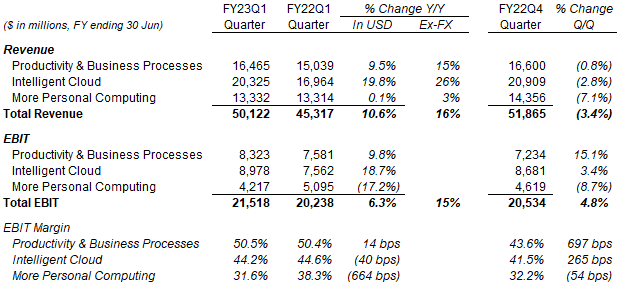 Source: MSFT company filings. NB. No difference in GAAP and non-GAAP figures for the periods above. |
In U.S. dollars, More Personal Computing revenues were flattish from a year ago, though the segment has always been volatile and Q1 typically dipped in each fiscal year; the other two segments show much more steady growth:
|
MSFT Revenue By Segment By Quarter (Since Q4 FY19) 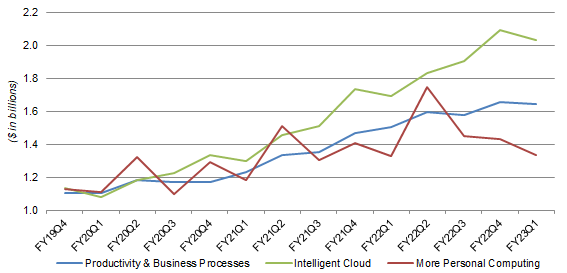 Source: MSFT company filings. |
Weakness in More Personal Computing revenues was largely due to weak PC sales, which meant Windows OEM revenues fell by 15% year-on-year (20% excluding the Windows 11 deferral last year); Device revenue growth also decelerated to 2% (8% excluding currency); however, revenue growth remained double-digits in Windows Commercial and Search & News Advertising:
|
MSFT More Personal Computing KPIs (Last 5 Quarters)  Source MSFT results presentation (Q1 FY23). |
Management’s Q2 FY23 outlook sees Windows OEM revenue decline by a high-30s percentage figure (or mid-30s excluding the Windows 11 deferral last year).
In Productivity & Business Processes, excluding currency, there was again double-digit year-on-year revenue growth in businesses including Office Commercial and Office Consumer, Dynamics and LinkedIn, and the growth rates were either mostly in line or only slightly lower than in Q4 FY22 (except in LinkedIn, whose revenues are partly ad-related):
|
MSFT Productivity & Business Processes KPIs (Last 5 Quarters)  Source MSFT results presentation (Q1 FY23). |
Both the number of seats for Office 365 in Commercial and the number of subscribers for Microsoft 365 in Consumer showed low-teens year-on-year growth in Q1 FY23; both represented more normalized growth after the COVID-boosted levels in FY21-22, though the pandemic peak was more dramatic on the Consumer side:
|
MSFT Office Seat and Subscribers Growth Y/Y(Since FY19) 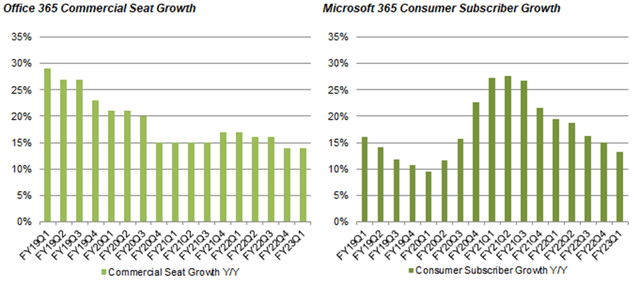 Source: MSFT company filings. |
In Intelligent Cloud, Azure revenues grew a strong 42% year-on-year in constant currency, but this still implied a second consecutive deceleration since the peak of 49% in Q3 FY22, which management attributed to “continued moderation in Azure consumption growth”, with Microsoft helping customers “optimize current workloads”:
|
MSFT Intelligent Cloud KPIs (Last 5 Quarters) 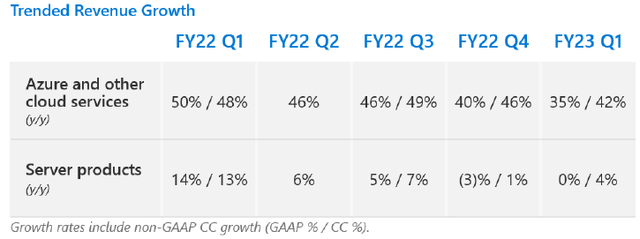 Source MSFT results presentation (Q1 FY23). |
Management’s Q2 FY23 outlook includes a further 5 ppt sequential decline in Azure’s constant-currency growth rate.
Overall, Q1 FY23 growth rates reflect a slight year-on-year weakening of demand in parts of Microsoft’s customer base. However, outside PC and advertising, the weakening was not significantly worse than the quarter before. For example, for SMBs, as CFO Amy Hood explained on the call:
“Specifically about the SMB market … we did see continued impact there in Q1, although it was not different than what we saw, frankly, in Q4. In Microsoft 365 … where we in fact saw … new deal moderation, I’d referred to that, frankly, in Q4 as well, it tended to be in … the smaller end of the market, small-to-midsize companies, and it also tended to be through [the] partner [channel]”
We are not making specific predictions about the economy for the next few quarters. However, in the event of a downturn, we expect revenues in most of Microsoft’s businesses to remain resilient. And we expect Microsoft’s strong long-term double-digit growth to resume quickly after any downturn.
Valuation: Is Microsoft Stock Undervalued?
At $232.13, on FY22 financials, MSFT shares are trading at a 25.0x P/E and a 3.1% Free Cash Flow (“FCF”) Yield; on CY21 financials, shares are at a 25.8x P/E and a 3.0% FCF Yield:
|
MSFT Earnings, Cash flows & Valuation (Since FY20) 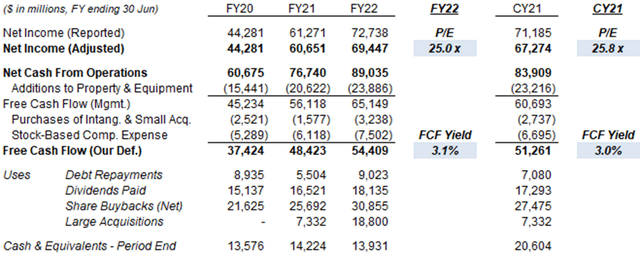 Source: MSFT company filings. NB. “Large acquisitions” excluded were Bethesda Networks ($8.1bn) in FY21 and Nuance ($18.8bn) in FY22. |
The dividend is $0.68 per share per quarter ($2.72 annualized) and represents a Dividend Yield of 0.9%. It has been raised 10% this September.
Microsoft repurchased $30.9bn of its shares in FY22, equivalent to 1.8% of its current market capitalization. A further $4.62bn was repurchased in Q1 FY23, and $36.1bn remains in the authorized buyback program.
Microsoft Stock Forecasts
For our forecasts, we extend our FY23 Net Income growth to reflect the stronger currency headwind and weaker macro, reduce our exit multiple assumption, and extend our forecast period by a year to FY26. We now assume:
- FY23 Net Income of 3.5% (was 11.0%)
- From FY24, Net Income of 11.0% (unchanged)
- Share count to fall by 1% each year (unchanged)
- Dividend growing with a 30% Payout Ratio (unchanged)
- P/E of 35.0x at FY26 year-end (was 37.5x)
Our new FY25 EPS forecast is $12.10, 7% lower than before ($12.98):
|
Illustrative MSFT Return Forecasts 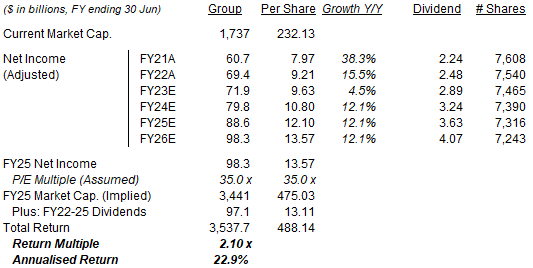 Source: Librarian Capital estimates. |
With shares at $232.13, we expect a total return of 110% (22.9% annualized) by June 2026, in just under 4 years.
Is Microsoft Stock a Buy? Conclusion
We reiterate our Buy rating on Microsoft Corporation stock.


Be the first to comment