

DNY59/iStock via Getty Images
The investment thesis
Chip stocks are notoriously cyclical as you can see from the chart below. All major chip stocks exhibit a sinewave growth and contraction behavior in the long term. You can also see that among the major chip stocks, Micron (NASDAQ:MU) has historically been the most cyclical stock, exhibiting the largest magnitude of gyrations. And Texas Instruments (NASDAQ:TXN) has historically been the least cyclical stock.
Source: Author based on Seeking Alpha data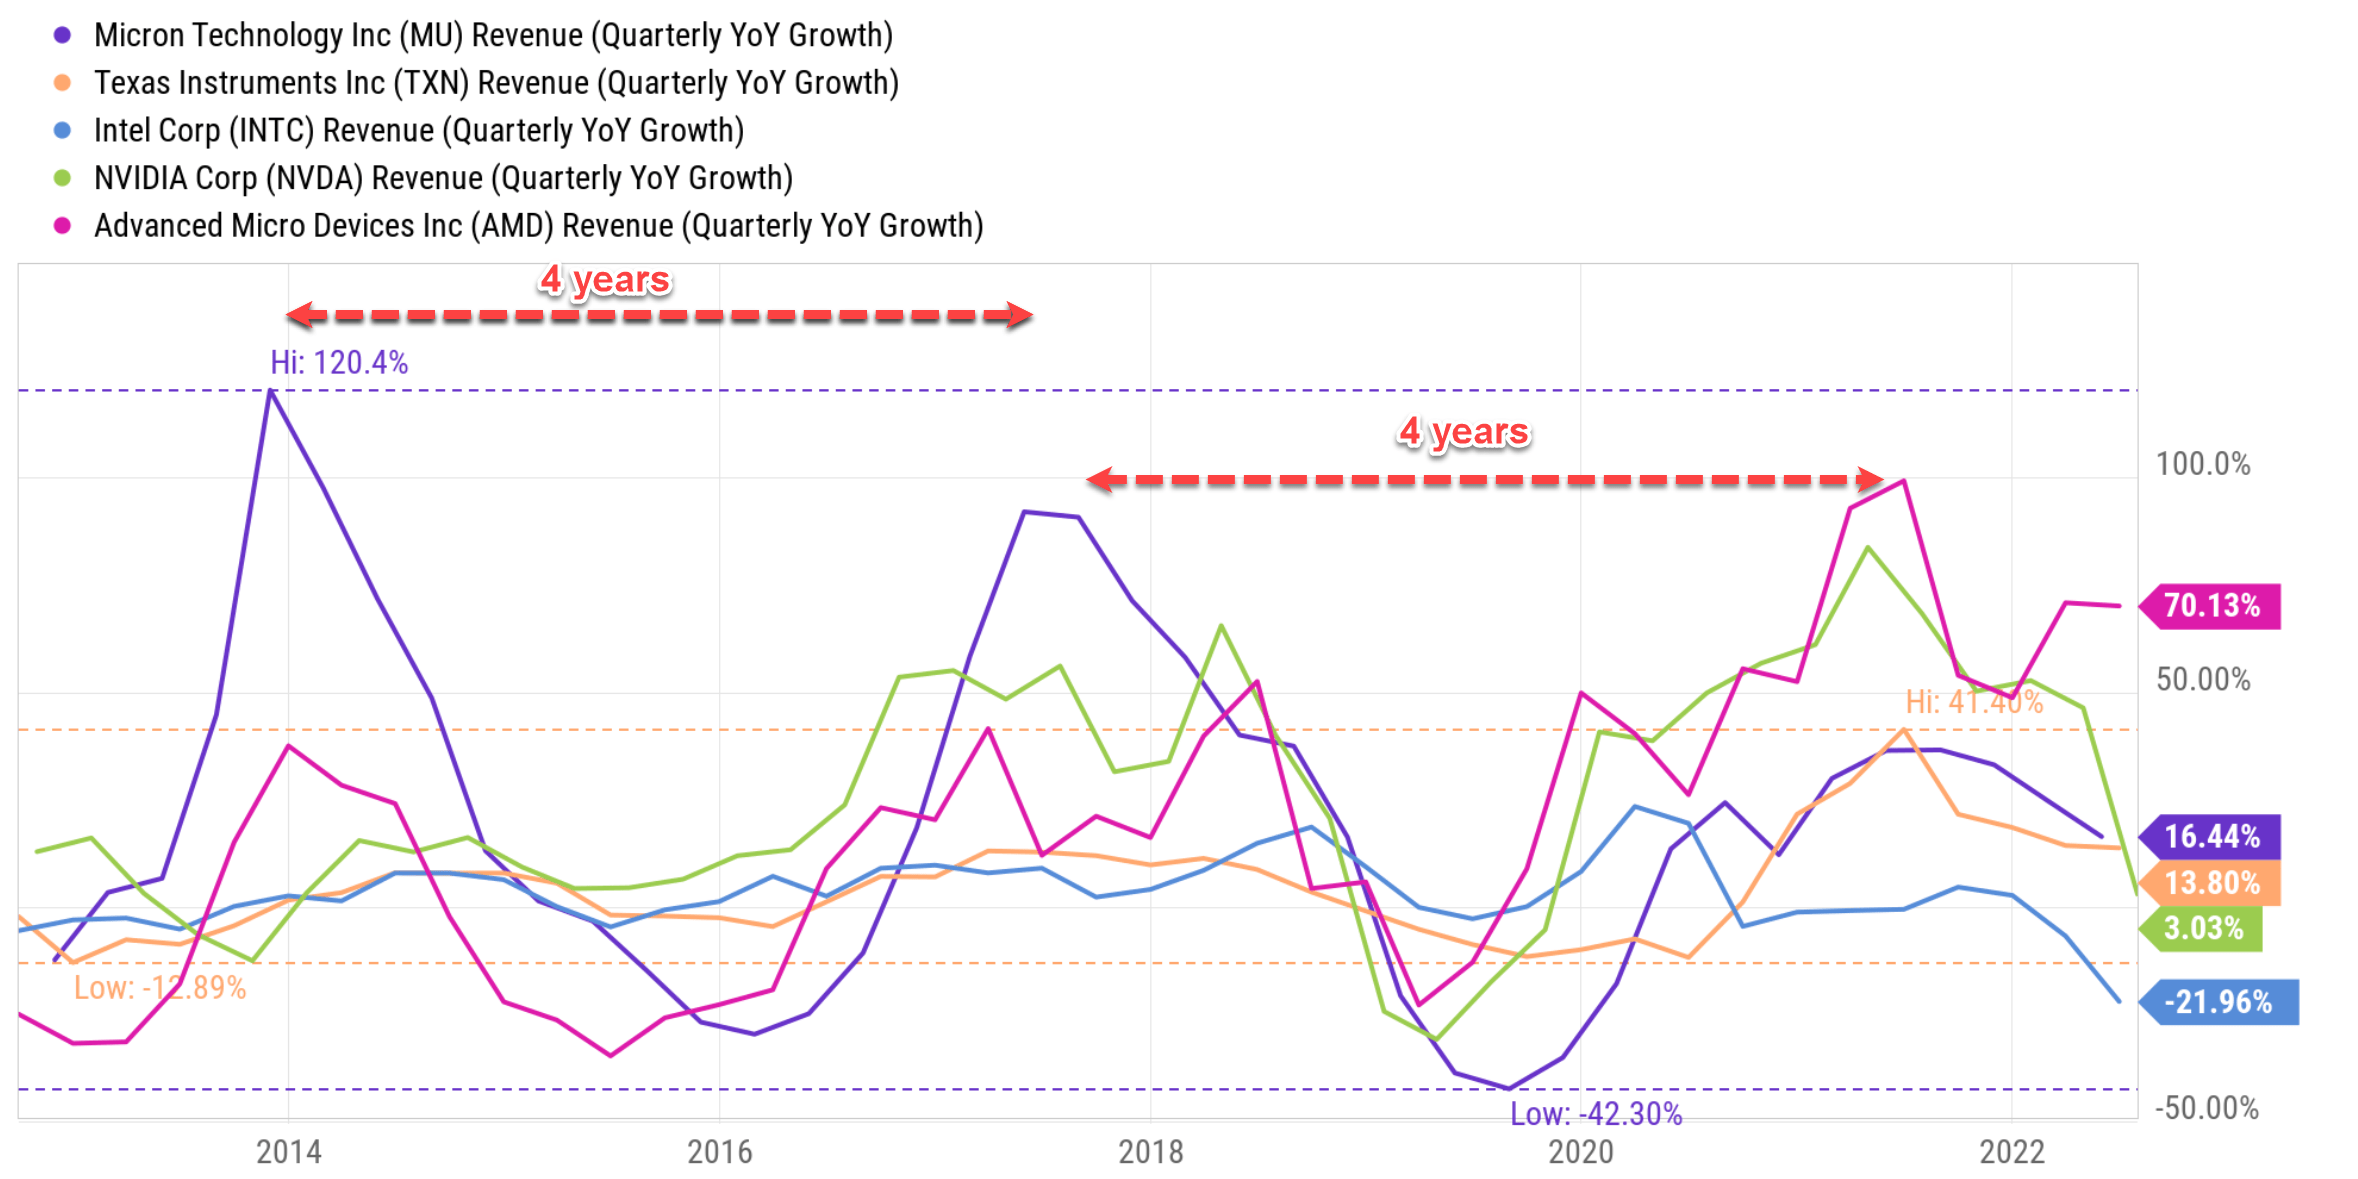
To wit, over the past decade, the chip stocks have gone through two full cycles with each cycle lasting about four years. The first cycle peaked around the end of 2013, bottomed in early 2015, peaked again around 2017, and then followed by the second cycle (2017 to 2021). In the past decade, MU, as the most cyclical one, has gone through an expansion phase with YoY growth as large as 120% and a contraction phase as bad as a 42% decline YoY. In contrast, TXN has regulated both the expansion and contraction to a much lesser degree. Its highest growth rate has been 41% YoY during the expansion phase, and its worst contraction has been only 12.9% YoY. Other major stocks like Intel (INTC), NVIDIA (NVDA), and Advanced Micro Devices (AMD) are somewhere in between.
The thesis of this article is twofold. First, it is to argue why I expect MU to continue being the most cyclical chip stock and TXN the least in this ongoing cycle also. And second, I will argue that being the most cyclical chip stock does not make MU the worst (or even a bad) investment. I actually see both of them as attractive opportunities under their current conditions. It is just investors need to pick the right one to suit their individual goals and risk tolerance.
MU vs TXN: revenues mix
The main reason why I believe MU to continue being the most cyclical one and TXN the least involves the diversification of their revenue sources. As you can see from the chart below, MU is among the least diversified in terms of revenue exposure. It derives more than 85.52% of its revenues from memory semiconductors and another 14.34% from data storage hardware (which adds up to more than 99.8% already). And both memory semiconductors and hardware happen to be among the most discretionary items in the semiconductor ecosystem.
In contrast, TXN has much better-diversified income streams. As seen, it derives the majority (76.59%) of its revenues from Analog and Mixed Signal Semiconductors, followed by Processor Semiconductors (16.62%), and then Specialized Semiconductors (6.79%). TXN is the leading supplier of digital signal processors and analog devices. In general, the need for analog devices is much less cyclical than for digital devices. For example, TXN markets its products for electrical controls, educational and productivity solutions, and metallurgical materials. It also derives a significant portion of its income in the form of royalties from licensing proprietary technology, adding further stability to the income.
Source: Merrill Edge
The 4-year cycle again
After understanding the differences in their revenue mixes and why that caused different cyclical behavior, let’s take a closer look at the 4-year cycle again. This time, I removed the lines for other stocks and only left the lines for MU and TXN. So the plot is much less cluttered and we can see the contrast more clearly.
From MU, we can clearly see the sine wave behavior of growth and decline, with a cyclicality of about 4 years from peak to peak (or bottom to bottom). The sinewave behavior is less visible for TXN, precisely because of its less cyclical revenue sources as described above. But if you look closely, the sinewave fluctuations are there, just with lower amplitudes. For example, you can clearly see TXN’s previous expansion cycle peaked in later 2017 and peaked again toward the end of 2021, resulting in a peak-to-peak duration of about ~4 years, just like MU.
Source: Author based on Seeking Alpha data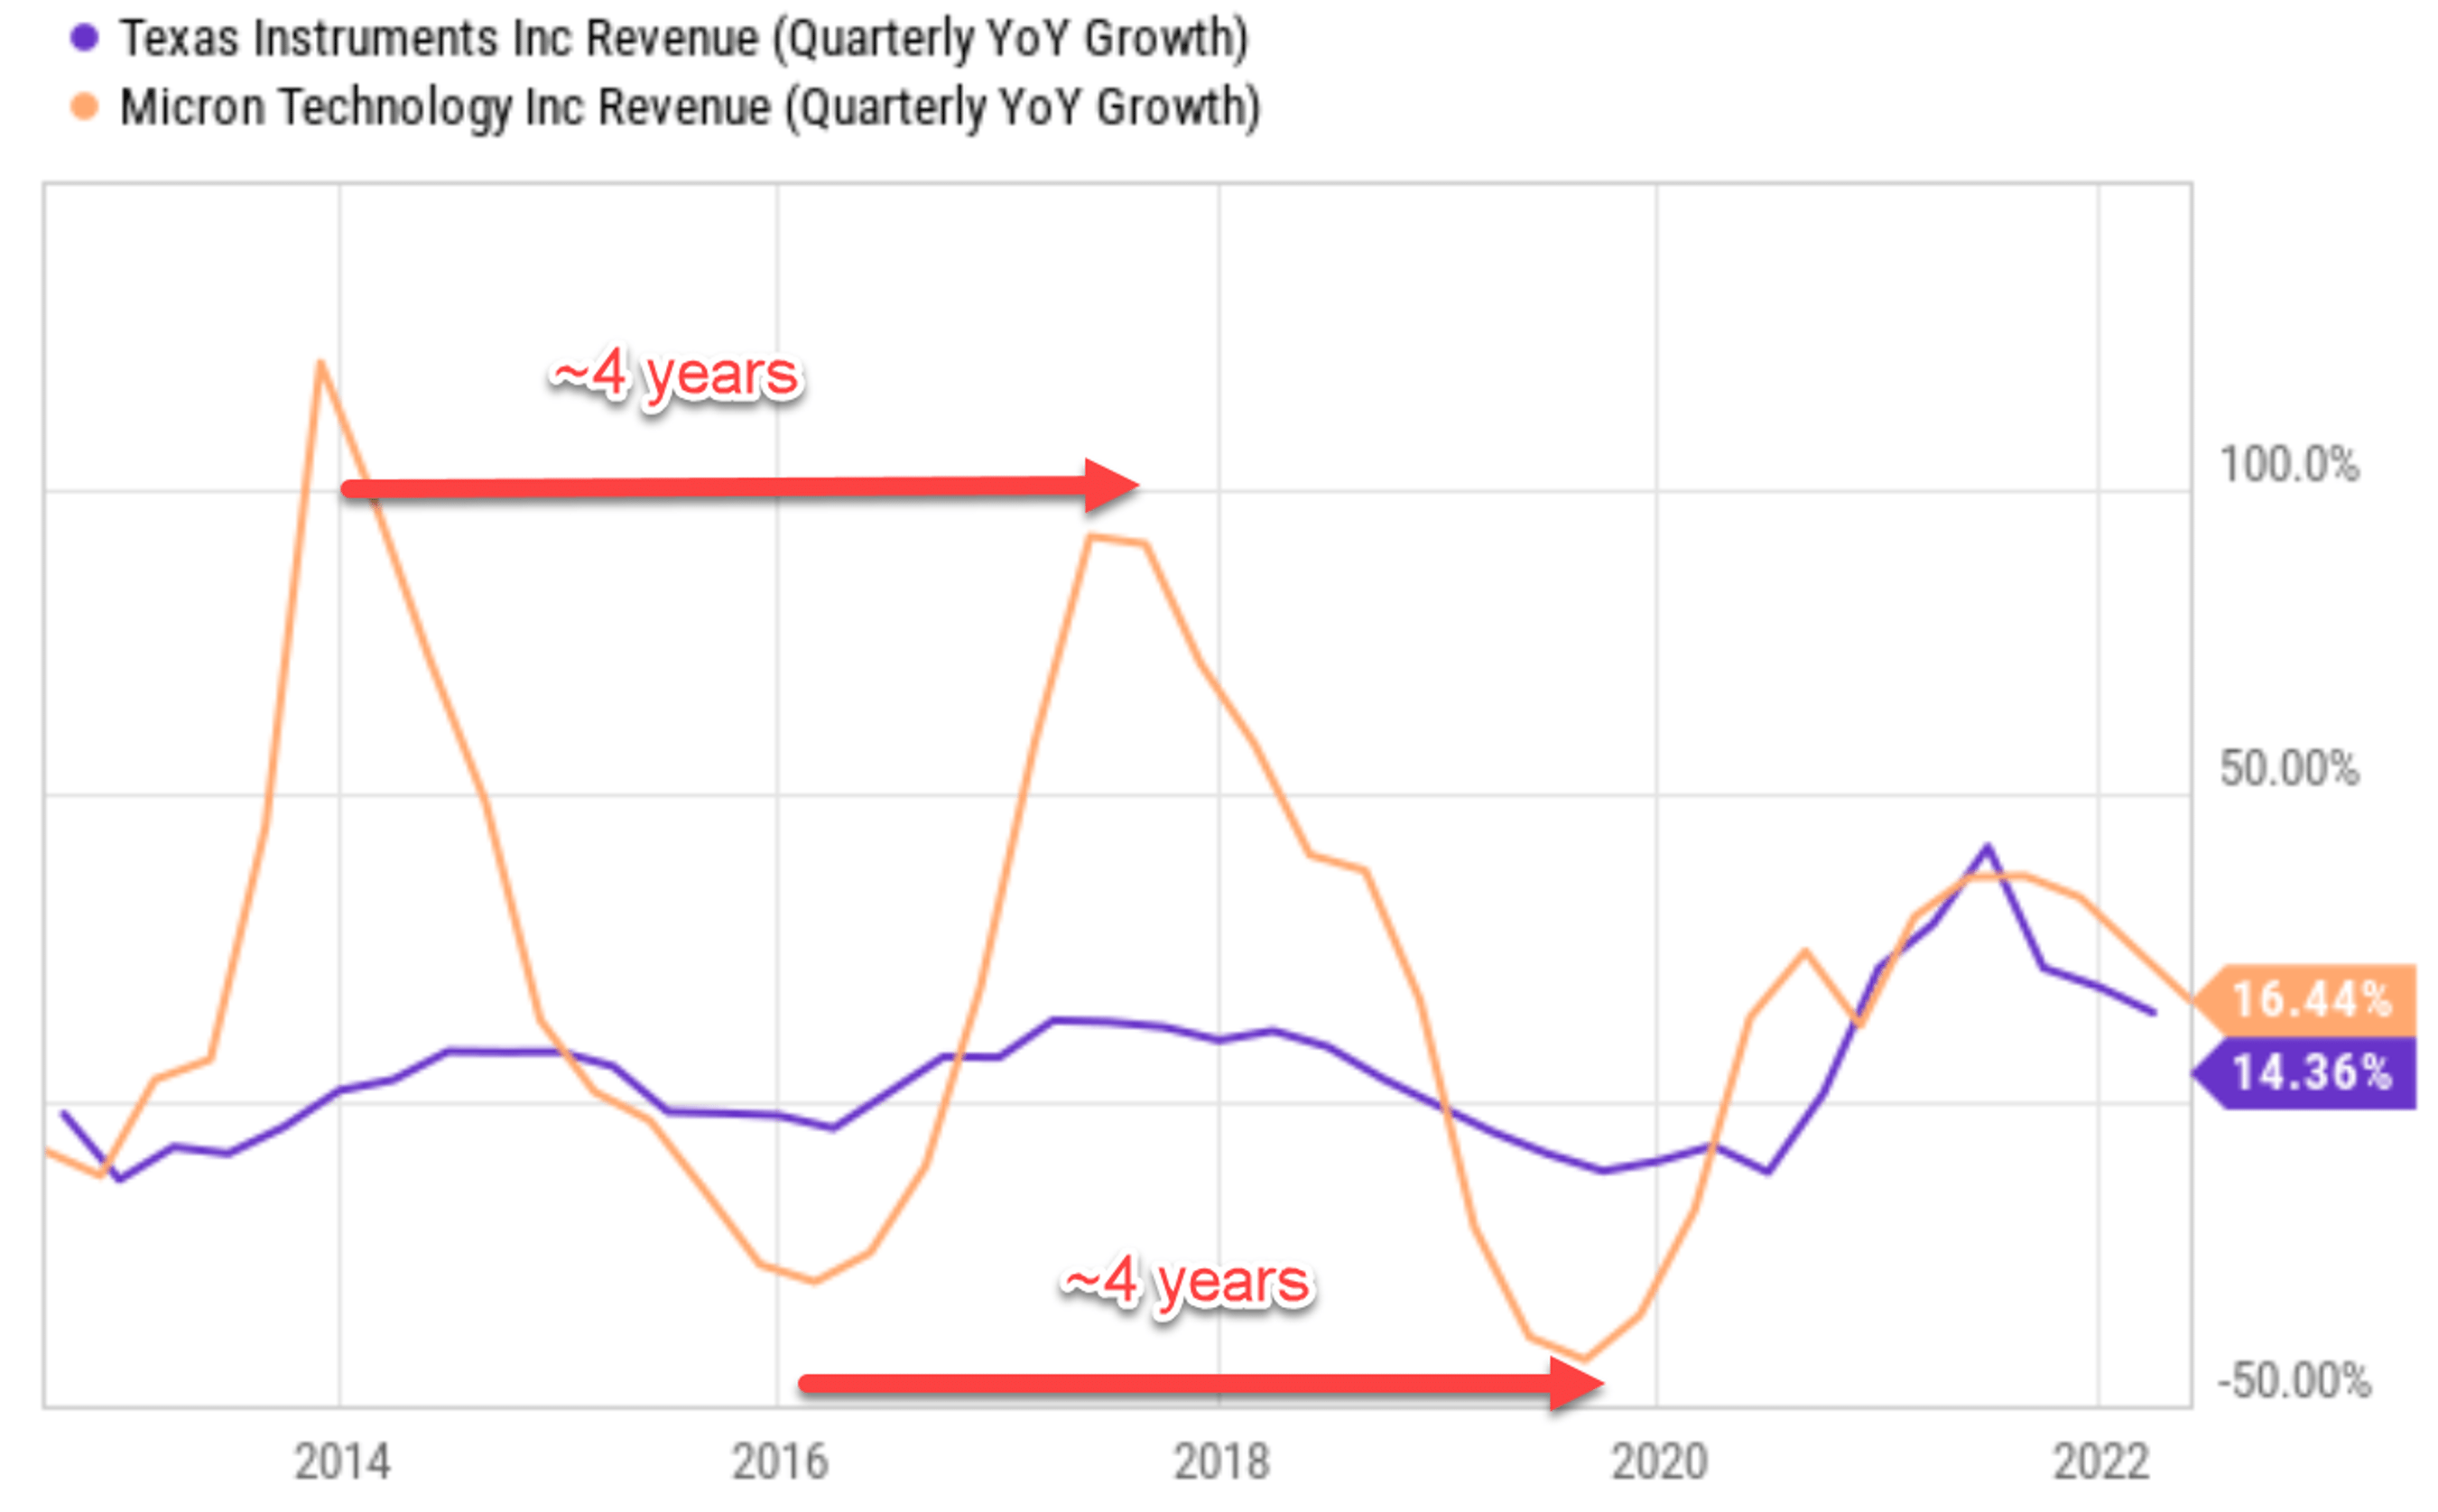
Another good way to see the cyclical behavior is through their asset turnover rates (ATR, aka asset utilization), as shown in the chart below. Here, you see the ATR for MU (bottom panel) has been fluctuating in the familiar sinewave again. And this time, you can see the wavy fluctuations for TXN more clearly also. To wit, TXN’s ATR has fluctuated in a range between about 0.615x and 0.908x with an average of 0.785x in the past 10 years. And its current ATR of 0.836x is a bit above the historical average. The peak of 0.908x occurred in early (2018), marking the end of the previous expansion cycle.
The picture for MU is very similar as shown in the bottom panel of the chart below. The main difference is that it is much more dramatic because the stock is more cyclical than TXN. Also, note that phases of the oscillations are also shifted from TXN (and also from sales growth shown above). Such shifts are due to the lags between production and sales. To wit, the ATR for MU has been fluctuating in a range between about 0.798x and 0.405x with an average of 0.599x in the past 10 years. And MU’s current ATR of 0.531x is below the historical average. Looking forward, I expect the ATR to stay this way through this contracting phase, which I anticipate lasting into 2023 following the historical 4-year cycle. Note that in late June, MU Chief Business Officer Sumit Sadana already mentioned that MU would reduce production.
Source: Author based on Seeking Alpha data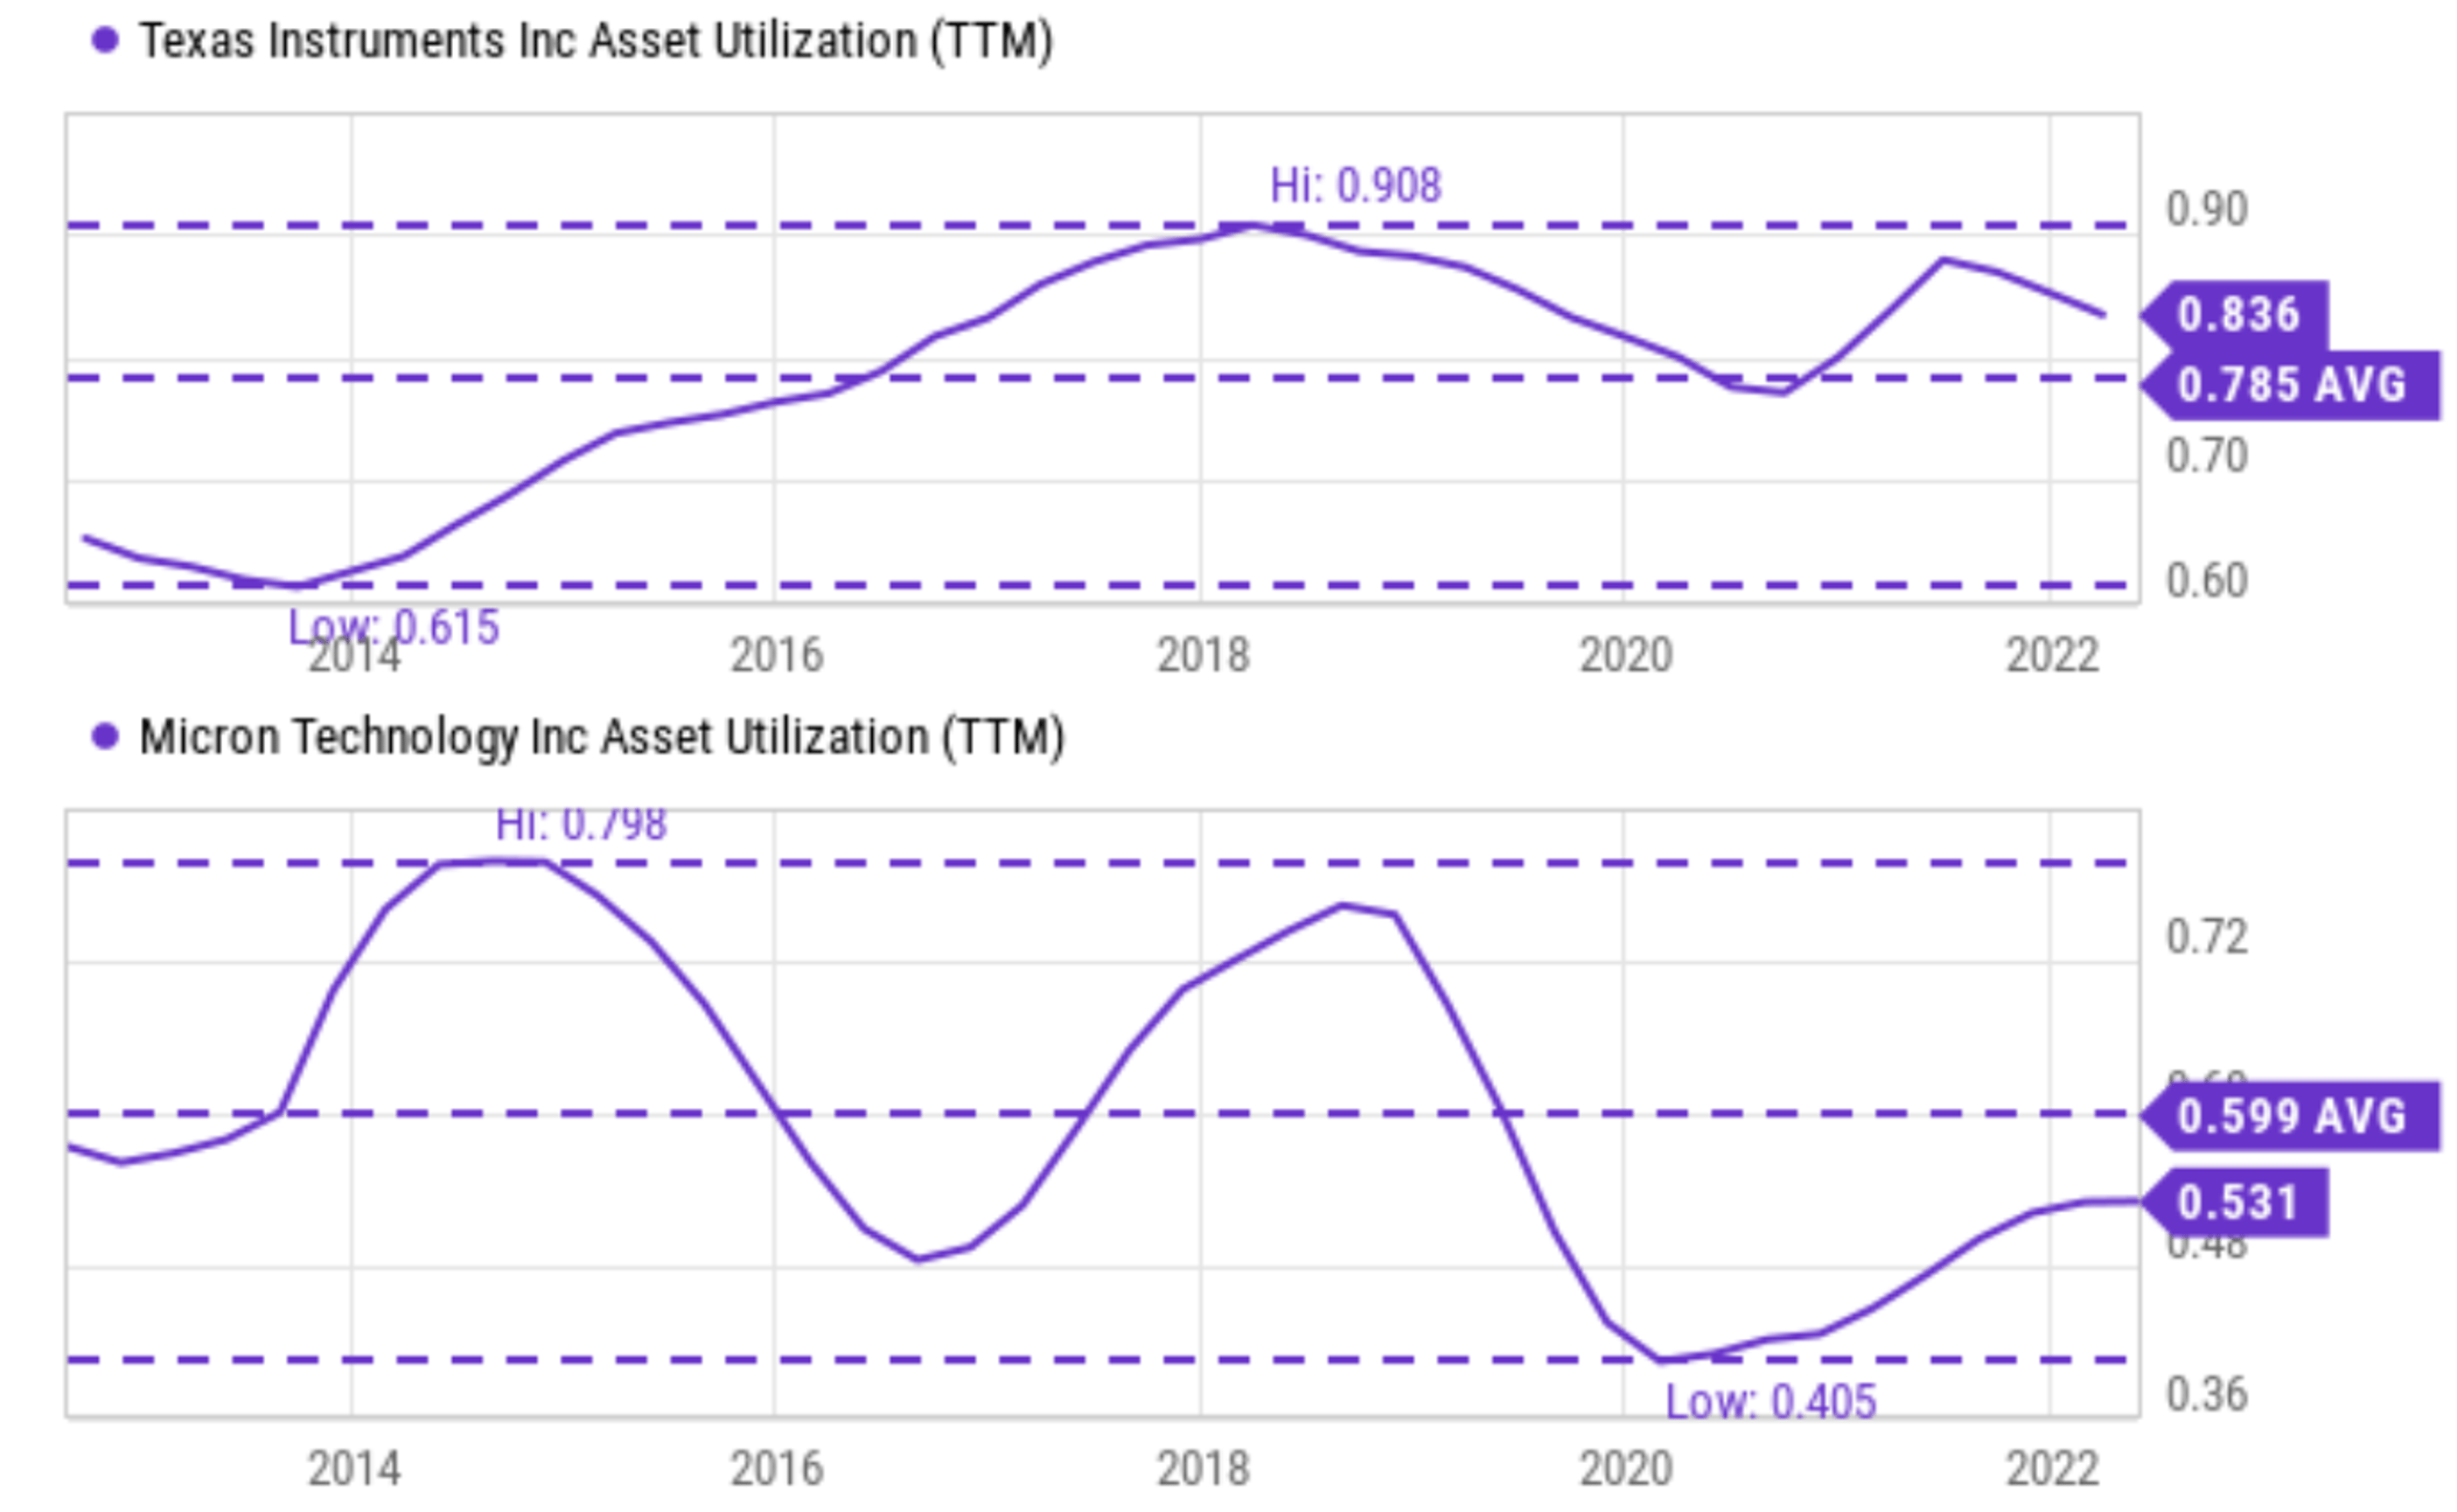
The forward-looking nature of PE
Also as commented in our article last week:
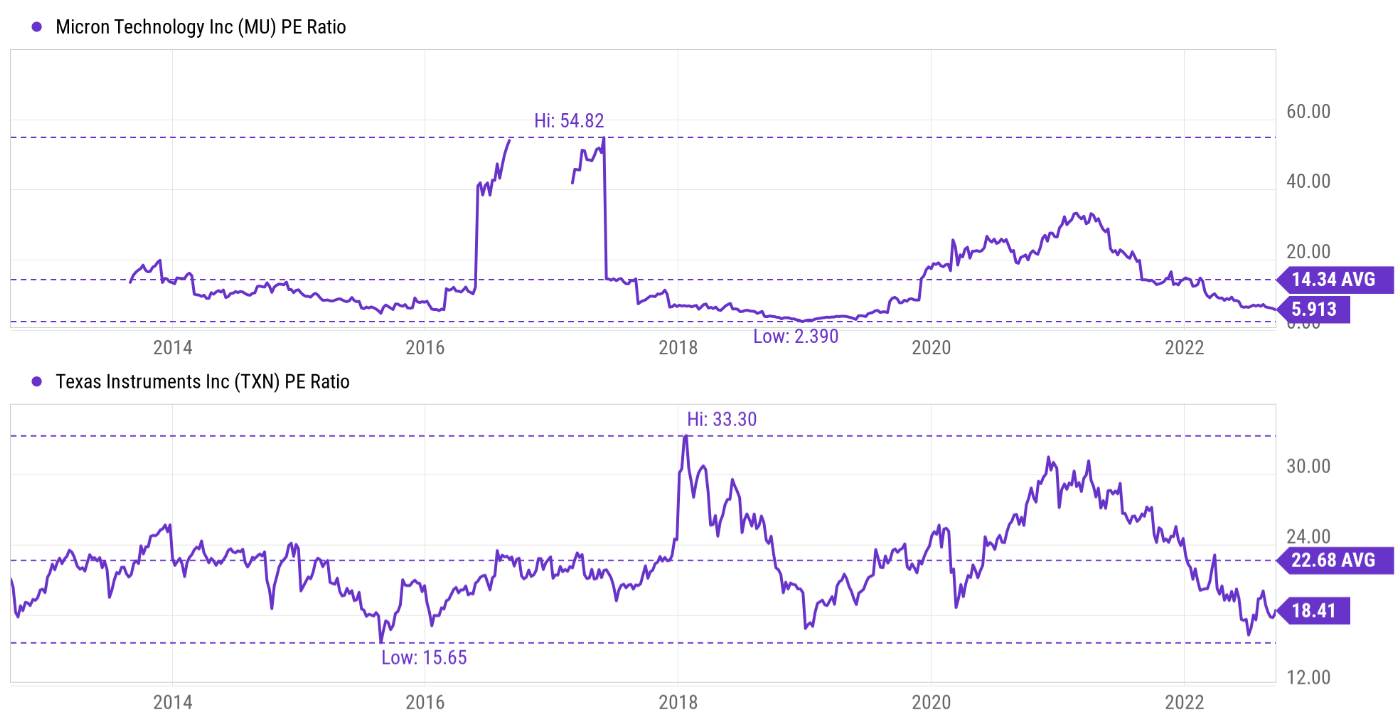
Investors are always forward-looking (like what I am doing here). And the current valuation always tries to price in future developments. For this reason, valuation always leads business fundamentals as you can clearly see from the following charts. Even though the fundamentals have not bottomed yet (actually the chip sector is still reporting positive growth if you recall from the early charts), their PE ratios already reached a multi-year bottom.
As you can see from the chart below, MU’s PE has led business fundamentals by about 5 to 10 months during the past cycle. And as you can see from the second chart below, currently, both MU and TXN are valued at a PE multiple that is close to their historical bottom, another illustration of the leading nature of valuation. To wit, MU is currently priced at a PE of only 5.9x, only a fraction of its historical average. And TXN is priced at 18.4x, not only significantly below its historical average of 22.7x (by 19%) but also close to the lowest level in the past ten years.
Next, I will argue that being more cyclical does not make MU a worse (or even a bad) investment if you can buy it at a cyclically low valuation.
Source: Author based on Seeking Alpha data Source: Author based on Seeking Alpha data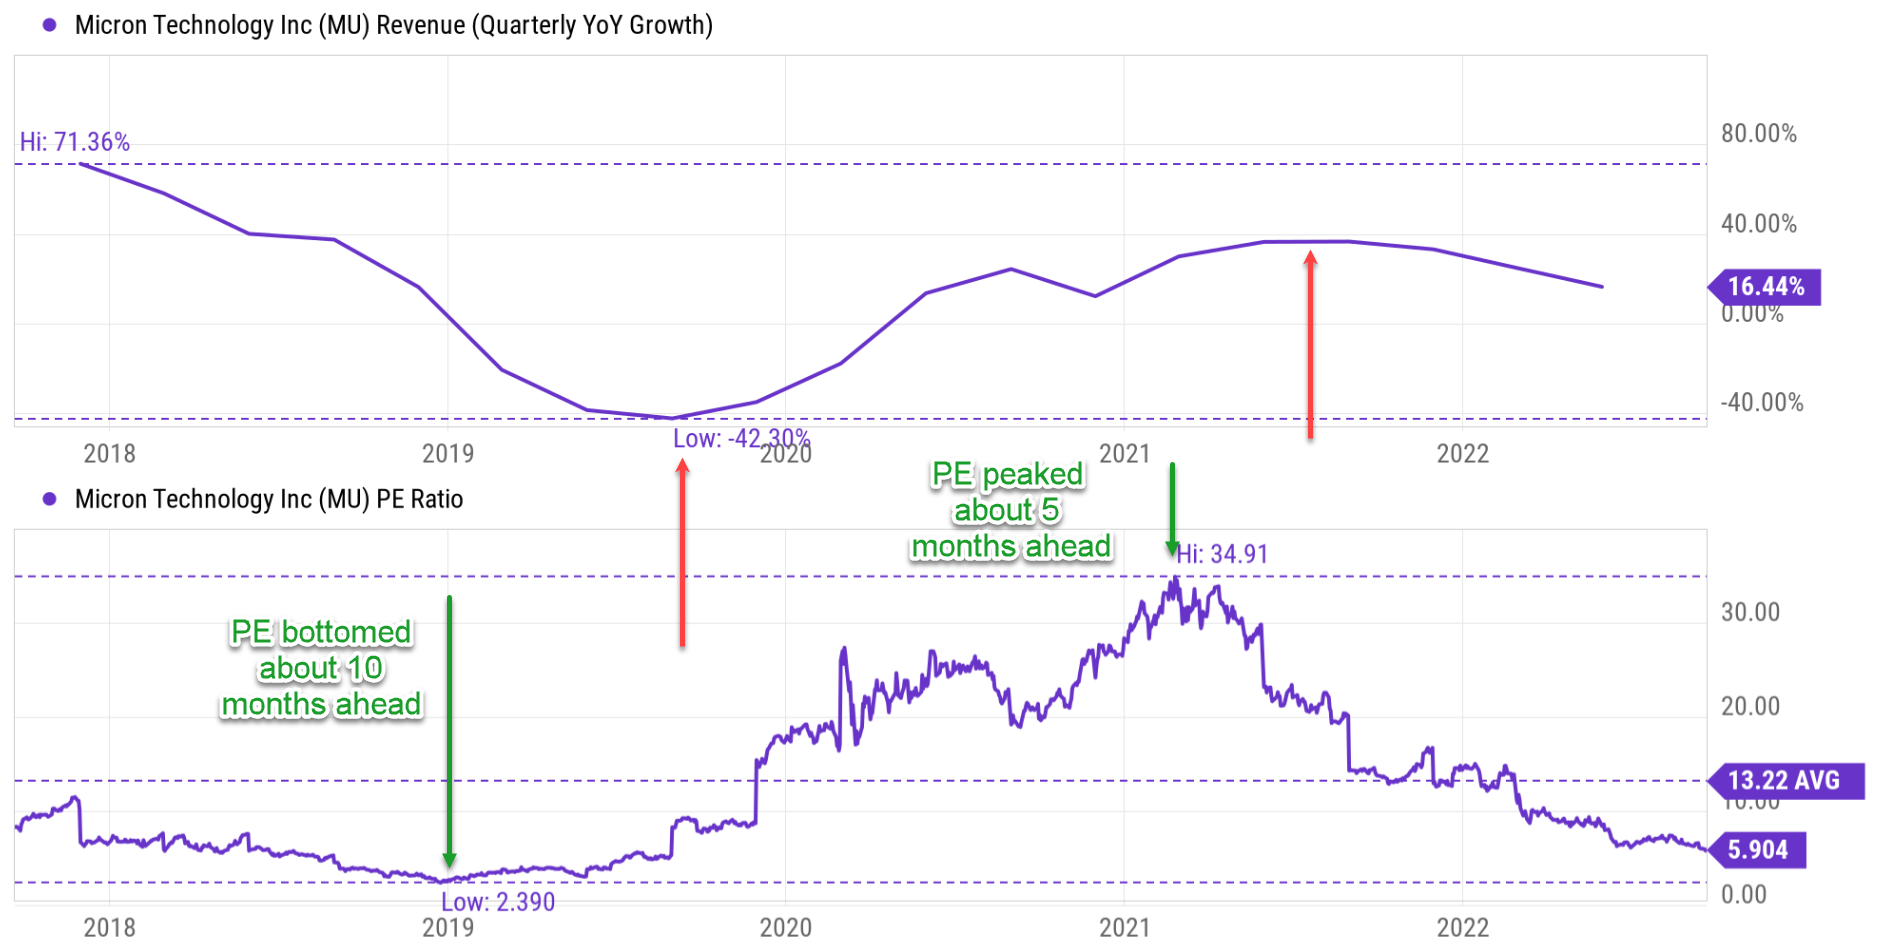
Expected return
The valuation for MU is so compressed because the market mood turned overly pessimistic during a contraction phase. As you can see from the following chart, the consensus estimates expect its earnings to contract substantially from an EPS of $8.36 this year to $5.06 next year. And the consensus estimates only project 3.8% of annual growth in the next 4 years. Such estimates are too pessimistic for me as has been argued in my other articles. I am projecting a growth rate in the upper single upper-digit range, about 5~6%, based on its ROCE (return on capital employed) and reinvestment rates.
However, at its currently compressed valuation, the stock can still deliver a solid return in the next few years even based on the pessimistic projections from the consensus estimates, as shown in the second chart below. As the following data show, MU is so undervalued both in absolute terms and also relative to its own historical records. The discount is about 51% in terms of PE multiple from its historical averages, and about 41% in terms of price to cash flow multiple. Even under a conservative growth rate of 4%, for the next 3~5 years, the total return is projected to be in a range of 99% (the low-end projection) to about 141% (the high-end projection), translating into an annual return of 18.7%to 24.6%.
Source: Author based on Seeking Alpha data Source: Author based on Seeking Alpha data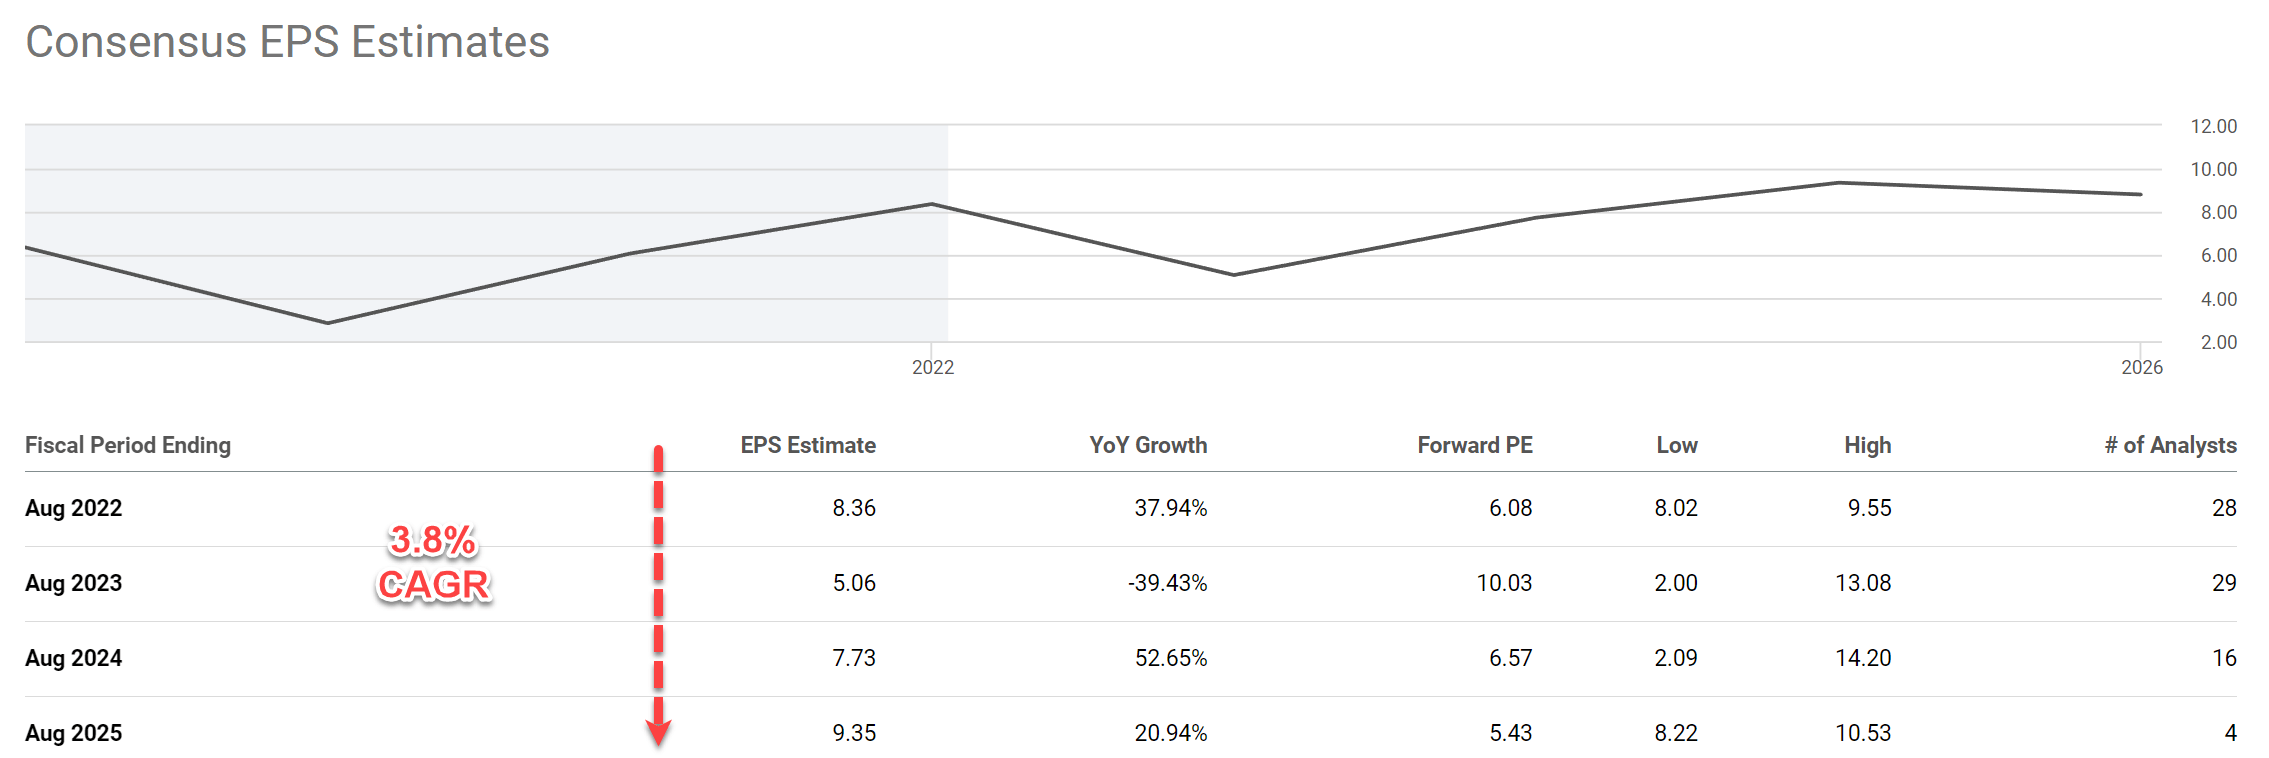

The valuation for TXN is also compressed, again because the market mood always turns overly pessimistic during a contraction phase. However, the compression is milder than in the case of MU because of TXN’s less cyclical nature. As you can see from the next chart, the consensus estimates also expect an earning contract, but a milder one, from an EPS of $9.57 this year to $8.88 next year. And the consensus only estimates 3.2% of annual growth. Such estimates are again too pessimistic for me.
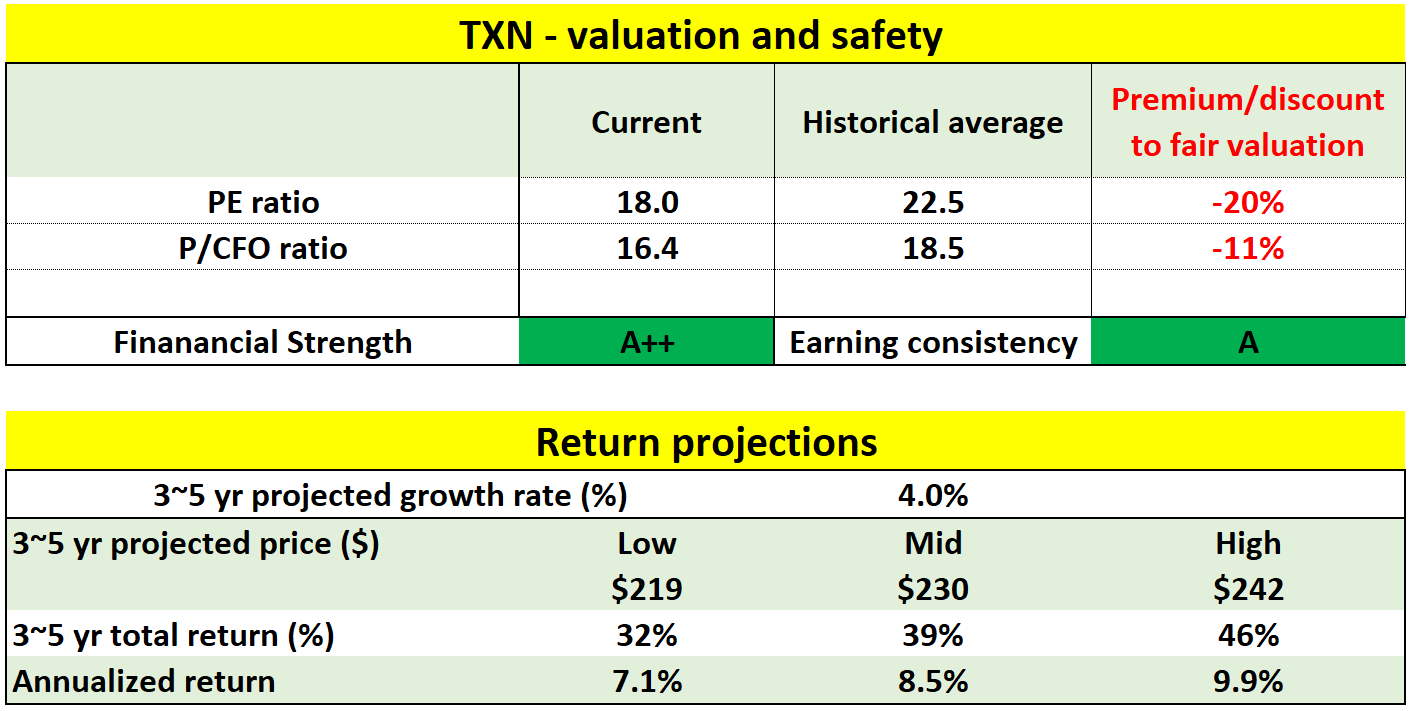
But again, due to the compressed valuation, TXN can also deliver a solid return even with a conservative growth projection. As shown in the second chart below, TXN is discounted by about 20% in terms of PE multiple from its historical averages, and about 11% in terms of price to cash flow multiple. Assuming a conservative growth rate of 4%, for the next 3~5 years, the total return is projected to be in a range of 32% to about 46%, translating into an annual return of 7.1% to 9.9%. A highly asymmetric opportunity in my view especially when adjusted for its A++ financial strength and A earning consistency.
Source: Author based on Seeking Alpha data Source: Author based on Seeking Alpha data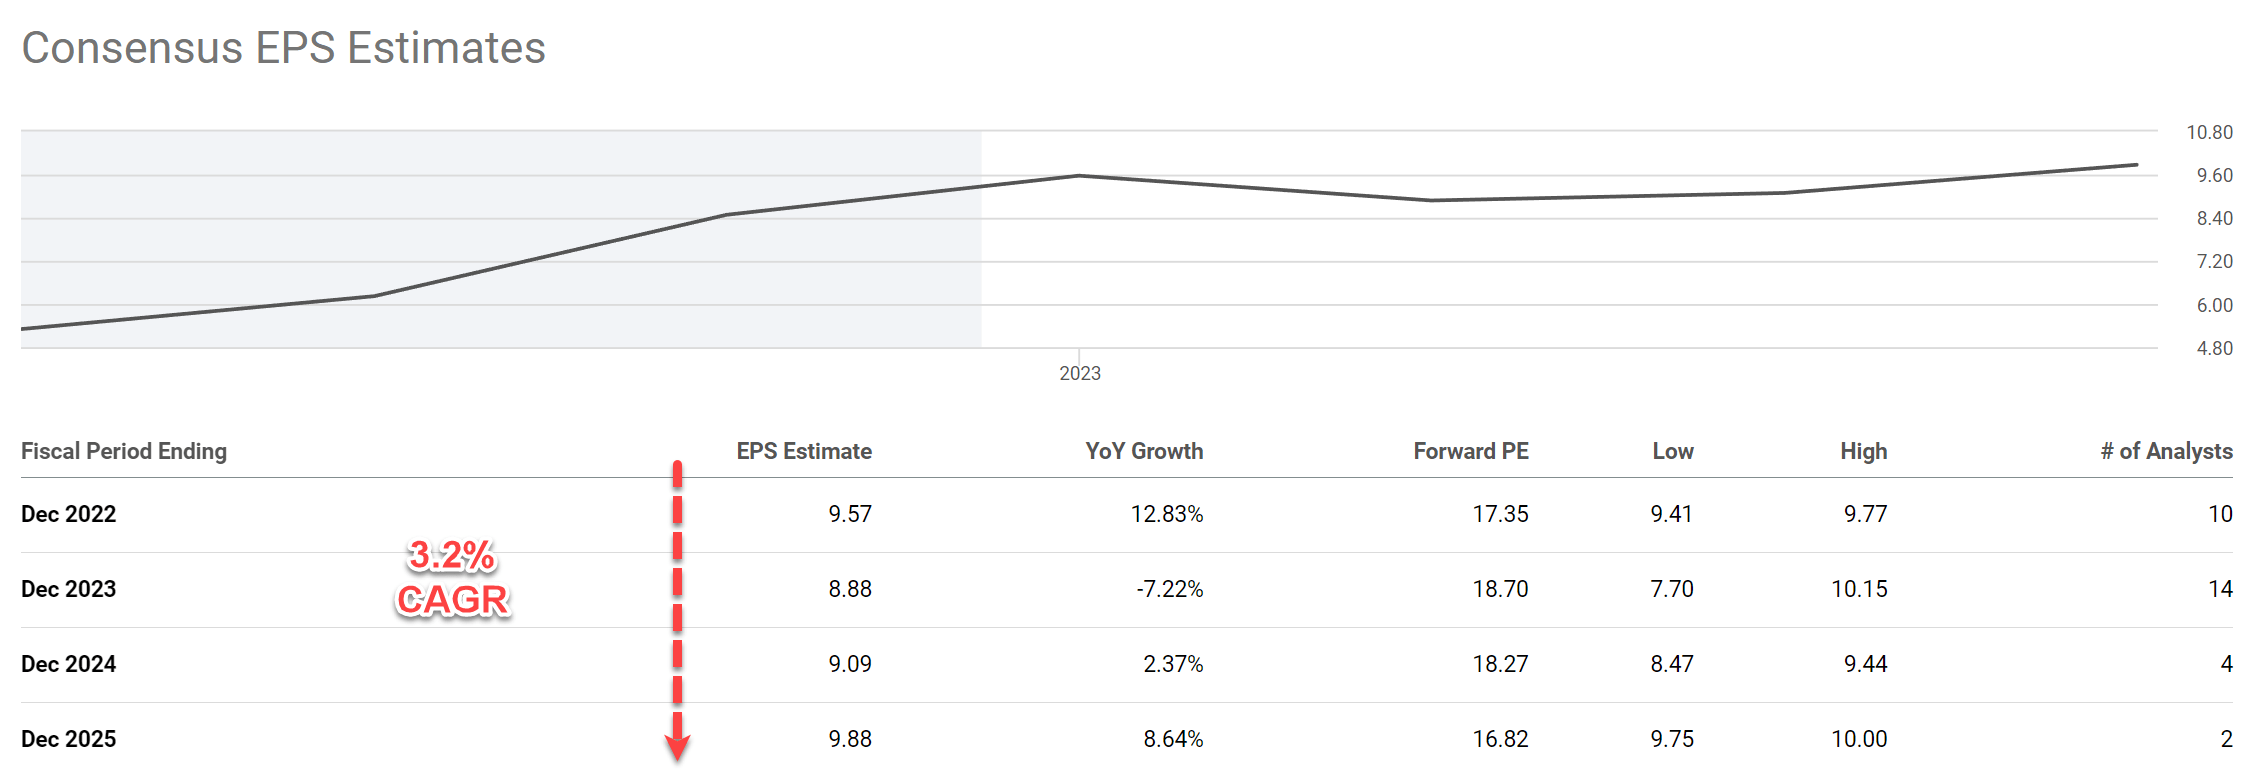
Risks and final thoughts
Besides the cyclicality, both stocks also face other risks. Both MU and TXN currently face the same macroscopic risks and geopolitical risks which can impact their operations in the near term. MU’s auto unit production remains below demand because of supply chain disruptions and silicon shortages. The Russian/Ukraine war further exacerbates the problem. TXN just broke ground on four new 300-millimeter semiconductor fabrication plants. These projects carry a $30 billion price tag and could stretch the company’s finances for several years. These new plants won’t come online and contribute to earnings till sometime in 2025.
To conclude, among major chip stocks, I expect MU to continue to be the most cyclical and TXN to be the least in this ongoing cycle also due to their product mixes. However, being the most cyclical chip stock does not make MU the worst (or even a bad) investment. I see both MU and TXN as attractive opportunities under the current conditions. Both are projected to deliver solid returns and offer a sizable margin of safety. Investors just need to pick the stock that suits their timescale, investment goal, and risk tolerance. For example, we ourselves are holding some MU shares in a UTMA account for our son. In that account, we can wait out the near-term volatilities or even an entire cycle.
Be the first to comment