bedo
Dr. Michael Burry, notorious for his great short during the 2008 financial crisis and profiting billions from it, has expressed strong opinions about the current market downturn, and believes we may only be halfway through this bear market.
In this article, we take a deeper macroeconomic look, and explain why he may be right, and we may have another decent downturn lurking around the corner.
We’re Halfway There
The biggest concern stems from a tweet Dr. Michael Burry made a few weeks ago, when the S&P 500 was trading about 1-2% lower than its last closing price on Friday. In this particular tweet, he said:
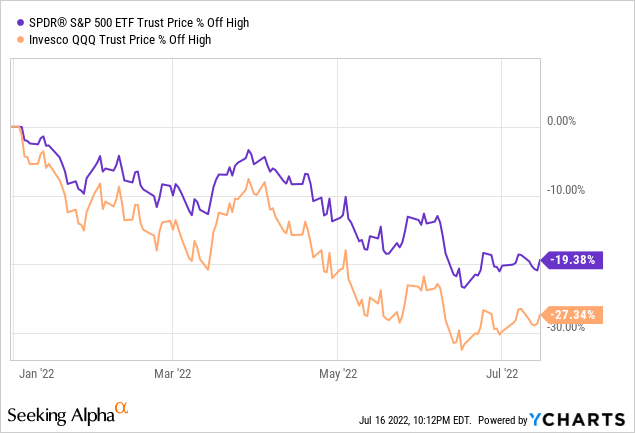
Adjusted for inflation 2022 first half S&P 500 down 25-26%, and Nasdaq down 34-35%, Bitcoin down 64-65%. That was multiple compression. Next up, earnings compression. So, maybe halfway there.
We believe that Michael Burry is right to express concern here, since we believe that there are some important economic indicators that may reflect an impending consumer recession, and that the first half of the year may have been primarily a compression of multiples.
One very interesting indicator that we have been keeping an eye on is perhaps the recent development of both Copper and Gold, as they have been excellent predictors of the economic situation in the past. Namely, Gold is widely regarded as a safe haven for investors, while Copper is exactly the opposite. Gold usually performs well in times of inflation, economic, political turmoil, etc.
Copper is commonly referred to as “Dr. Copper,” or the commodity with a PhD, because it is considered a particularly strong signal of economic health. Copper usually performs strongly when the global economy is booming, and even more so today because it is used as a key component in EVs, which typically contain twice as much copper as internal combustion vehicles.
As you can see in the chart below, copper prices have fallen by as much as 30% over the past 3 months, while gold has fallen as much as 13.3%, despite a record YoY inflation print coming in at 9.1% earlier this week.
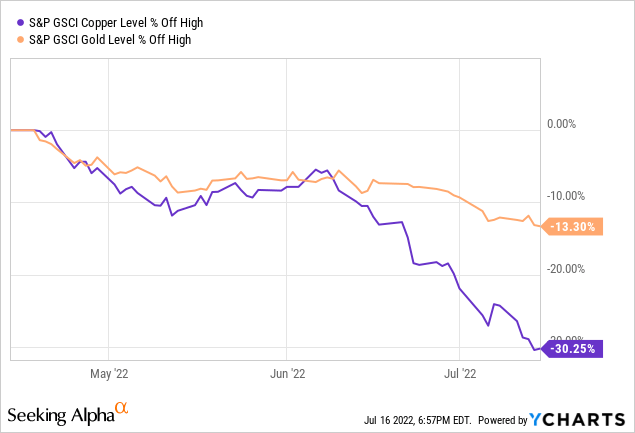
Copper falling by more than 30% in such a short period of time indicates that there is not really that much confidence in a strong, healthy global economy, while gold, on the other hand, may be a sign that inflation may have finally peaked, or that it may have been an overcrowded trade like energy stocks which have also fallen recently. It may also be good to note that Copper tends to be more volatile than Gold.
Bullwhip Effects
But it fits very well with Michael Burry’s story that we could be facing a consumer recession by the end of this year or early next year. Dr. Michael Burry has also alluded to this with his dissertation on the supply chain, specifically how supply chains can experience “Bullwhip effects.”
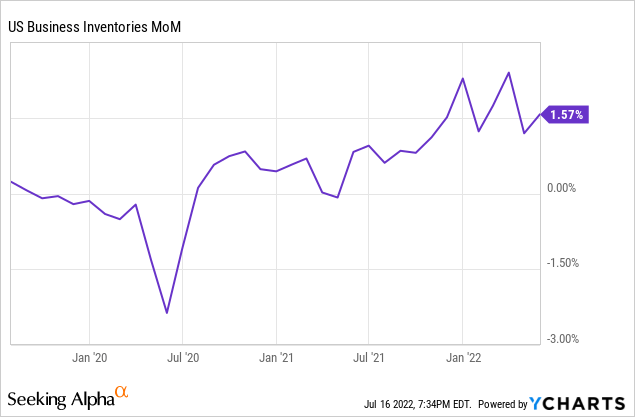
These Bullwhip effects, to which Michael Burry refers, amount to a shortage of goods at the end of last year, followed by overproduction, as a result of which we are now seeing huge piles of inventories. Note that the chart below shows inventory figures on an annual basis, and still needs to be multiplied by 12 to get an annualized percentage rate.
We agree with Dr. Burry and believe that although inflation has peaked, there is a good chance that the U.S. will enter a very deflationary spiral that will cause inflation to fall by the end of this year, even though the Fed is still tightening very aggressively at a time when growth is slowing and layoffs are occurring.
Which would potentially lead to disinflation later this year, with a consumer recession and the Fed reversing/lowering interest rates earlier than expected and continuing the cycle. He confirmed this belief with a witty statement on Twitter:
Q; In 2022, what brings Christmas in July? A; A disinflationary overstocked consumer recession at Christmas.
Is The Economy As Strong As It Looks?
Although very positive news came out on Friday, it indicated that retail sales rose more than analysts had expected in June, by 1% versus the estimate of 0.9%. This gave investors a positive signal that consumers are still strong despite all the ongoing inflation. On the other hand, this figure had not yet been adjusted for inflation, which came in last at 1.3% MoM, meaning that real sales were actually slightly negative.
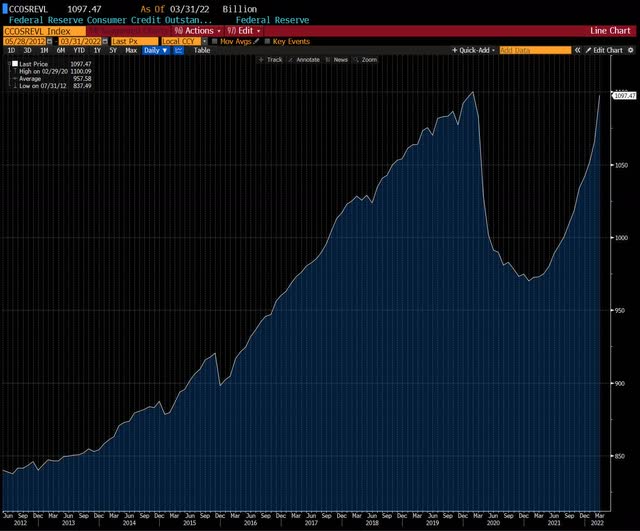
Another factor added by Michael Burry is the amount of revolving consumer credit, which has again risen to pre-pandemic levels. This happened when consumers’ purchasing power was destroyed after negative real wage growth due to rampant inflation.
And that won’t get any better with the Federal Reserve raising interest rates 75 basis points at a time, which hasn’t happened since the 1990s. Soon, that credit card debt will become a lot more expensive.
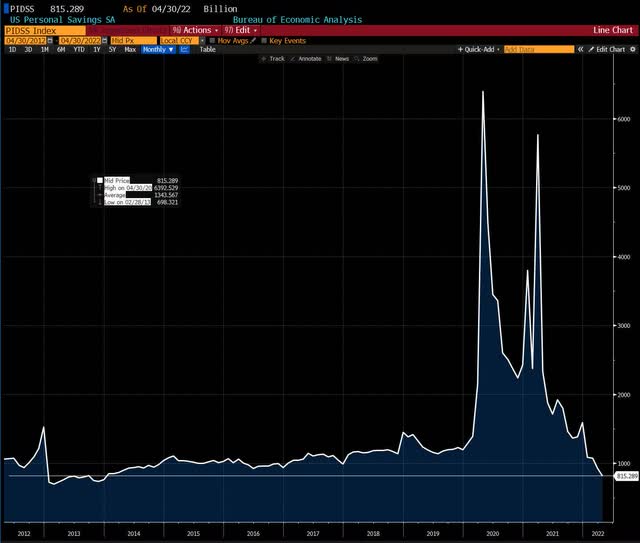
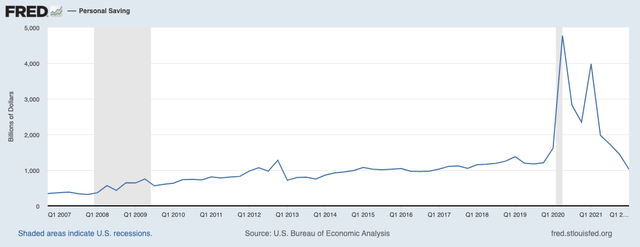
And consumers don’t seem to have been able to save much during this inflationary period either, after having trillions of dollars in stimulus spending. The personal savings rate has now fallen to its 2008 low of 5.4%.
According to Fed data, the amount of personal savings doesn’t look too bright either: the amount of personal savings for the first quarter of 2022 is at 2013 levels, after rising dramatically over the past two years.
Right now, companies can still pass on the cost of inflation to consumers without having too much of an effect on growth. But that could change very quickly, as inventories pile up, consumers run dry, and thus companies and manufacturers having to cut into their profit margins. And before you know it, you have an earnings recession.
Wall Street may have priced in the current inflation that has hopefully peaked, but the deteriorating earnings numbers for the second half of this year are far from priced in. According to FactSet data, analysts recently lowered their earnings estimates for the second quarter of 2022, but not at all for the second half of 2022, which we think makes no sense when looking at the macroeconomic data.
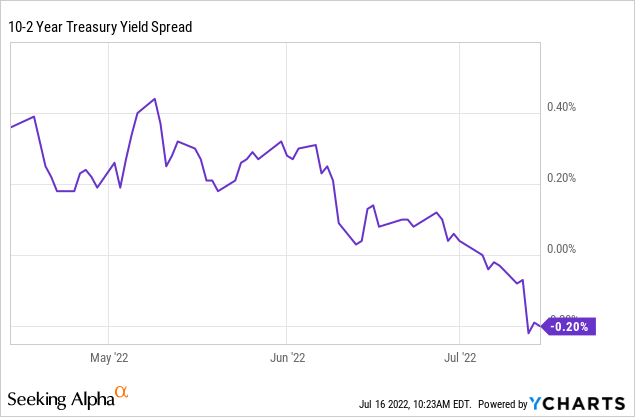
All indicators point to a very imminent economic slowdown, with, for example, the 10-2 Year Treasury Yield Spread inverted at negative 20bp. That’s a very strong inversion, which may also be a clear signal to the Fed that it may be pulling up too hard and destroying the economy in an attempt to reduce inflation too quickly.
Even the Atlanta Fed’s GDPNow tracker estimates a -1.5% decline in GDP for the second quarter, after the first quarter’s GDP was negative, suggesting the US may already be in a technical recession. And yet, earnings per share have not yet been revised downward, leading us to believe that some more pain awaits us.
However, we think that some initial relief may be on the way, as positive figures on falling inflation come out. That should also put the brakes on the Fed and make it more likely that it will not raise rates as aggressively as it has so far. Many analysts have speculated on a 100 basis point interest rate hike after inflation came in at 1.3% year-on-year and 9.1% year-on-year in the latest CPI figures, after initially counting on a 75 basis point increase.
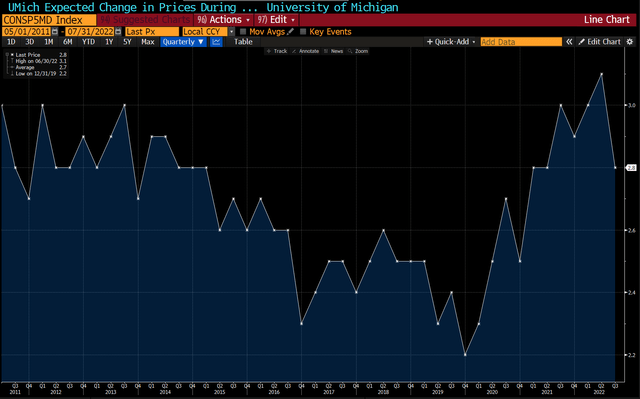
But following the release of the recent University of Michigan survey, which indicates a sharp drop in consumer expectations for 5-10 year inflation, which has fallen most sharply since October 2020. It seems to us that the Fed is very concerned about not being able to get the genie back in the bottle when it comes to long-term inflation.
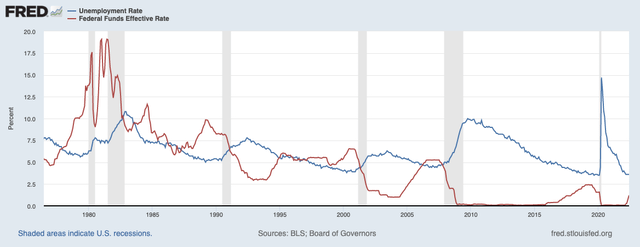
Undoubtedly, the most important indicator that still points to a very rosy economy is the unemployment rate. Although this is generally considered a lagging indicator because we are starting to see a lot of layoffs, especially in the tech industry.
For example, in the chart below, we have overlayed the unemployment rate and the effective Federal Funds rate. As you can see, it is usually a trend for the unemployment rate to rise as a lagging indicator when interest rates have historically been raised.
Where is Michael Burry Hiding?
Michael Burry’s vote of no confidence for what is about to happen in the economy is also reflected in the positions he has reportedly taken. For example, in his last 13F filings 2 months ago with the SEC, we can see that he took a put option worth almost US$36M on Apple.
He may or may not have sold that position, but it is likely that he is already profitable on those positions, as Apple has experienced more than a double-digit decline since he disclosed those put options.
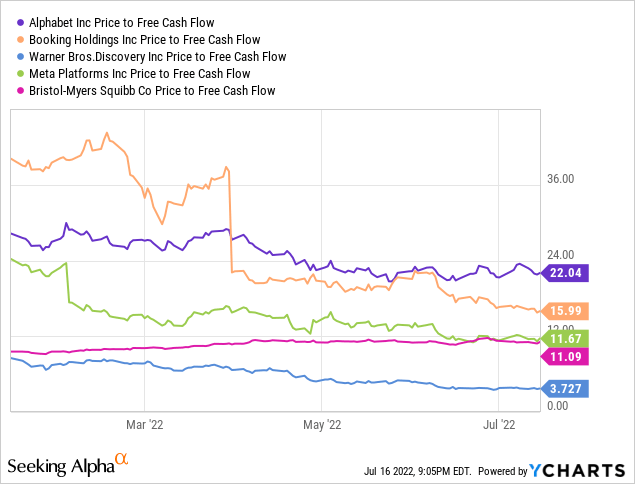
He also had positions in companies with primarily strong FCF, a large balance sheet at low multiples. Some of his positions include Alphabet (GOOG) (GOOGL), Booking Holdings (BKNG), Bristol-Myers (BMY), Discovery (WBD) and Meta (META).
The Bottom Line
With the Federal Reserve tightening at a lightning pace, economic indicators pointing to a recession, and earnings expectations not yet bottoming out, things could get worse before they get better.
In the meantime, however, we and Michael Burry continue to take advantage of this buying opportunity, as it is a dangerous game to try to time a bottom. We believe there are a lot of buying opportunities for quality stocks with strong balance sheets and solid business models that generate a lot of FCF and can easily survive the next recession.
And more importantly, that could get a huge boost if the Fed changes course and starts cutting interest rates sooner than expected, as Dr. Michael Burry seems to be predicting.


Be the first to comment