

Chip Somodevilla/Getty Images News
Introduction: Why Is META Stock Down?
Meta Platforms, Inc. (NASDAQ:META) (formerly Facebook) shares fell 25% today after reporting Q3 2022 results overnight. At $97.94, META stock is now back to a level last seen in 2016:
|
Meta Share Price (Since IPO) 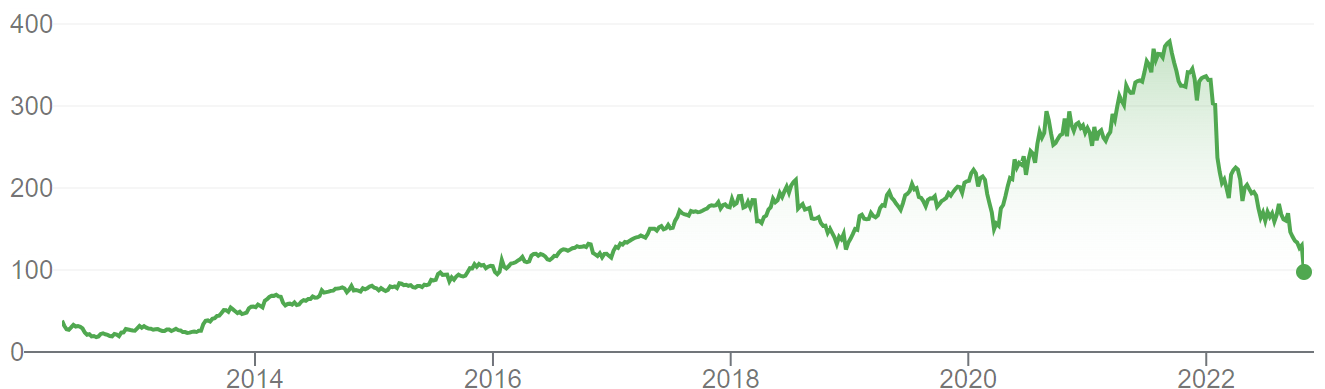 Source: Google Finance (27-Oct-22). |
Meta shares have now lost 43% since we initiated our Buy rating in March 2019 and 75% since its peak last September.
We see Meta’s share price collapse today as the result of poor messaging, by a management that is already mistrusted by investors. Q3 results were adequate in the context of macro headwinds, and Meta is making progress against both TikTok and Apple’s (AAPL) anti-tracking changes. The new 2023 outlook includes significant cost increases, but in large part due to hires already made. Headcount is expected to be flat next year, and management is likely targeting a return to EBIT growth after 2023. Similarly, the large CapEx increase guided for 2023 is largely unrelated to the Metaverse, and further increases will be contingent on engagement and revenue growth. We expect earnings to trough in 2023.
Meta shares are now at less than 7x 2021 EPS and, by our estimates, 13x 2023 EPS. This is cheap by most standards, especially if CEO Mark Zuckerberg further adjusts his cost and CapEx allocation after the recent market reaction. Simply returning to 2018 earnings and a 20x P/E by 2025 year-end would result in an 88% gain (21.9% annualized). Buy.
Meta’s Q3 Results Headlines
In Q3, Meta ad revenues grew 2.6% year-on-year at constant currency but fell 3.7% as reported due to the strong U.S. dollar. Growth rates for total revenues were slightly worse due to lower Quest 2 hardware sales this year:
|
Meta P&L (Q3 2022 vs. Prior Periods) 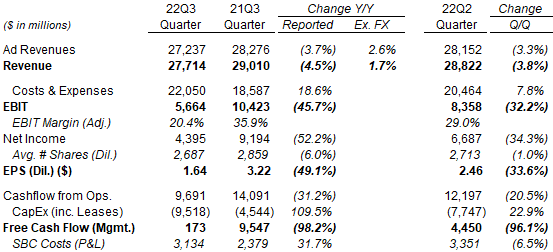 Source: Meta results releases. NB. SBC = Share-Based Compensation. |
EBIT, Net Income and EPS all fell by large double-digits due to Costs & Expenses growing 18.6% year-on-year. As we will explain later in this article, much of this increase is due to the effect of hires already made in prior quarters.
We believe Meta’s revenue growth in Q3 was adequate in the context of macro headwinds.
Meta’s Q3 Revenue Growth Was Adequate
Meta’s 2.6% ex-currency ad revenue growth in Q3 was in spite of the continuing impact from the growth in the currently lower-value Reels video product, a $500m (1.8 ppt) headwind in management estimates.
The 2.6% figure also followed two years of double-digit growth during COVID-19. It represents a slight deceleration from Q2’s 2.9%, with the benefit of lapping Apple App Tracking Transparency (“ATT”) changes in 2021 being offset by weaker macro, which Alphabet (GOOG) (GOOGL) also observed in their Q3 results:
|
Meta Ad Revenue Growth Year-on-Year (Ex-Currency) – Stacked 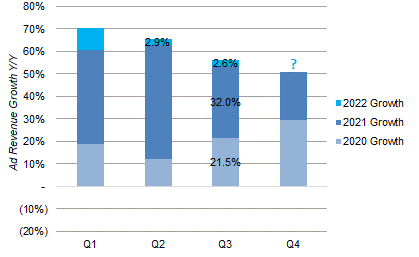 Source: Meta results releases. |
Meta observed “continued softness” in ad spend in verticals such as online commerce, gaming, financial services and Consumer Packaged Goods, among the verticals most affected by fading of pandemic-related demand boosts, supply chain disruptions, inflation and higher interest rates. Alphabet likewise observed softness in its financial services and gaming verticals.
The sequential deceleration in Meta’s ad revenue growth was also far smaller than Alphabet’s. In U.S. dollars, year-on-year growth in Google Advertising decelerated from almost 9 ppts between Q2 and Q3, from 11.6% to 2.5%; management comments indicate less than 1.5 ppt of this came from a large currency headwind (3.7 ppt in Q2, 5.1 ppt in Q3), leaving an ex-currency deceleration of around 7.5 ppt, compared to Meta’s less than 0.5 ppt. This is consistent with both companies being impacted similarly by macro and Meta benefiting from lapping last year’s ATT changes.
Finally, in U.S. dollars, while Meta’s year-on-year ad revenue growth in Q3 was worse than both Google Advertising and Snap (SNAP), its sequential ad revenue growth was actually similar to Google Advertising as a whole, worse than Google Search but better than YouTube and Google Network:
|
Meta Ad Revenue USD Growth vs. Google & Snap (Q3 2022) 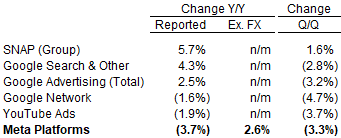 Source: Company results releases. |
We, therefore, view Meta’s ad revenue growth in Q3 as adequate, certainly not meriting the 25% collapse in its shares.
Meta’s Progress Against TikTok And Apple
Meta Q3 results also included data points that showed it is making progress against TikTok and Apple ATT, its two most serious structural threats.
Against TikTok, Meta has had some success in growing its own Reels offering. The annual revenue run-rate of Reels ads across both Instagram and Facebook has reached $3bn, up from $1bn last quarter. The number of Reels played each day across Facebook and Instagram has increased by 50% in the last 6 months, to 140bn. Users are re-sharing Reels 1bn times a day through Direct Messaging on Instagram alone. Management stated that user time spent on Reels “is incremental to time spent on our apps” and that “we are gaining time spent share on competitors like TikTok”.
While Reels’ growth will continue to represent a revenue headwind in the coming quarters, management stated that they “expect to get to a more neutral place over the next 12-18 months.”
Against Apple ATT, management explicitly stated that “consistent with our expectations, the headwind to year-over-year growth from Apple’s ATT changes diminished in Q3 as we lapped the first full quarter post the launch of iOS 14.5”.
Meta’s standard user metrics also show continuing stability and growth during Q3. Both Daily Active People (“DAP”) and Monthly Active People (“MAP”), users of Meta’s Family of Apps, grew sequentially by just over 1.5% in Q3, while Monthly Active Users (“MAU”) and Daily Active Users (“DAU”), users of Facebook only, both grew 0.8%:
|
Meta User Numbers (SinceQ2 2019) 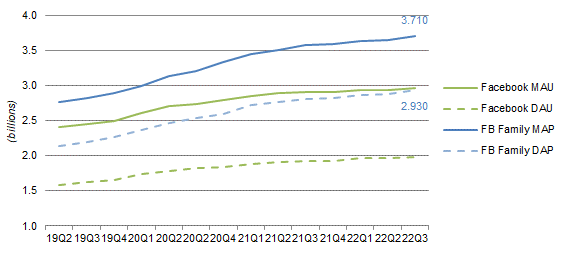 Source: Meta results releases. |
Even in U.S. & Canada, Facebook’s oldest region, its MAU grew slightly and its DAU was flat in Q3 2022.
Meta also mentioned successes in other areas. For example, Click-to-Messaging ads on Facebook and Instagram have now reached $9bn in run-rate revenues, while Click-to-WhatsApp ads have just passed $1bn in run-rate revenues.
2023 Cost & CapEx Outlook In Context
What alarmed investors the most was likely the large increases in costs and CapEx implied in the new 2023 outlook, but we believe these should be seen in context.
Management is now guiding to total Costs & Expenses of $85-87bn in 2022 and $96-101bn in 2023, as well as to CapEx of $32-33bn in 2022 and $34-39bn in 2023, both representing significant increases from 2021:
|
Meta Outlook (2022-23) 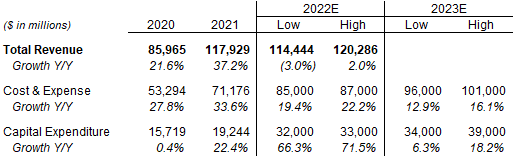 Source: Meta results releases. NB. 2020 cost growth rate excludes FTC fine in 2019. |
However, much of the expected cost increase in 2023 is due to hires already made in prior quarters (Costs & Expenses were already on an $88.2bn run-rate in Q3 2022); one-off office consolidation costs are expected to account for $2bn in 2023 (and $0.9bn in 2022); and much of the cost increase in 2023 will be either non-cash higher depreciation charges from recent CapEx or Costs of Goods Sold associated with planned new Quest headset sales.
In fact, management made several references to how headcount growth has already slowed and is expected to stop completely after Q3, at least until 2023 year-end. On the earnings call, we heard that:
“Some teams will grow meaningfully, but most other teams will stay flat or shrink over the next year. In aggregate, we expect to end 2023 as either roughly the same size, or even a slightly smaller organization than we are today.”
Mark Zuckerberg, Meta CEO
“Our pace of hiring slowed in the third quarter … We added 3,700 net new hires in Q3, down from our Q2 net additions of 5,700 despite Q3 typically being a seasonally stronger hiring period. We expect hiring to slow dramatically going forward and to hold headcount roughly flat next year relative to current levels”
Dave Wehner, Meta CFO
And, while Meta “do anticipate that Reality Labs operating losses in 2023 will grow significantly year-over-year”, Zuckerberg seemed to have indicated that losses will be managed thereafter to enable group EBIT to grow:
“Beyond 2023, we expect to pace Reality Labs investments to ensure that we can achieve our goal of growing overall company operating income.”
Almost the exact same phrase was included in the results press release and in the CFO’s prepared remarks, albeit with “in the long run” included at the end of the sentence.
CapEx is set to grow in 2023. However, “substantially all” of the growth is related to AI, not the Metaverse, and incoming CFO Susan Li indicated that further increases will be contingent on engagement and revenue growth:
“Our level of CapEx investment will depend on the returns that we generate through these investments in AI. And if we generate significant engagement and revenue gains, we’ll continue investing here. And if we don’t, we’ll pace our spending accordingly.”
We believe 2023 may mark the high point of Meta’s costs and CapEx, unless revenue growth meaningfully accelerates to warrant more spending. Either way, 2023 is likely to represent the trough in Meta’s earnings and cash flows.
Meta P&L Forecasts
We believe management comments imply that EBIT may fall by 35% in 2022 and by a further 18% in 2023.
In our forecasts, we have taken the mid-point of management guidance for both Q4 2022 and 2023, and added our own assumption of a 5% revenue growth in 2023. We believe a 5% revenue growth in 2023 is reasonable, as we expect some of the current macro headwinds to moderate, Reels should be a smaller headwind over time and Meta is having success with some products. Management also stated on the call that “we believe that we will return to healthier revenue growth trends next year”.
Based on these assumptions, Adjusted EBIT will fall to $30.6bn in 2022 and $25.0bn (excluding $2bn of one-off office consolidation costs) in 2023, the latter only slightly higher than the figure in 2018:
|
Meta Key P&L Items – Historic & Our Forecasts (2018-23E) 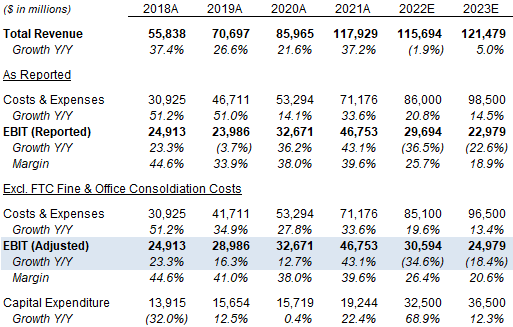 Source: Meta company filings, Librarian Capital estimates. |
We expect EBIT to resume growing after 2023, with better revenue growth and lower cost growth (or even cost cuts).
Potential For Greater Cost Discipline
With the collapse in Meta’s share price, CEO Mark Zuckerberg, who also controls the company through super-voting shares, has lost $11bn of his net worth overnight and more than $100bn since last September. We do not believe he is insensitive to this and, even if he is indifferent to short-term price moves personally, the importance of stock options in employee compensation means that management will feel obliged to take remedial action.
We believe the references to keeping headcount flat, growing EBIT over time, etc., as described above represent an effort by management to reassure shareholders, albeit clumsily delivered and overshadowed by poorly-worded answers to analyst questions later on the earnings call.
There is a meaningful likelihood that Meta will try to demonstrate greater cost discipline to appease investors.
Valuation: META Stock Key Metrics
At $97.94, relative to 2021 financials, Meta stock is trading at a 6.7x P/E and a 9.0% Free Cash Flow (“FCF”) Yield:
|
Meta Net Income & Cashflows (2018 to Q3 2022) 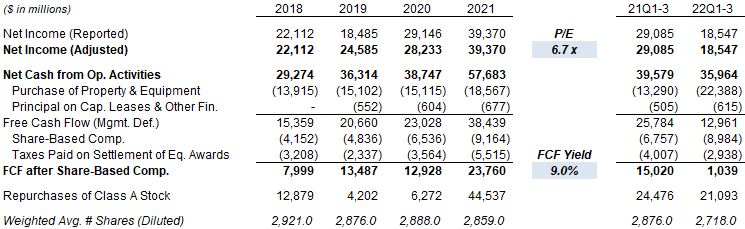 Source: Meta company filings. |
If we assume Net Income will decline by 35% in 2022 and 20% in 2023 (similar to our EBIT forecasts above), then Meta stock is trading at 12.9x 2023 EPS. This is cheap by most standards, especially if CEO Mark Zuckerberg further adjusts his cost and CapEx allocation after the recent market reaction.
What Is META Stock’s 2025 Forecast?
We cut our Meta forecasts substantially again. We now assume:
- 2022 Net Income to fall 35% (was 38%)
- 2023 Net Income to fall 20% (was to grow 10%)
- From 2024, Net Income to grow by 5% each year (was 10%)
- Share count to fall by 3% each year (unchanged)
- P/E at 20x at exit (was 30x)
- No dividends
The new 2025 EPS forecast of $9.20 is 32% lower than before ($13.46):
|
Illustrative Meta Return Forecasts 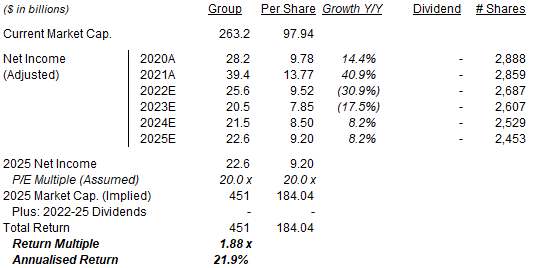 Source: Librarian Capital estimates. |
Our 2025 Net Income forecast is only slightly higher than the 2018 figure ($22.1bn), though our EPS forecast is 22% higher due to a lower share count.
On these pessimistic assumptions, with Meta stock at $98.37, we expect an exit price of $184 (less than half of its peak) and a total return of 88% (21.9% annualized) by 2025 year-end.
Is META Stock A Buy, Sell, Or Hold? Conclusion
We reiterate our Buy rating on Meta Platforms stock.
Be the first to comment