

Spencer Platt/Getty Images News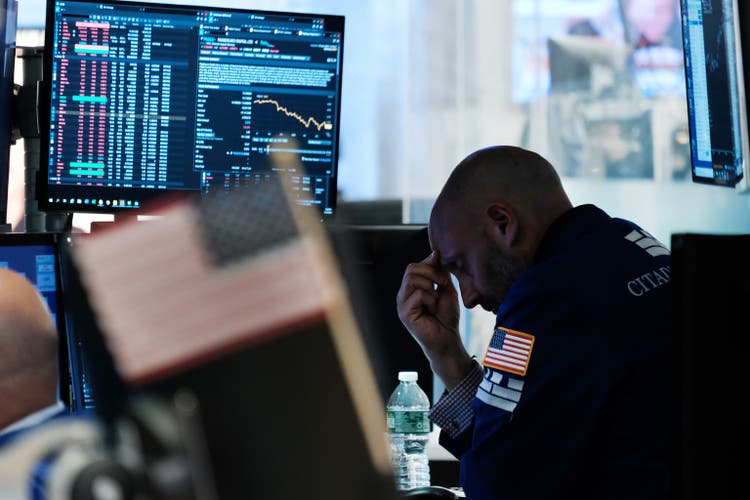
Introduction
In this new series, I will be initiating a weekly market report that summarizes developments in the prior week as well as provide some outlook for the upcoming week. This way, investors and traders will be better able to navigate the uncertainty and bouts of volatility as the FED further ramps up i/r and QT.
Coverage will span both the U.S. equity and crypto markets, as well as a why I think APAC is the preferred market for now, alongside the upcoming week outlook.
Let’s begin!
Market Movement
S&P 1 Week Heat Map (Finviz)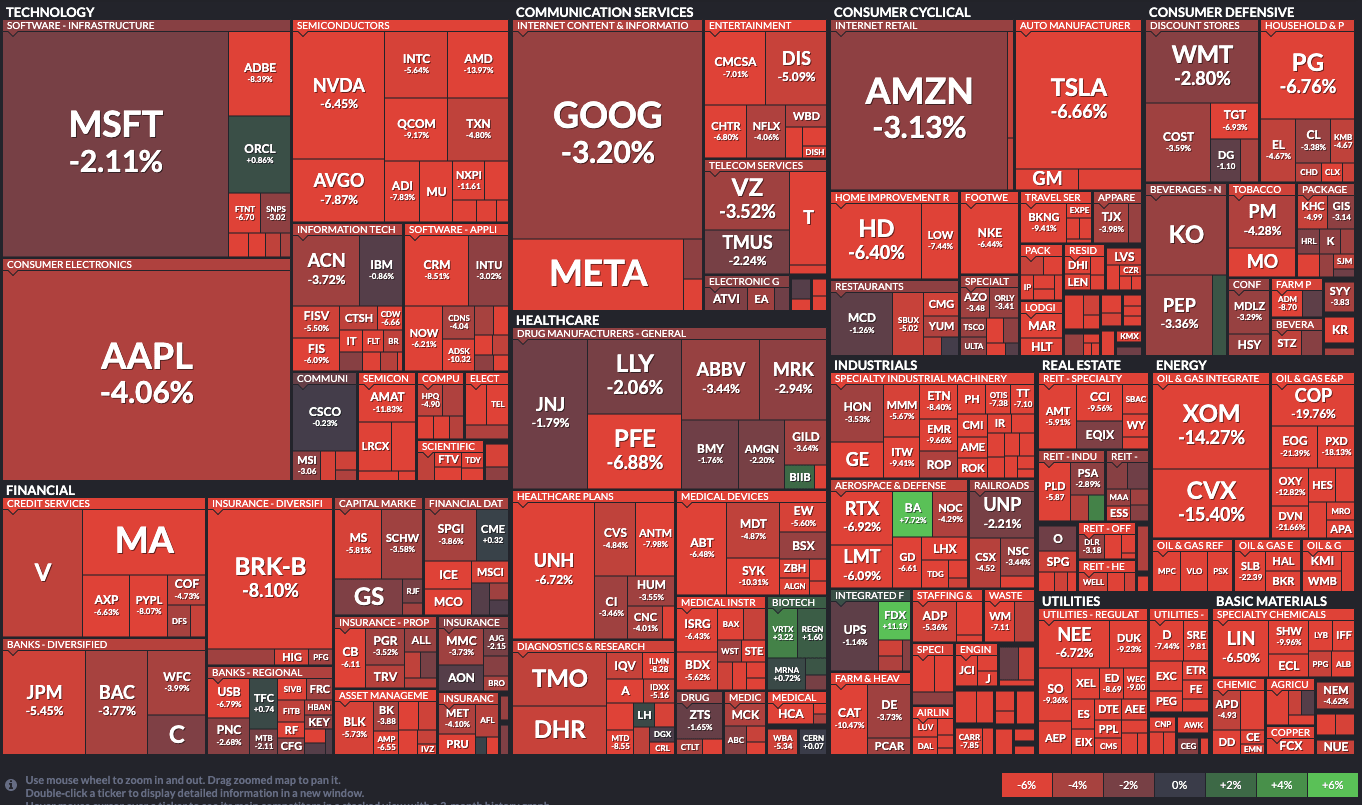
Markets ended the week down significantly with the SPY (SPY) down 579bps, Dow (DIA) down 479bps, and the Nasdaq (QQQ) down 479bps. The S&P 500 posted its worst week since 2020 as bears successfully pushed the index to close into bear market territory (more than a 20% decline off local highs) for the 1st time this year. To date, the SPY remains down 23.3%, DIA down 18.3%, and the NDQ down 31.2%.
Markets surprisingly rallied Wednesday after the rate hike and FOMC meeting but capitulated on Thursday as investors started to question the FED’s ability to execute a soft landing. Instead, worries accumulated, fearing that the FED may perhaps force a recession by overdoing the rate hikes after clearly over-printing money when QE was at its peak.
The 75bps rate hike was the largest increase in 28 years with guidance given by Powell that the next hike would also be in the range of 50-75bps as the FED attempts to stem a surge in inflation, driven by volatile food and energy prices. For more insight into the latest CPI and PCE data for the month of May, refer to last week’s market report.
Consumer Spending Starts To Crater
Consumer spend metrics continue to be mixed with spending generally remaining strong but a pullback starting to be seen in discretionary items. Visa’s Spending Momentum Index (SMI) released for the month of May can be taken to be a proxy of mix between purchasing power and consumer sentiment.
Visa SMI Index (Panther Investment Research)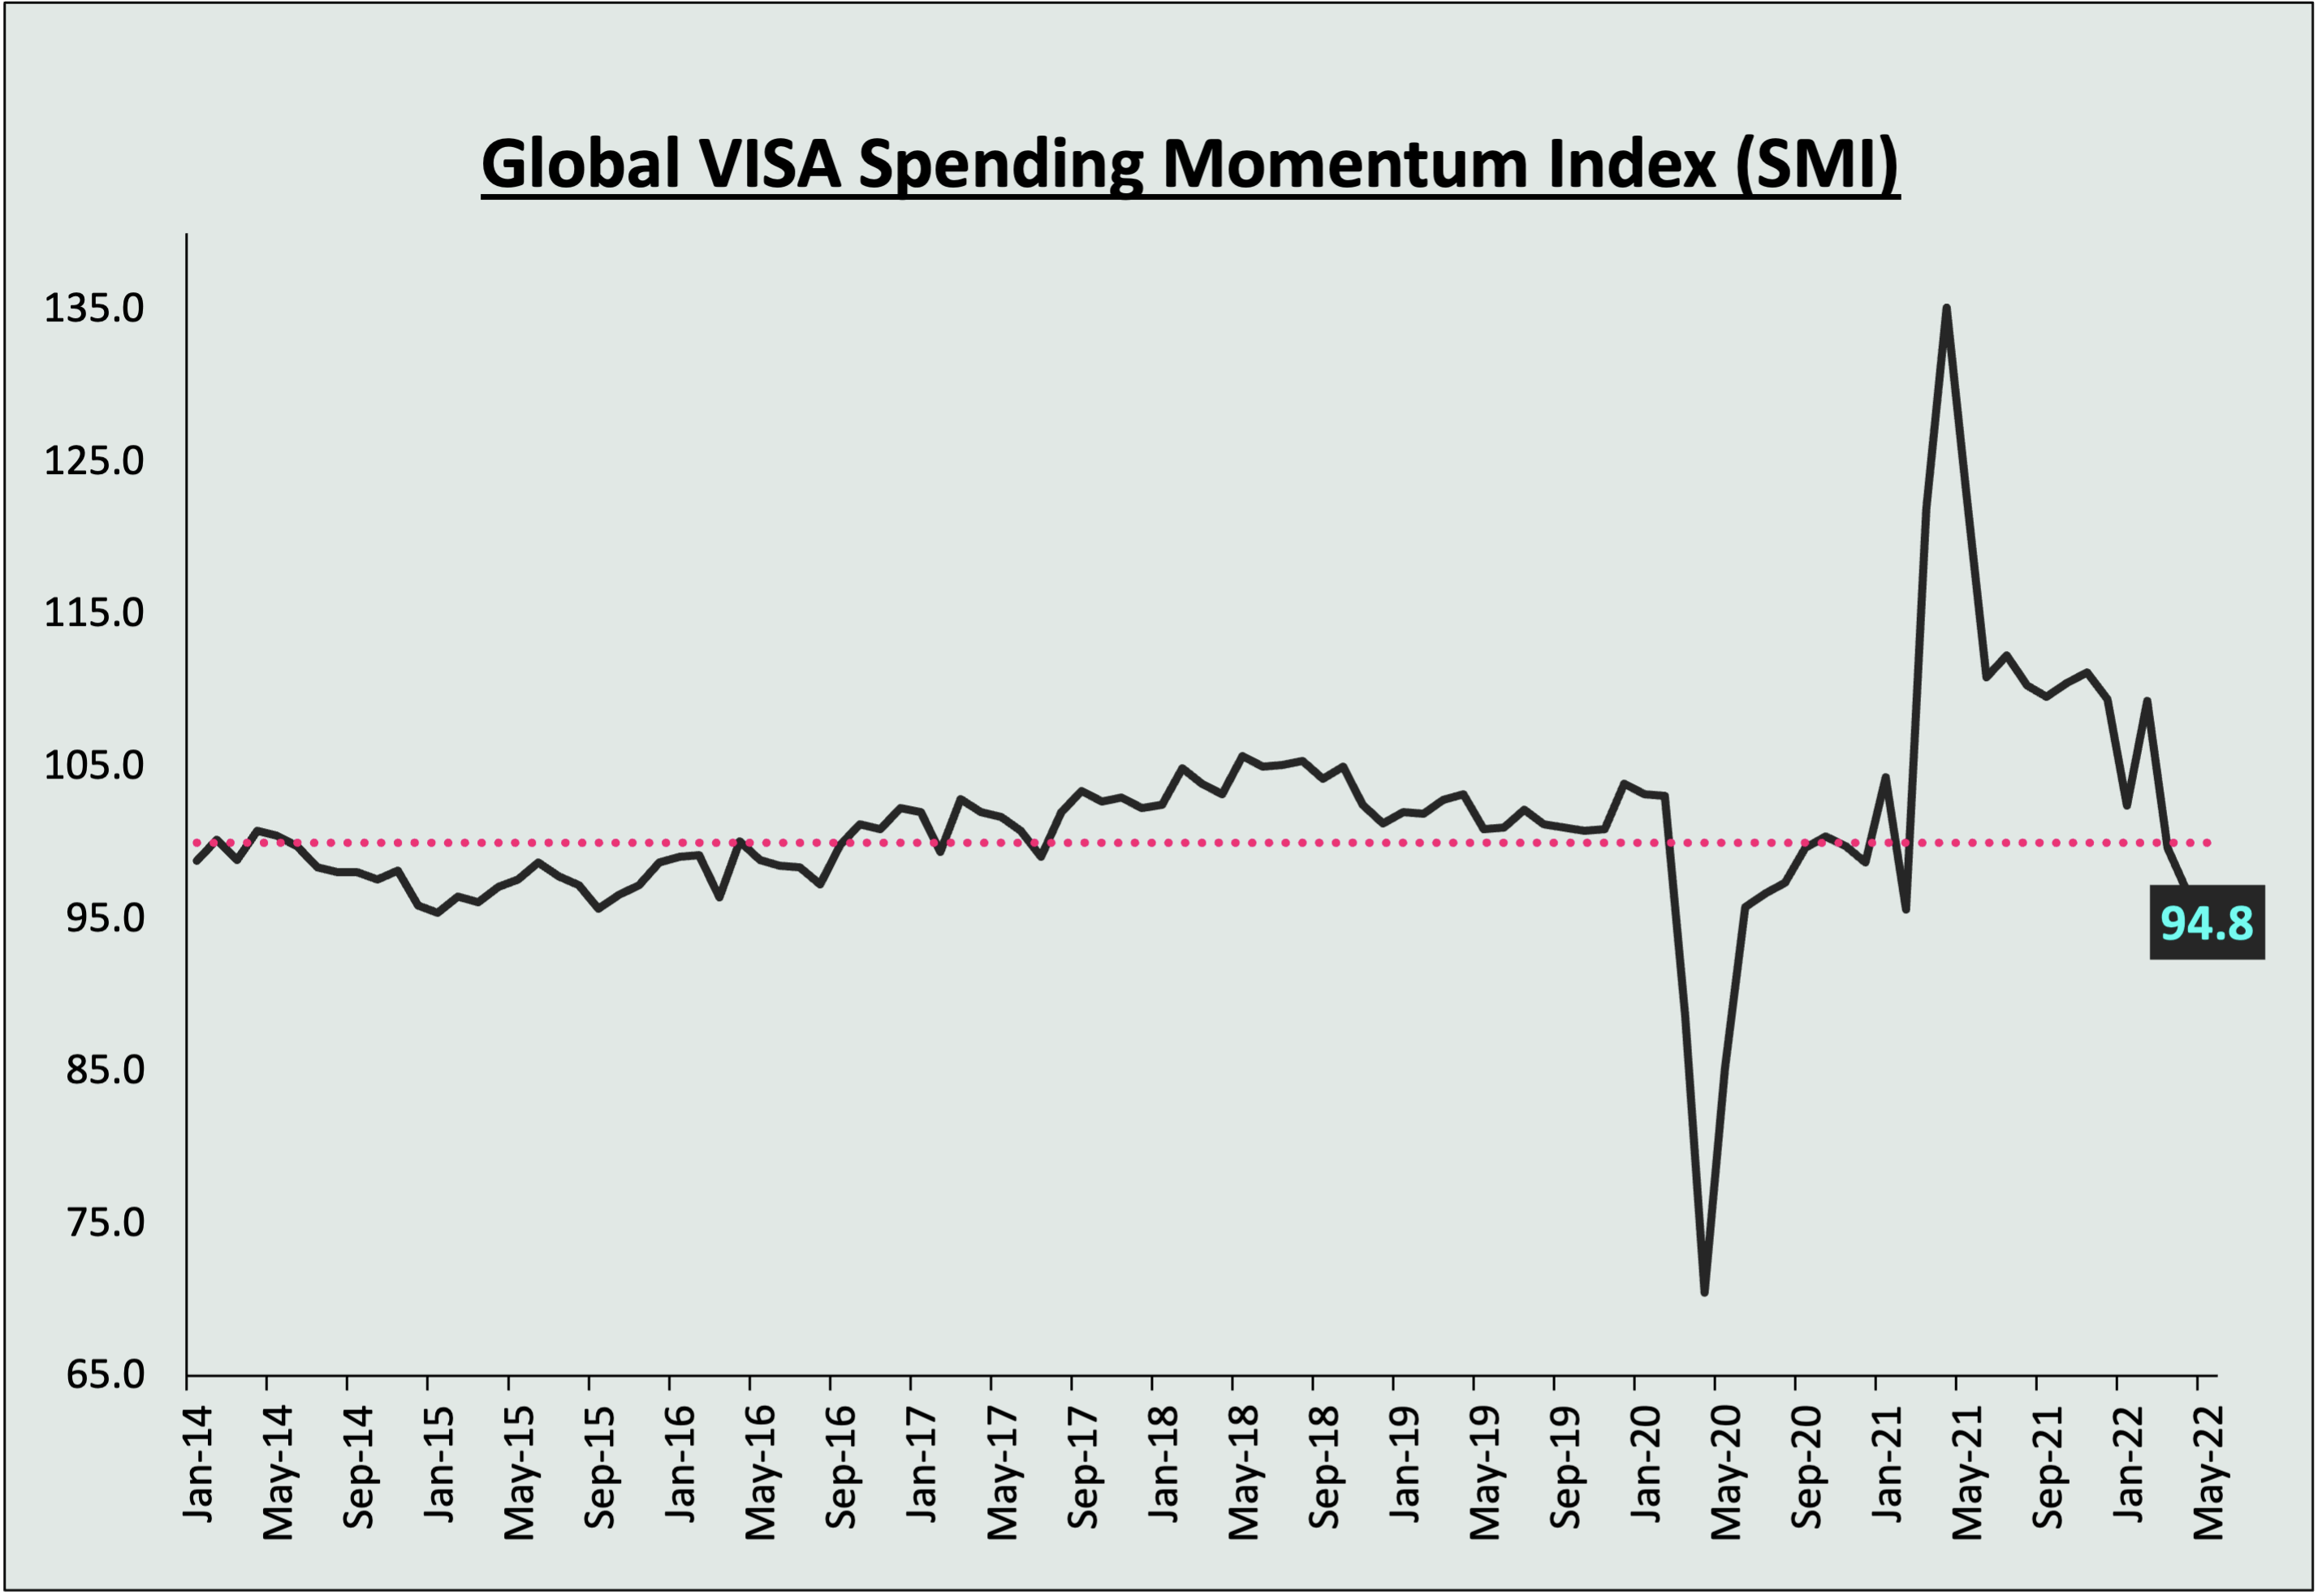
100 is the benchmark. A rise in the SMI above 100 tends to signal that spending momentum is strengthening while a fall below that level, a weakening as consumers cut back from the previous year. May’s reading of 94.8 is a 190bps drop from April’s 96.7 print and also comes in 490bps below March’s 99.7 reading, with the past 3 months posting a YOY drop as sentiment plunges.
MoM US Retail Sales (Bloomberg)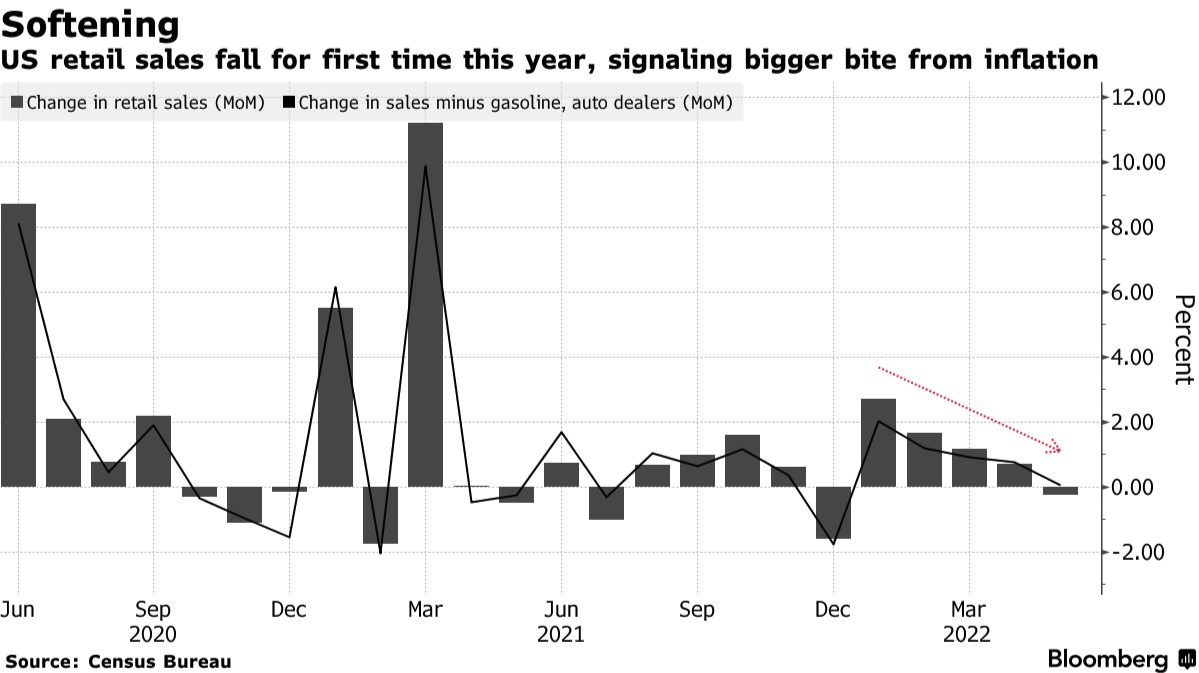
U.S. retail sales have also dropped for the 1st time YTD on a MoM basis, dropping 0.3% in May. Value of purchases fell driven by a clear 3.5% plunge in DD for auto purchases and other big-ticket items. Meantime, spending at gas stations climbed 4%, likely reflecting higher fuel prices in the month. Excluding the volatile categories, retail sales also rose 0.1%, the smallest gain in five months, further proof that consumers are finally succumbing to higher prices from inflation and may start to further feel the effects of higher i/r.
The reduction in retail sales and SMI further corroborates data disclosed last week, with the PSR dropping to record low and household wealth finally compressing for the 1st time in 2 years. The fact that credit card debt is on its way to an ATH may also suggest that consumers are dipping into reserves and debt to finance expenditures and weather the higher prices for now, but as to whether that can last long is a separate matter and a rather unlikely one.
Breakeven Inflation Rate & Greenback
US DXY (TradingView) US10Y (TradingView)

Further uncertainty in the economy has sent inflows into the safe haven greenback once again, with the U.S. dollar posting a new high of $106. Concerns and doubt as to whether the FED can tame runaway inflation has also sent the breakeven inflation rates to an 11Y high close to 3.5%. The current 3.2% signals that the bond markets are likely pricing in mix of 50/75bps for the rest of the 4 scheduled meetings this year.
The Bond Market Flashes Another Warning Sign
US10Y2Y (St Louis Fred)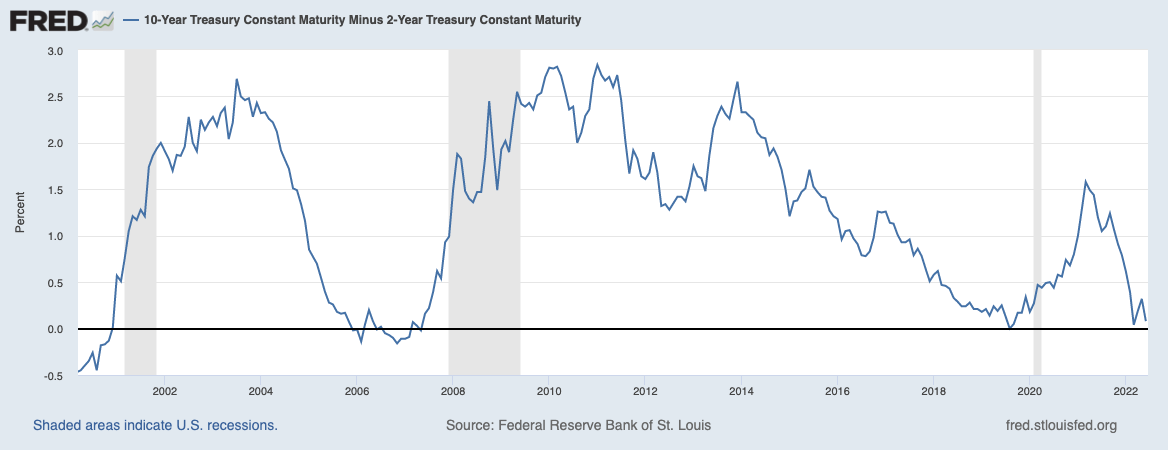
Bracing for Wednesday’s 75bps rate hike, the U.S. bond market also flashed another recession warning. Traders dumped the shorter-term 2Y bonds, sending yields for the 2Y past the 10Y and inverting the yield curve for the 2nd time this year. Typically, payouts increase the further dated the bonds are given that there is more risk that needs to be accounted for till maturity. However, the inversion and flattening curve means that investors continue to expect aggressive rate hikes in the near term and are generally pessimistic about the economy.
Reuters reports that:
The U.S. curve has inverted before each recession since 1955, with a recession following between six and 24 months, according to a 2018 report by researchers at the Federal Reserve Bank of San Francisco.
As economic data still remains relatively stable for now despite the many signs of an inflexion point, it remains to be seen how the bond markets will continue to react to the FED and how the spread between the 2Y and 10Y unfolds.
The Housing Market Faces Serious Headwinds
National Housing Prices (St Louis Fred)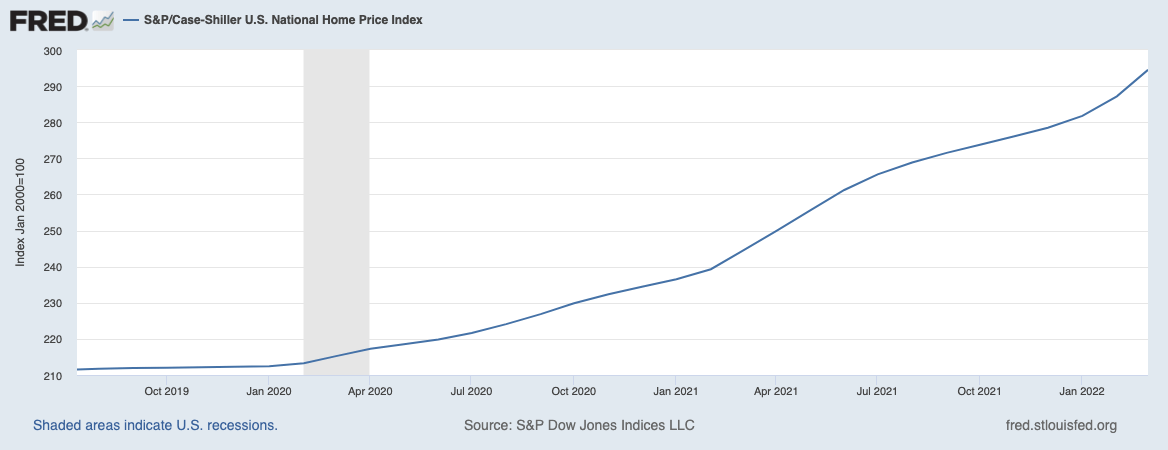
Moving to the real-estate market, the average rate on the 30Y mortgage surges pass 6% to 6.28%, up from the 5.5% observed just last week in response to continued rate hikes. The rising rates, typically taken as a proxy of affordability for housing, have caused a sharp turnaround in the housing market. According to the NAR, home sales have fallen for the past 6 months, and despite the cooling DD and rising rates, little has been done to cool home prices, evident from the chart above.
May US Housing Starts (Bloomberg)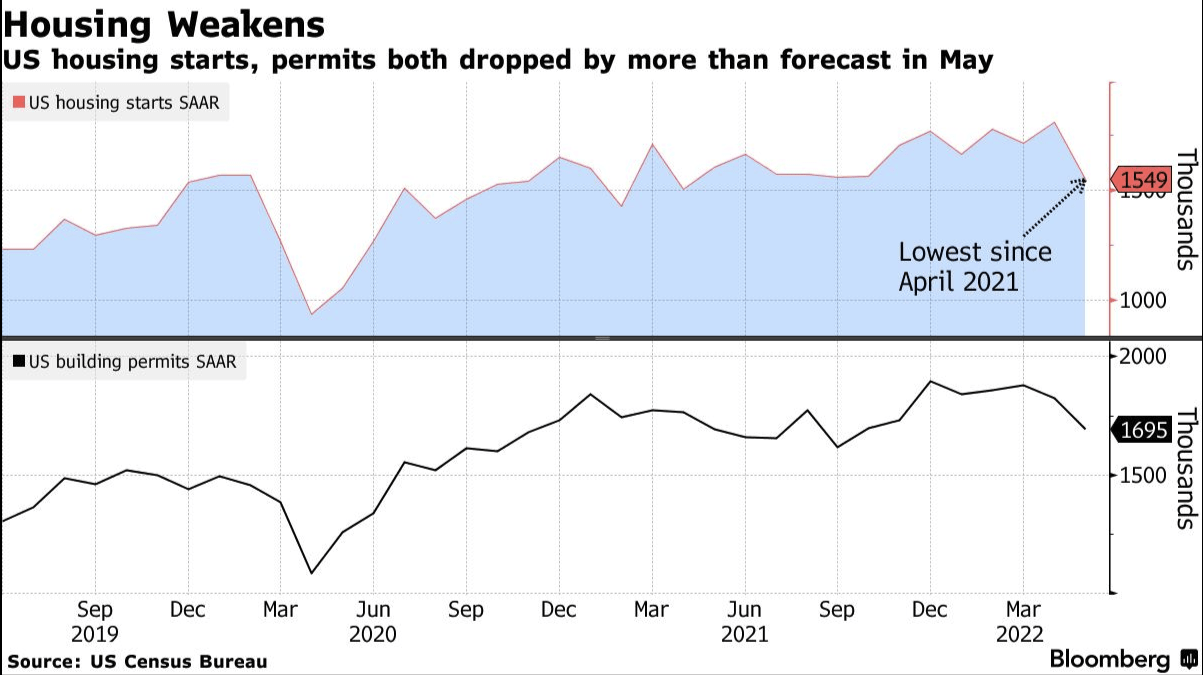
The slowing DD has also dampened confidence within home builders, with the Well’s Fargo HMI falling for the 6th consecutive month. The structural DD and SS side challenges hitting the housing market is further evident as Bloomberg reports U.S. housing starts declining to the lowest level in more than a year.
Crypto Markets
Bitcoin Price Action
BTC Price Action (TradingView) BTC RSI Oversold (TradingView)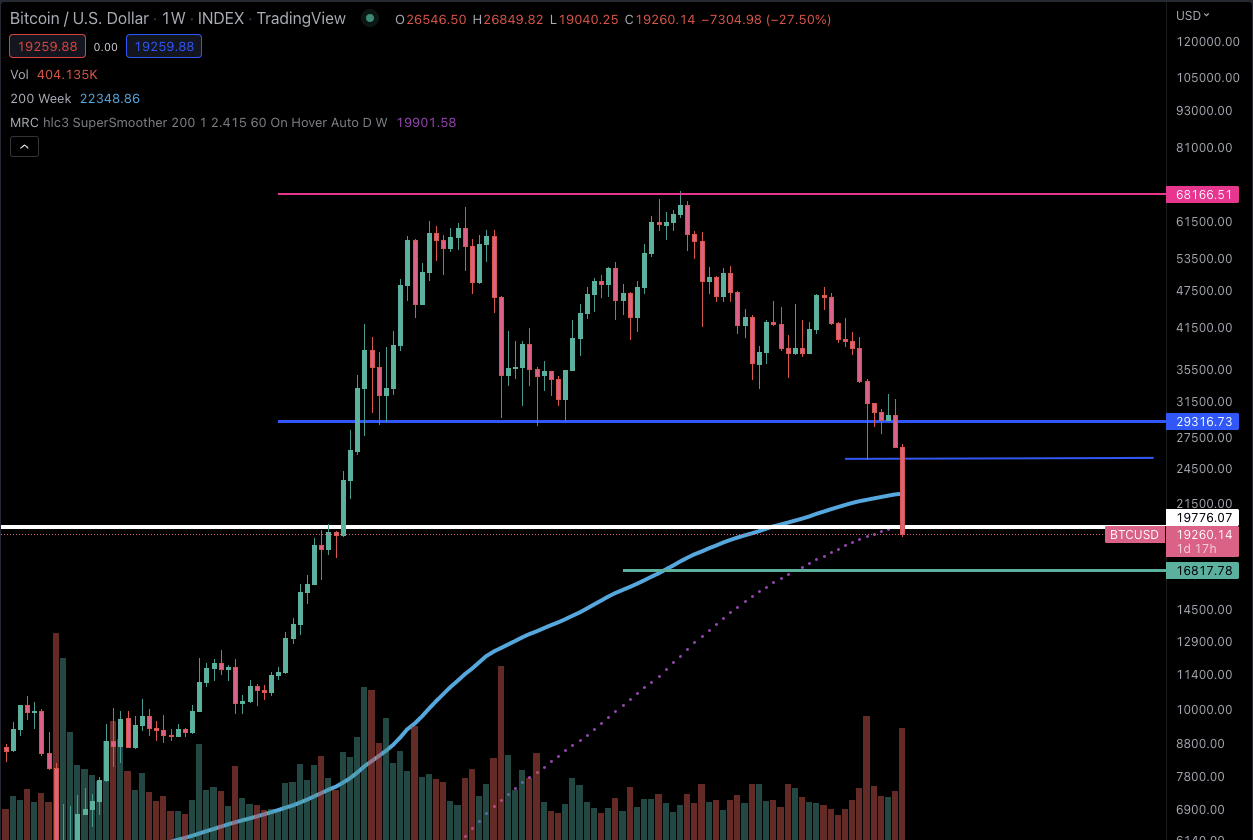
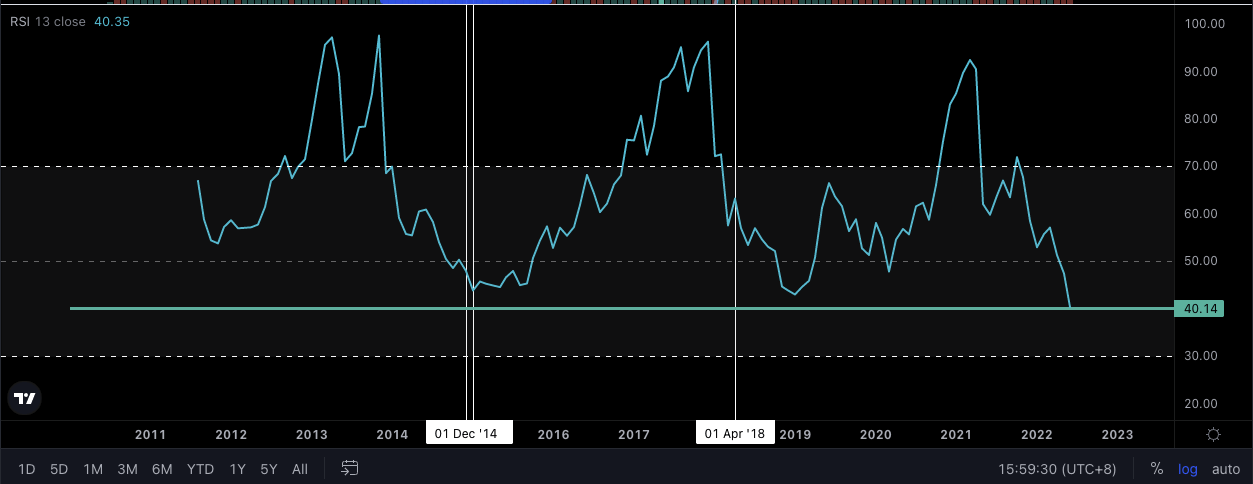
On the crypto front, BTC (BTC-USD) has closed its 11 red weekly candle in the past 12 weeks after breaching the crucial $20K support level for the 1st time this cycle. Despite rallying off the lows, the move upwards is now a rather obvious dead cat bounce. Bitcoin still trades below its 200W SMA which stands at $22.3K and is the most oversold it has ever been since its inception on a monthly timeframe. I still anticipate more downside and am looking to the $16K region for some support and signs a new low. Regardless, the risk to reward now vs 6 months back with a 3-5Y time horizon is already remarkable so long crypto stays. It will in my view.
Ethereum Price Action
ETH Price Action (TradingView)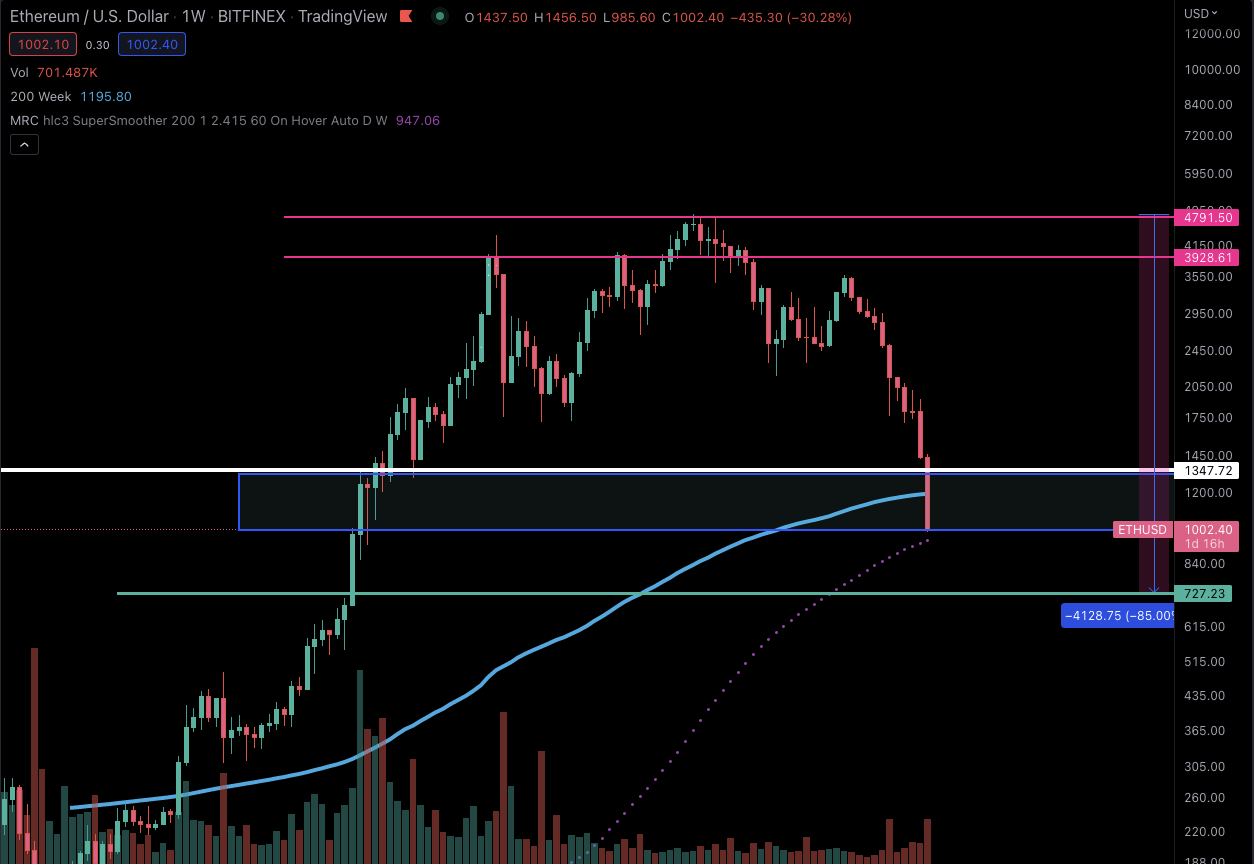
In typical crypto bear market fashion, altcoins continue to underperform with Ethereum (ETH-USD) having printed 11 consecutive red weekly candles, the 1st time in its history. ETH currently trades below its 200W SMA which stands at $1195. ETH also lost the 1K support level, a critical level from a psychological perspective. The token has since rebounded back past $1000 but the rebound looks weak and things could get ugly before they get better. I’ve filled 1/5th of my allocated ETH position as per my last market report, and the remaining entries are set to be filled within $700-$950. I’m looking to the $700 region for some support and signs a new low, but of course, no one can time the bottom and in any case, I’m more than happy to sit on a full position so long my cost basis is in the three digits.
China Markets
In my last report, I mentioned that:
China still remains the preferred market within APAC.
That remains true to this day for various reasons. China’s economic numbers have come in better than expected. Retail sales fell 6.7% YOY, down from the 11.1% recorded in April and the -7.1% estimate. Industrial production also increased mildly by 0.7% YOY in May, better than the -2.9% in April and the -0.7% estimate. The Chinese and U.S. markets still look to have decoupled and China is in a position similar to where the U.S. was at the start of QE, absent the large liquidity recklessly injected by the FED.
US and China Decouple (BNP Paribas)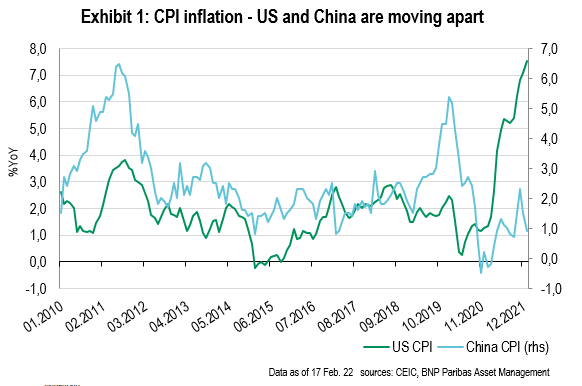
China has lowered the 5Y loan prime rate which functions as a reference for home mortgages. The 15bps cut also came in more than expected and larger than what is typically practiced (5-10bps cut). The low CPI inflation numbers on the side of China also stands in stark contrast to the 8.6% inflation numbers observed in the U.S. From a policy perspective, the QE and monetary easing in China will also act as a tailwind to further prop up the beaten down stock market.
HSTECH & NDQ Decouple (TradingView) HSTECH Rallies (TradingView)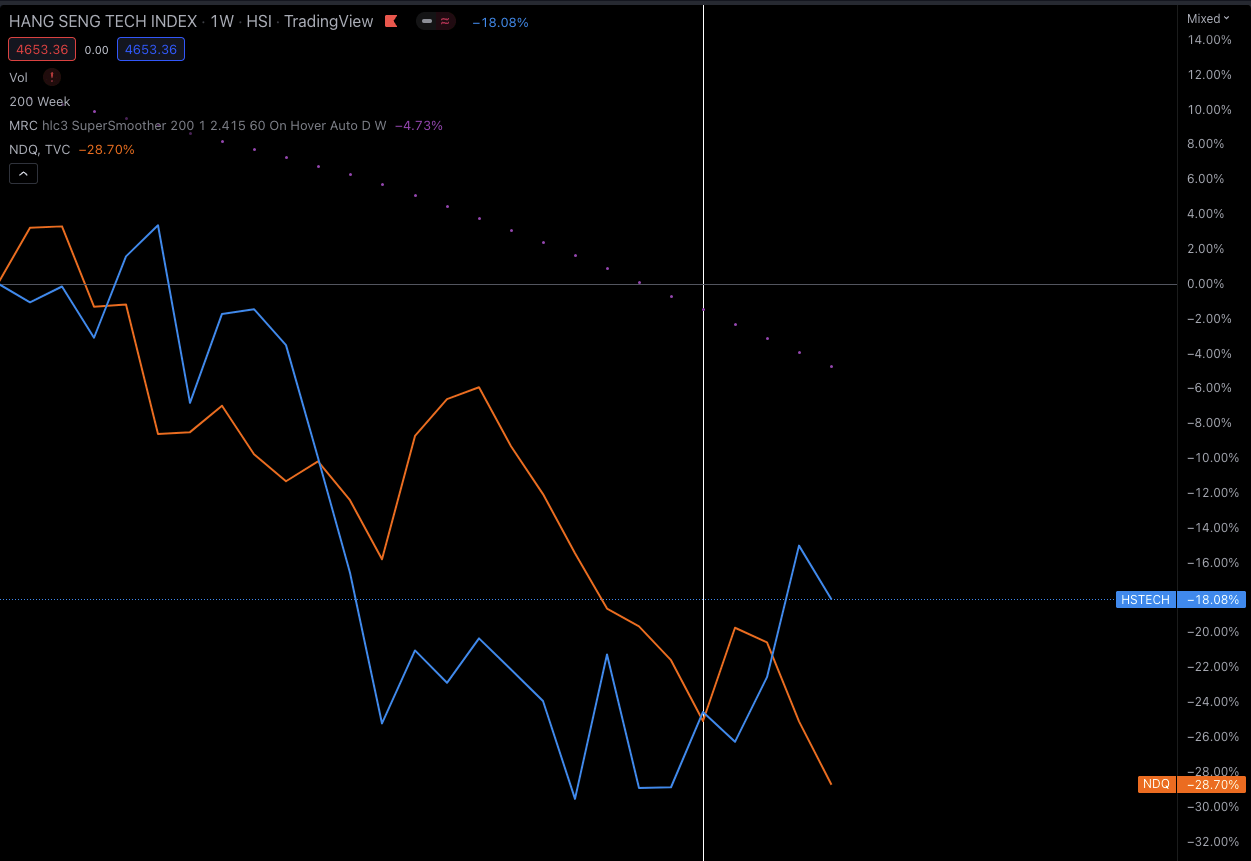

In last week’s report, I also mentioned that:
This breakout in the HSTECH also marks the 1st time that the index’s negative sentiments have decoupled from the NDQ, and now outperforms the NDQ YTD with a close to 14% delta.
That still remains true to this day. U.S. markets across all indexes ended down close to 5%. The HSTECH closed the week green and furthers its decoupling attributable in the chart above, with the delta has widening. Off the lows, the HSTECH is up close to 35%. Make no mistake, I still maintain that China is party 1st, business 2nd and hence my exposure is typically capped at 10% overall AUMs dedicated to equities. But the current market dynamics seem different, and China markets seem to be the U.S. markets of 2020 and a laggard. As a result, I’m making an exception and increasing my exposure to China.
Upcoming Week Outlook
Looking to the coming week, not many key events are scheduled except for the following:
- Existing Home Sale for May (Tuesday)
- Initial Jobless Claims (Thursday)
- UMich Consumer Sentiment (Friday)
Once again, I maintain that in times of such, investors should cautiously navigate the uncertainty by keeping cash on the sidelines, dollar cost averaging where it makes sense, and reconsolidating the portfolio towards the highest conviction names. The current situation may be bleak, but play the long game and you’ll emerge the winner.
Till next time!
Be the first to comment