

GarysFRP
A recession does not begin (according to the National Bureau of Economic Research) until companies begin to lay off workers and unemployment rises substantially, in addition to two consecutive quarters of economic contraction (as well as a few other less crucial factors).
Corporate executives do not want to be the first to downsize their respective workforces for fear of being called crazy (something of which I have ample experience) when the economy still exhibits signs of strength. But nobody wants to be the last to make that decision either, for fear of being called idiots for not seeing the signs and acting in a timelier manner.
Headline unemployment hit a near record low, at 3.5%, in the June Employment Situation Summary report from the Bureau of Labor Statistics. This usually happens just before a recession. There is a saying that it is always darkest before dawn. The opposite is true with the economy: it always seems brightest before a recession.
And The Survey Says
A new survey from consultancy PwC released this month showed 50% of companies are planning to reduce overall headcount, 52% are considering a hiring freeze, 46% of companies said they are dropping or reducing signing bonuses, and 44% are rescinding offers (Hat tip to Miles Udland of Yahoo! Finance for bringing this to my attention). If 50% of companies plan layoffs, employment is likely to stop growing and begin contracting soon.
But all the worker reductions will not be in the U.S. Europe is entering a recession also, primarily due to the rising cost of energy. Russian has shut down natural gas flowing to Europe through the Nord Stream 1 pipeline again. European countries are taking major steps to prepare for winter with not enough gas to keep homes heated and industries operating full time. The UK just logged an inflation rate of 10.1% and expects inflation to continue to be high for at least the next year or longer.
China’s economy is slowing also, so some of those layoffs could occur in Asia, as well. But slowing economies across the globe will mean reduced exports, especially with a strong U.S. dollar making our goods more expensive outside the U.S. Speaking of which…
U.S. Manufacturing Falling into Recession
Many of the following graphics are from The Daily Shot. They send me an email each weekday with economic analysis in visual form that has come out from all over the world. I am not sure how I would keep up without it. These charts are a small sampling of what I was able to glean over the course of a week and represent only a tiny fraction of the total picture. But it tells a story better in images than I could in words.
The first Fed (Federal Reserve Bank of the U.S.) regional report comes from New York. The Empire State manufacturing index indicates that the condition of manufacturing is worsening more than expected. This was a big negative surprise.
Daily Shot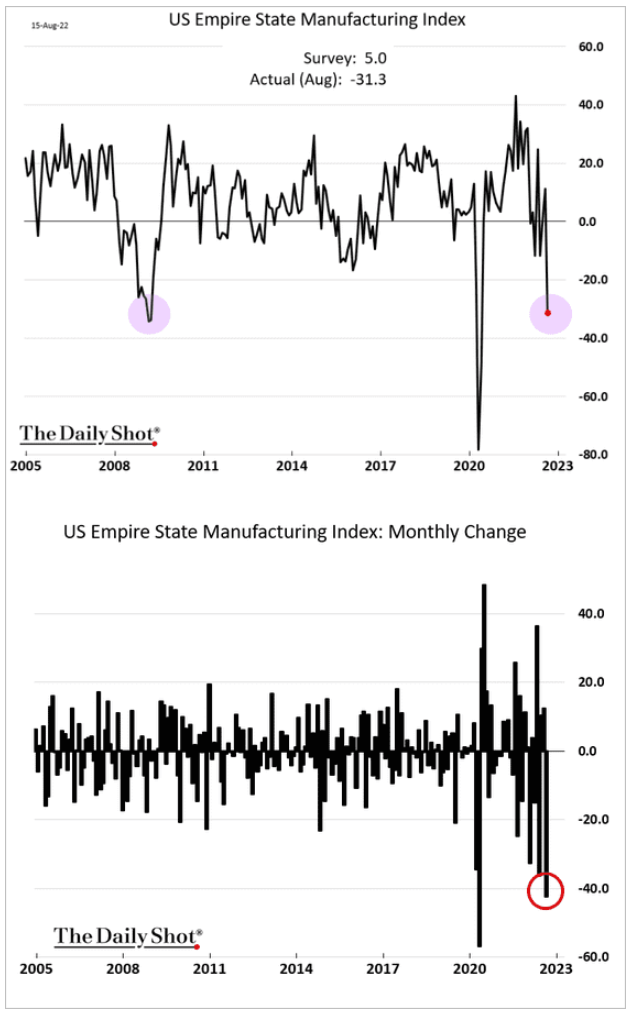
New orders are down substantially.
Daily Shot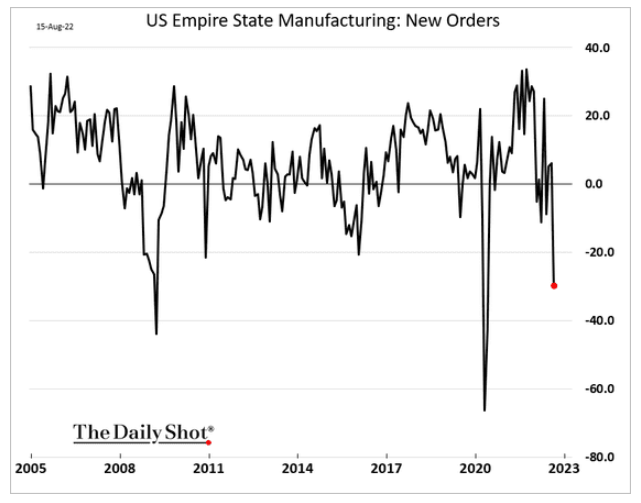
The next two charts adjust the ISM (Institute for Supply Management) Report to include the latest Empire State data and suggest that the manufacturing sector is in a recession.
Daily Shot Daily Shot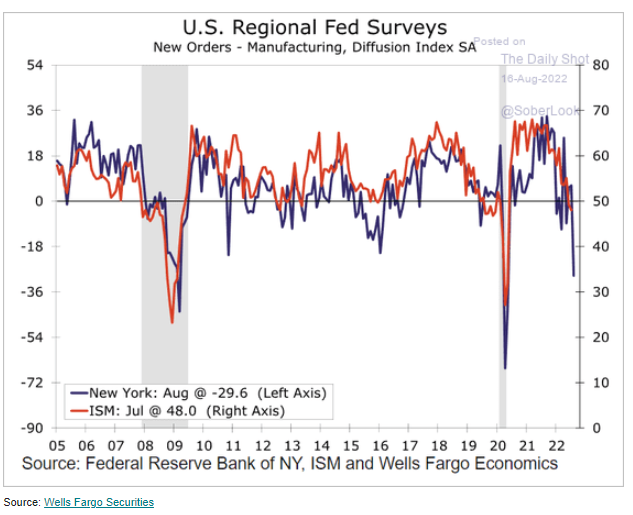
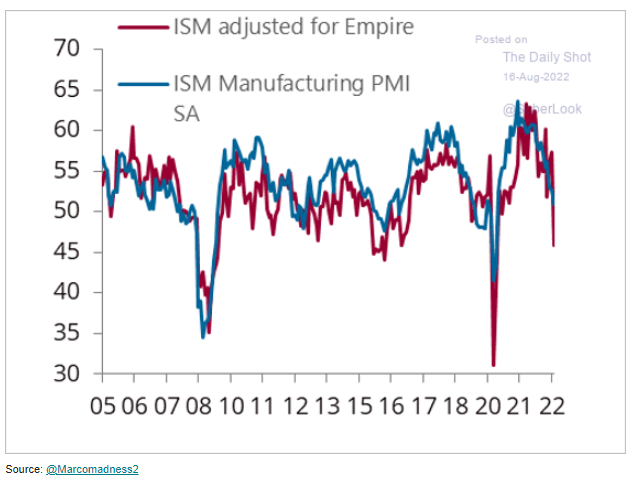
Anything reading below 50 indicates contraction. With the global economy slowing and the U.S. dollar continuing to advance against the euro, it will only get worse.
On the slightly brighter side, the Philadelphia Fed manufacturing index surprised to the upside from negative levels, but new orders remain depressing.
Daily Shot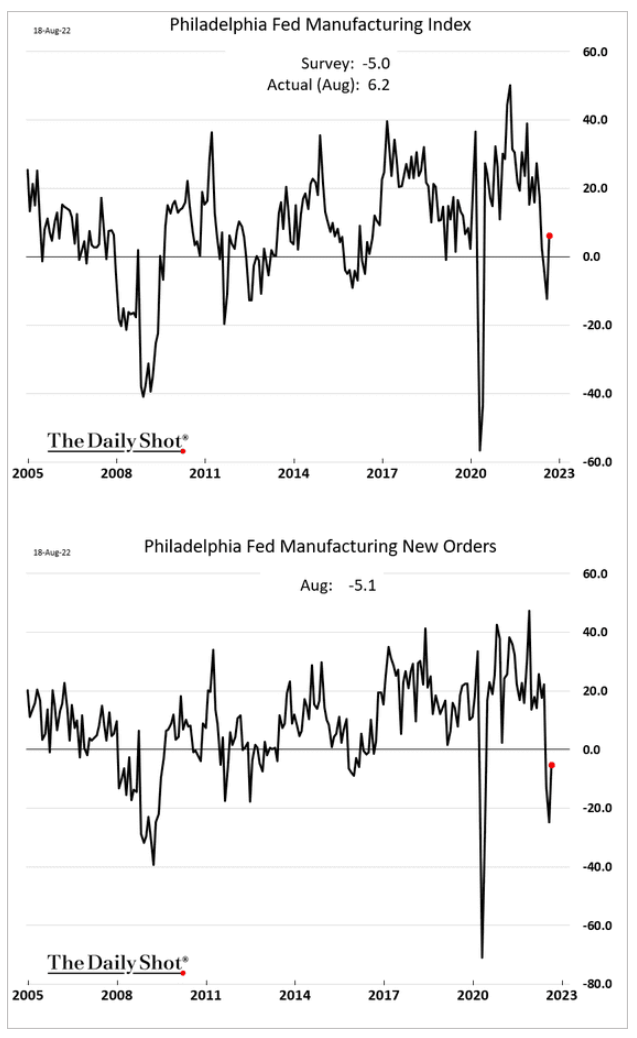
And if you look deeper into the report, you find that expected new orders are still in contractionary territory.
Daily Shot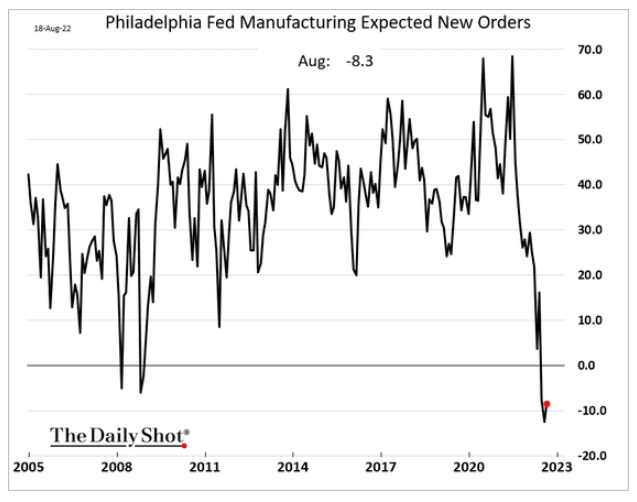
This does not bode well for corporate earnings in future quarters.
Daily Shot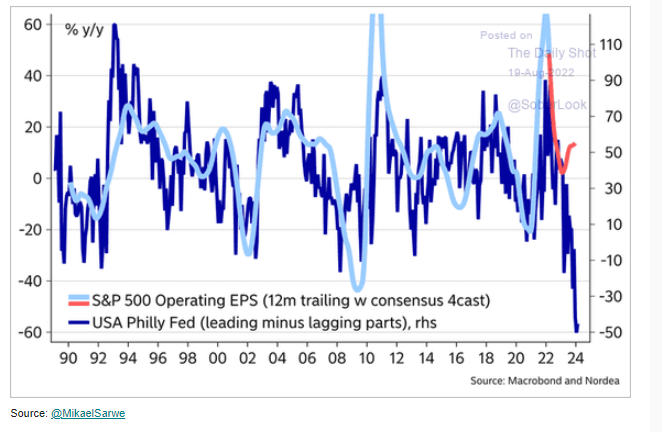
Overall, the indication is that the manufacturing sector is either in recession or heading toward it. But manufacturing is only one sector of the economy.
Real Estate Sector Slowing
U.S. mortgage payments, as a percentage of income, are higher than at the top of the subprime bubble. Housing affordability is becoming a huge problem and rents are rising at an unsustainable pace.
Michael A. Arouet via Twitter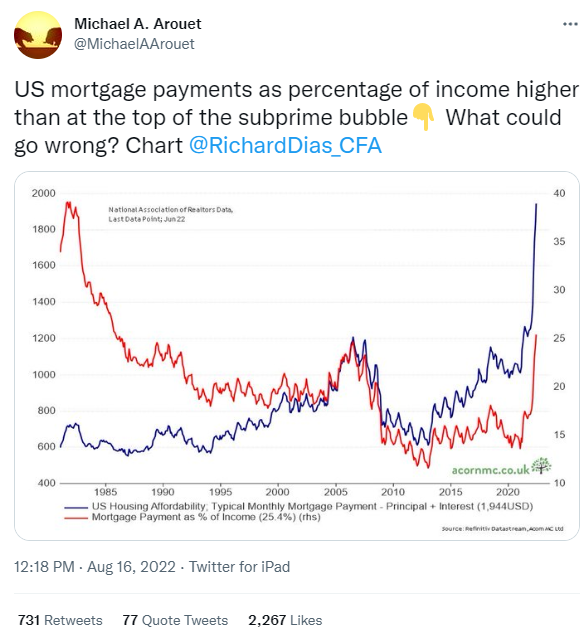
This housing expansion is getting long in the tooth compared to history (excluding the run up to the 2007 financial crisis).
Daily Shot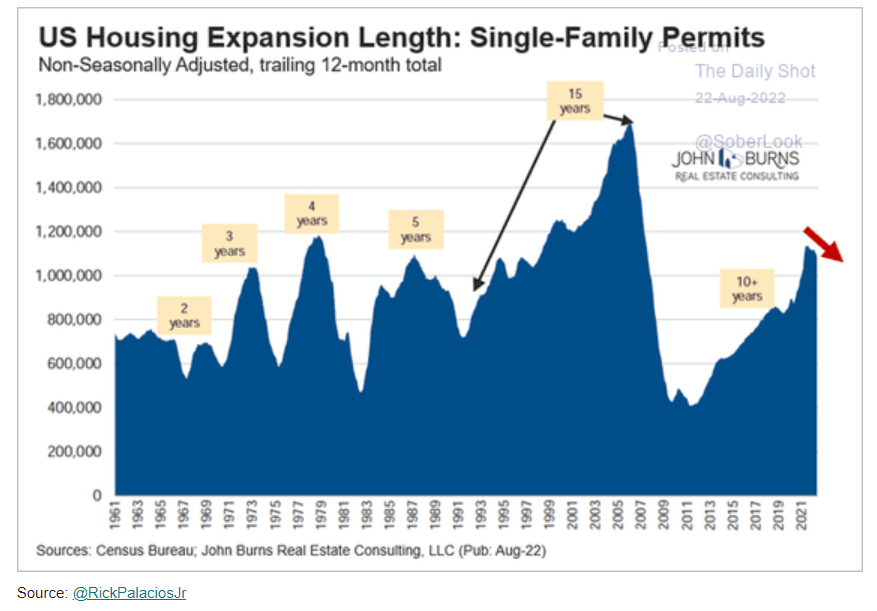
As you can see from the charts above; we are back to the levels of 2007. The national average mortgage is now $1,944 per month. The rate of rising home prices has slowed but is still heading higher, adding to the affordability problem.
Daily Shot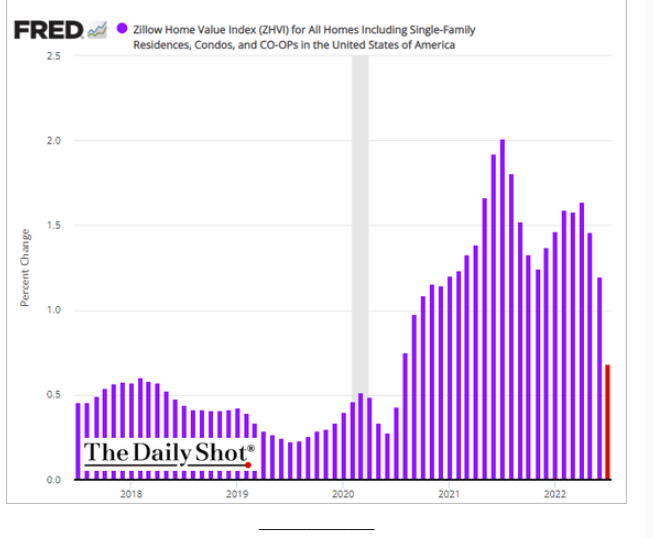
As a result, home sales are falling.
Daily Shot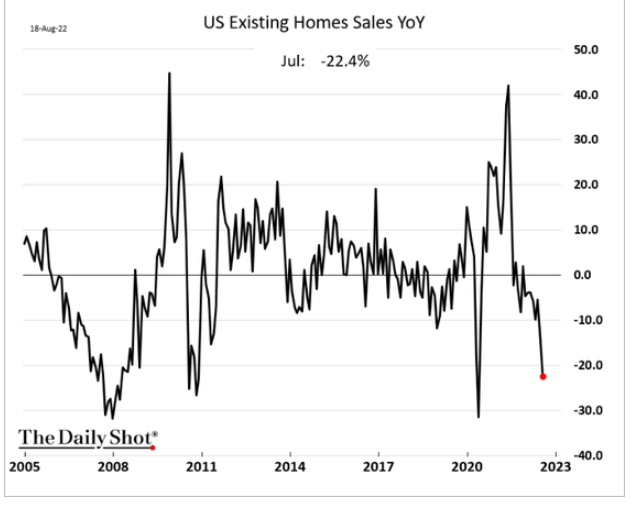
Home Builders are reducing prices.
Daily Shot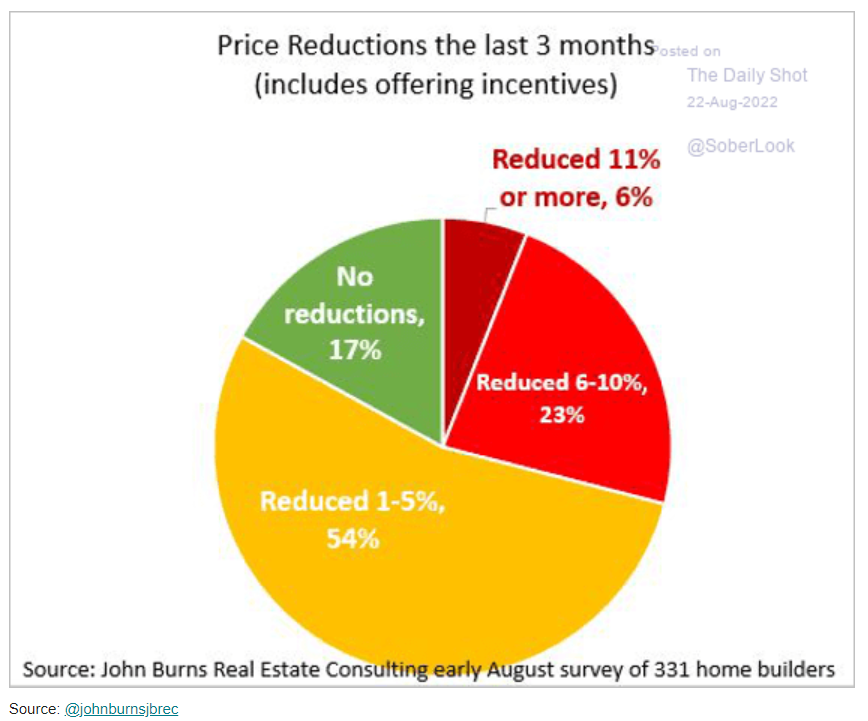
Both housing starts and new permits issued are dropping.
Daily Shot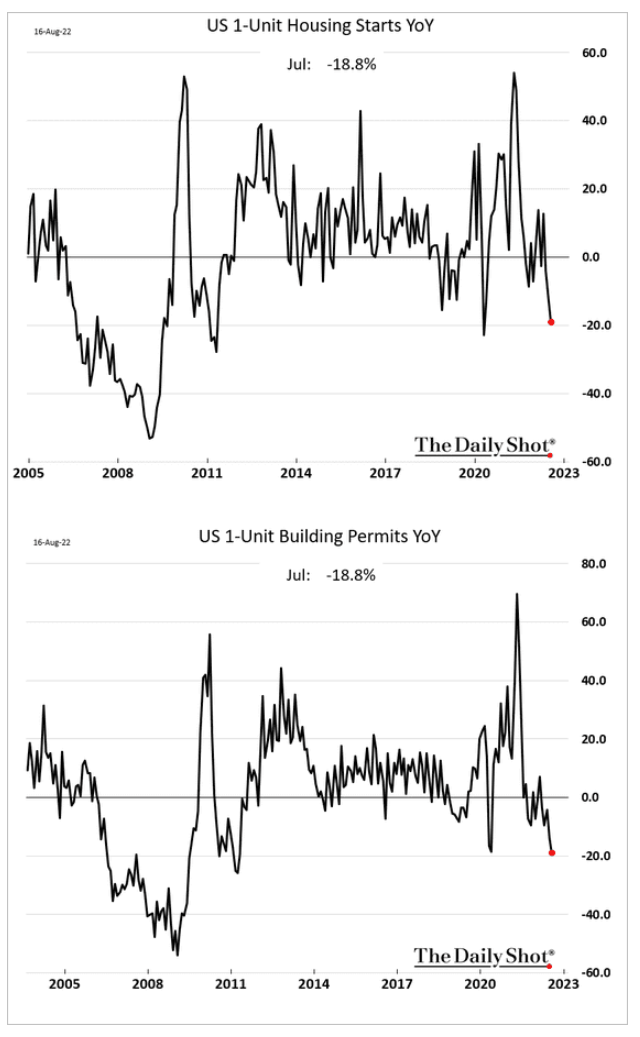
Rent inflation continues to put upward pressure on core CPI.
Bank of America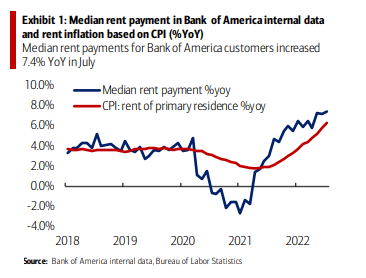
The picture in housing is not inspiring much hope that we will be able to avoid a recession. It tells me that inflation will continue to hold above 4% for most of next year or until rent increases ease below that level. Rent and owner equivalent rent make up nearly 40% of CPI.
Another thing to keep in mind is that the health of our housing industry affect retail sales.
Daily Shot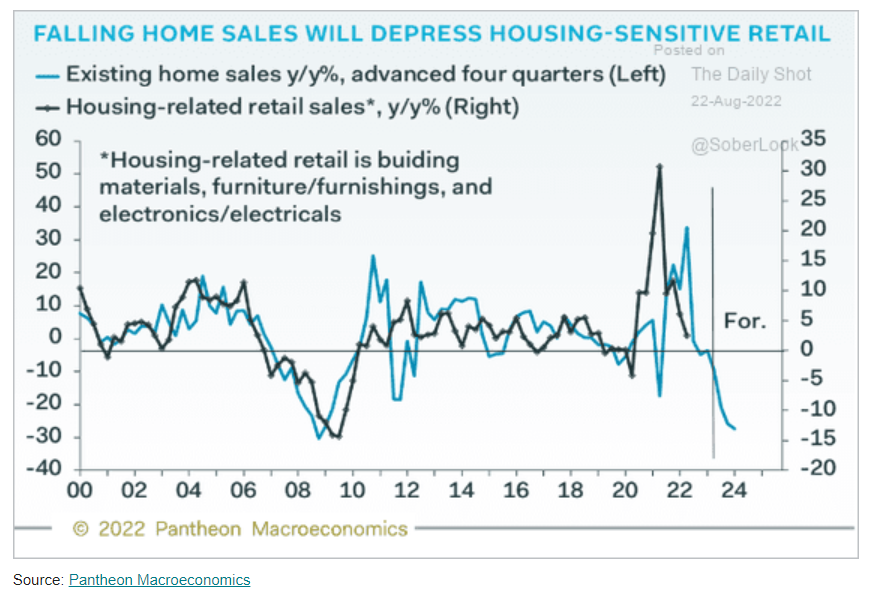
Rising Retail Sales are Misleading
Which leads us to the most important leg holding up the U.S. economy; consumer spending (loosely referred to as retail sales) accounts for about 66% of the economy. Retail sales reports tell us that sales are growing at a healthy pace, but the reality is something different. When adjusted for inflation, retail sales are flat recently and down since January 2021.
Daily Shot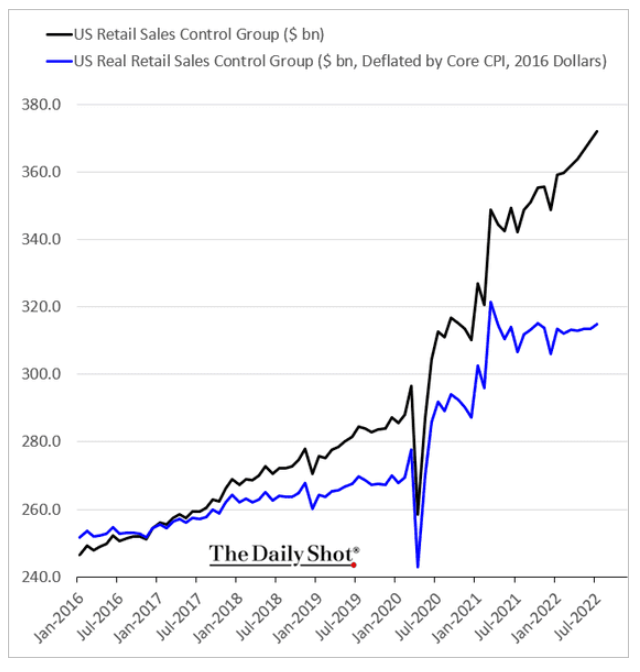
People are spending more money for less goods and services. That is not a sign of a healthy, growing economy. It is a sign of a sputtering economy.
As further evidence, there are signs that American households are becoming more financially distressed.
Daily Shot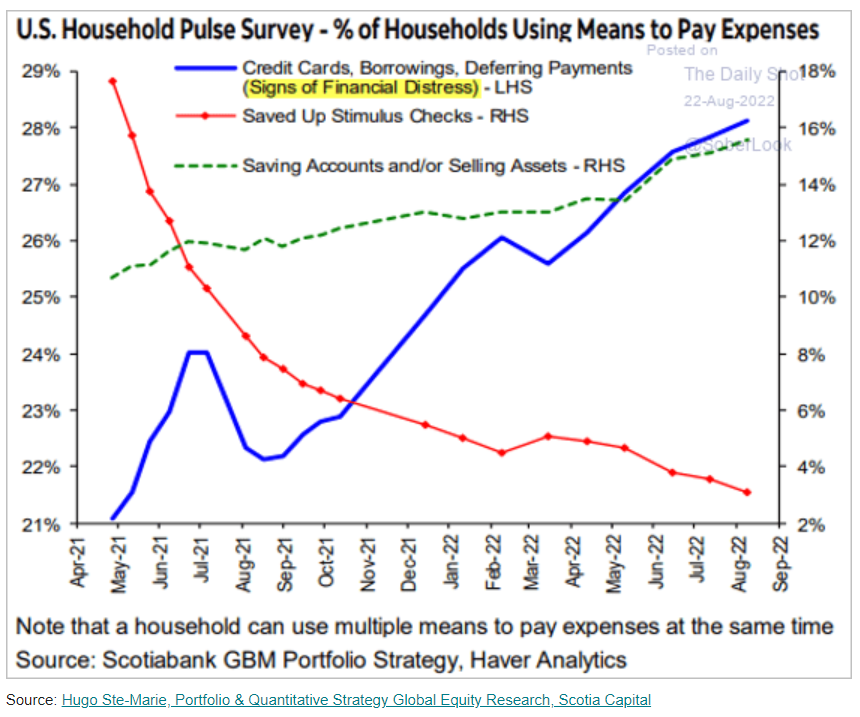
The wealthy and upper middle class are in decent shape financially, but everyone else is running into trouble. Stimulus checks savings are disappearing, people are dipping into savings accounts and credit card balances are rising. These are all signs that many households will need to trim spending soon.
Treasury Yield Curve Predicts a Recession
In every instance since the 1970s, whenever more than 50% of the yield curve becomes inverted, the U.S. economy entered a recession following that event. It can take 6 months or two years before the recession begins, but the chart below says it is coming.
FXE Evolution via Twitter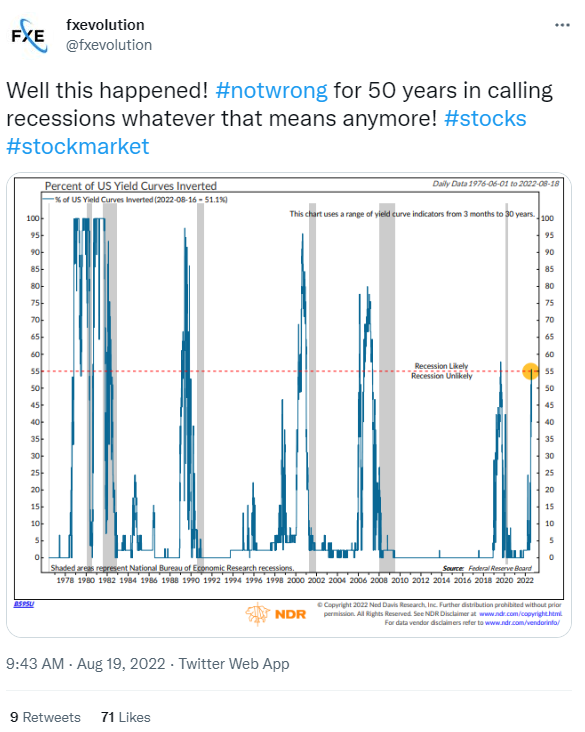
The table below shows treasury yields by maturity. Notice that the 6-month, 12-month, 2-year and 5-year yields are all above the 10-year yield. Last week the 12-month yield temporarily rose above the 30-year yield.
Bloomberg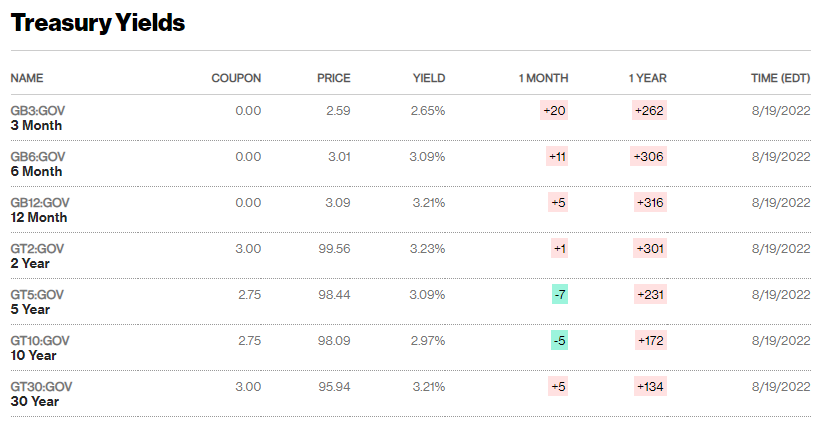
I prefer to take my cues from the bond market over stocks because bond traders rely on data and good analysis and the market for bonds is about twice the size of the stock market. Also, stocks tend to be driven by emotions over the short term, often with no real logic to support major moves; only justifications.
What the bond market is telling us is that the good times are about to end and that the economy is about to contract (again), whether NBER (National Bureau of Economic Research) is willing to admit it or not. NBER is the organization within the administration that makes the official determinations regarding whether the economy is in recession or not. Historically, it has made the official announcements of the start of most recessions after they are over. So, I now expect that NBER will not announce a recession this time around until sometime in 2024, certainly not before the end of 2023.
The Fed likes to take its cues from the labor market when assessing inflationary pressures. Currently, the labor conditions are tight and continue to put upward pressure on wages which, in turn, puts pressure on Inflation.
Daily Shot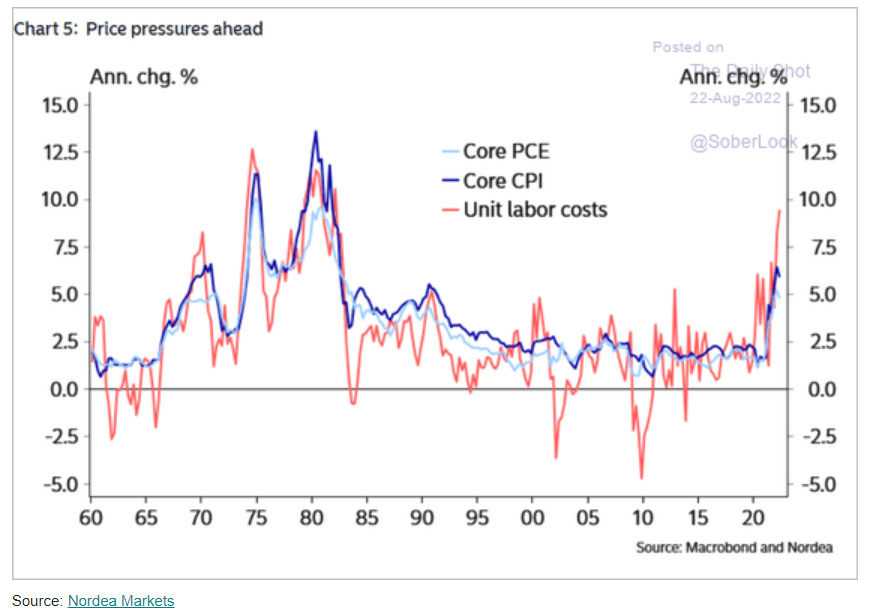
There is a huge disconnect between market expectations and Fed Policy indications which has, until Friday, been keeping stocks rallying.
Daily Shot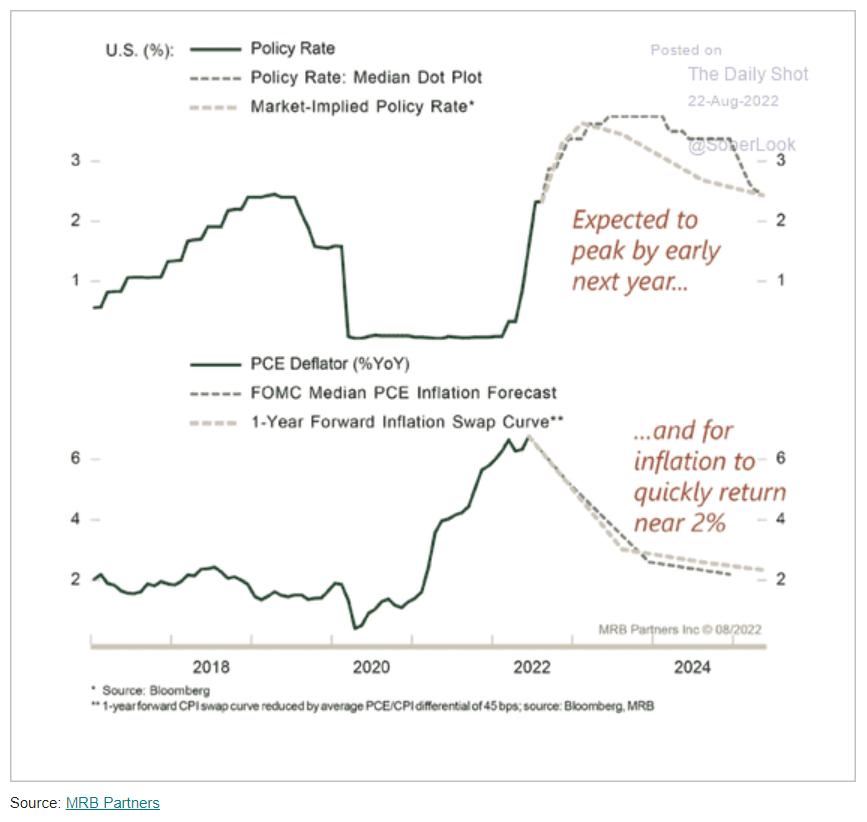
The Fed governors keep telling us that they do not want to begin lowering rates until they have convincing evidence that PCE inflation is falling to 2% . Investors are realizing that the FOMC (Federal Open Market Committee) is serious about continuing to raise rates and keep them elevated until inflation is under control; in case you were wondering why the markets have been falling so hard lately.
Of course, quotes like the one below from Jamie Dimon, CEO of JPMorgan Chase, during a conference call with major clients recently did not help the confidence of bullish traders.
“If I had to put odds: soft landing 10%. Harder landing, mild recession, 20%, 30%. Harder recession, 20%, 30%. And maybe something worse at 20% to 30%. It is a bad mistake to say ‘here is my single point forecast.”
If you look closely, he says that we have only a 10% probability of avoiding a recession. That means that he believes we have a 90% chance of having a recession. I agree.
The Buffett indicator is more relevant today than it has been for some time. The argument against it has been that most of the large U.S. multinational corporations derive as much as 50% of their respective revenues from foreign markets. Today, there is nowhere in the world to hide from inflation and a slowing economy. Even China is struggling with its housing market, among other problems. The U.S. economy is among the strongest in the world now. So, either way you want to look at it, either with the Wilshire 5000 Index vs GDP (Gross Domestic Product) or the S&P 500 vs GDP, the market still looks overvalued.
Longtrends.net Longtrends.net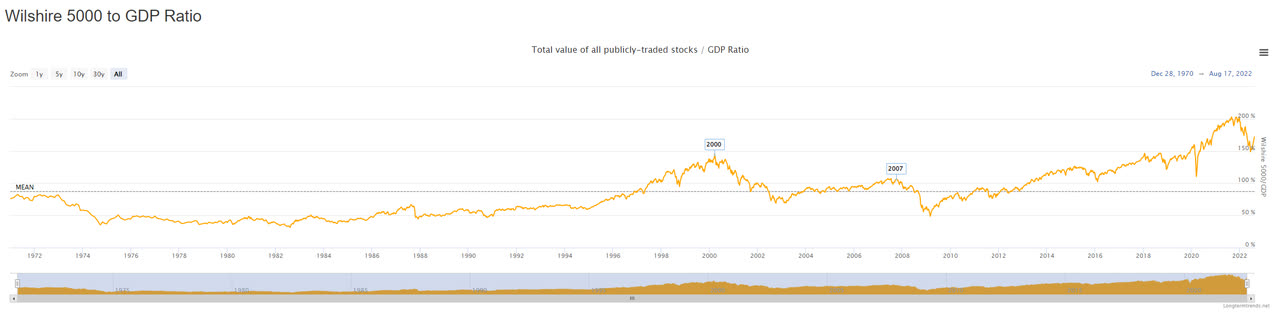
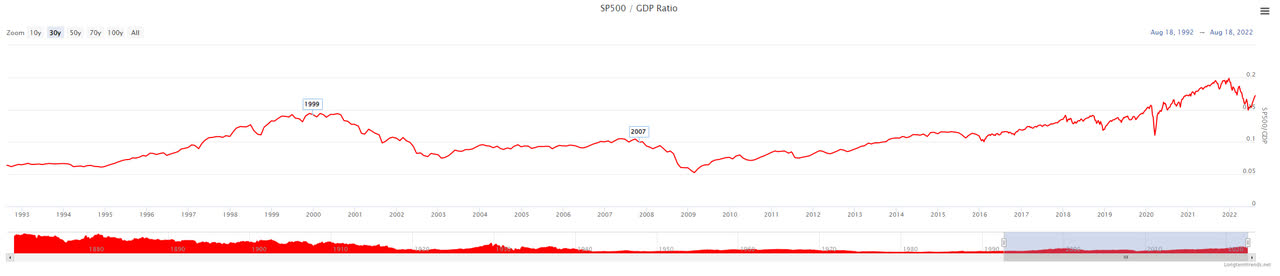
Notice that in either case today’s valuation is well above the levels of both 2000 and 2007, even after the recent bear market drop and partial rebound. The old argument supporting higher multiples does not hold water today either. It held that with inflation and interest rates also at multi-decade lows, higher multiples were justified because the cost of capital was lower and there was no other investment vehicle that could provide the same risk/reward profile. Well, today we see that inflation is at multi-decade highs and interest rates are rising. That old justification does not apply to the current environment.
As far as expectations that the Fed will pivot from hawkish to dovish early next year, investors have refused (until lately) to listen to what members of the FMOC (Federal Market Open Committee) are saying. St. Louis Fed President, James Bullard, leans toward another .75% interest rate hike in September.
Odd and Ends
Consumer sentiment has resumed its downward trend.
Daily Shot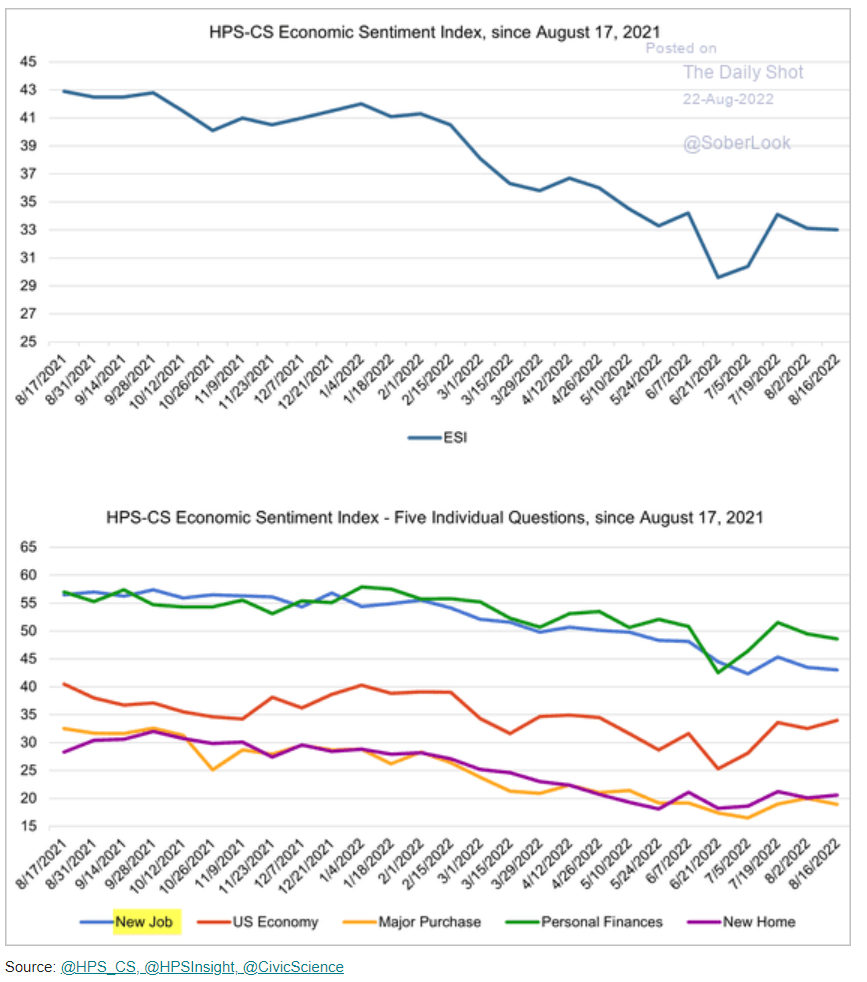
CEO confidence is falling. Once it drops much below 5 on the chart below, watch out below. CEOs tend to believe in themselves and can turn expectations of a recession into the real thing by making preparations such as reducing investments and labor.
Daily Shot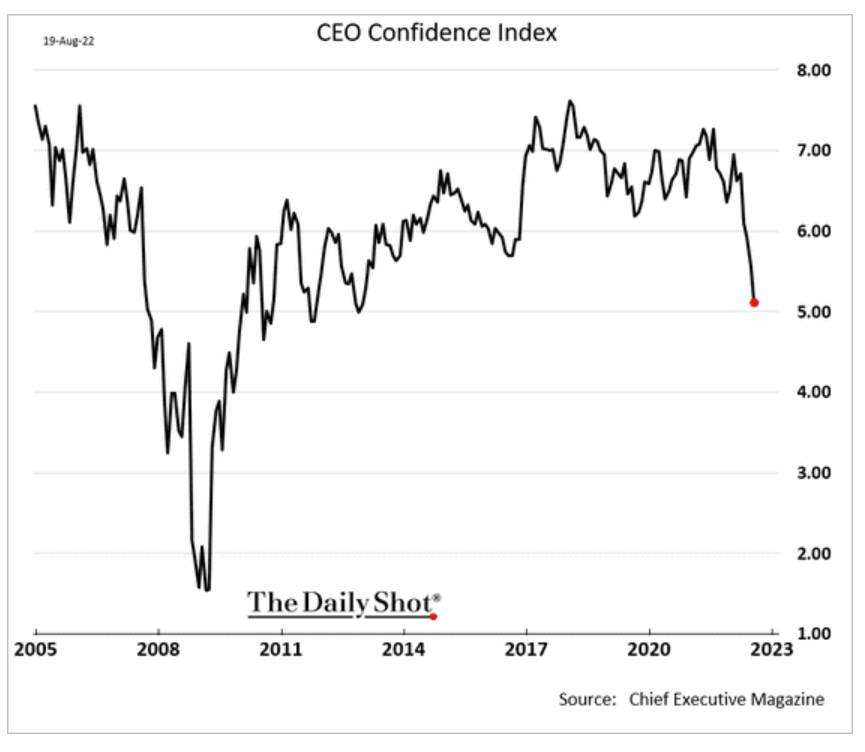
Their main concern continues to be labor constraints, followed closely by inflation, recession, and supply chain disruptions.
Daily Shot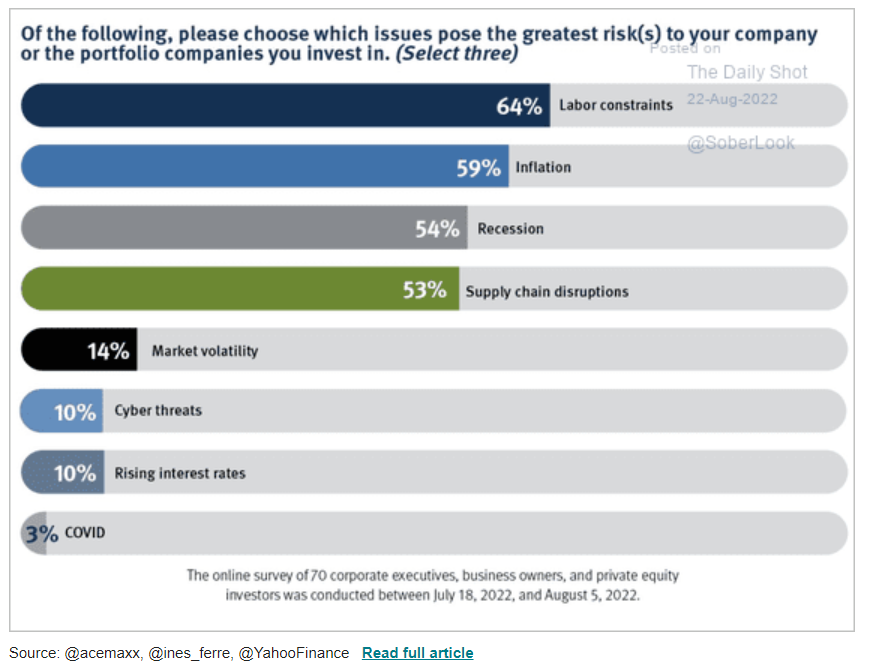
They will need to choose their fear because labor constraints and recession do not make sense in the same sentence. I expect recession will win out at some point in the near future.
Finally, below is a chart which shows that the S&P 500 Index bumped up against its 200-day moving average (resistance) before resuming the bear market drop with another leg down.
Yahoo! Finance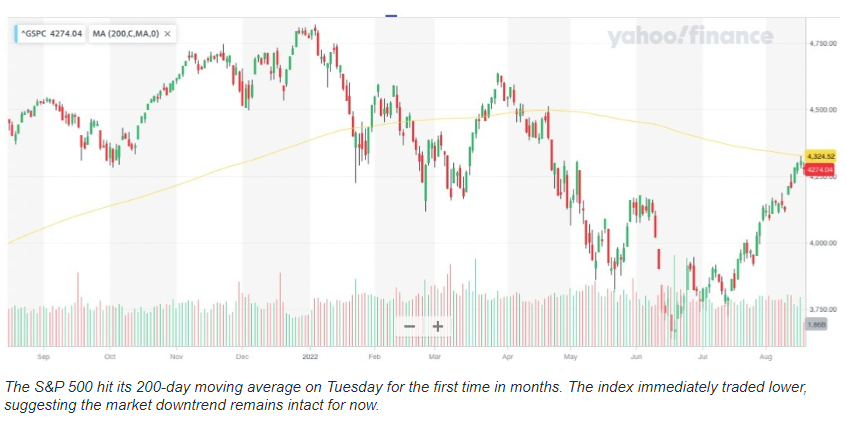
If you look at the chart, you will see that from the January top we have now had two rallies, each peak lower than the previous one. I expect the next low to be below the July low; how much, I could only speculate. But that would confirm that we are still in a bear market. The market will rally again, but if the next high is once again lower than the recent high, the bear market will remain intact until it breaks out and holds above its 200-day moving average.
Stocks to Fall Further
I am not a trader, so I plan to ride out the storm with mostly cash in my portfolio until I see compelling evidence that the market has truly bottomed out. Currently, 79% of stocks in the S&P 500 are trading below their respective 200-day moving average. When a stock trades below its 200-day moving average, it is an indication of weakness in the stock. For as long as the stock price remains below its 200-day moving average, the moving average line will continue to trend lower.
When the Stock price moves above the 200-day moving average line and remains there, the line will begin to turn upward. It is at this point that the stock becomes a strong buy, technically. The same is true for an index. You may miss the bottom 10-15% of a recovery but it takes the guess work out of the equation. I have seen a few false starts, but it has always been near the eventual bottom.
If you are wondering where the greatest weaknesses are likely to be, I expect consumer discretionary spending to fall, housing to continue downward and the slowing global economy may keep pressure on crude oil prices in the near term. However, natural gas prices will rise again during the winter months as Europe and Japan bid for constrained supplies because Russia will weaponize gas availability against Europe while it continues its invasion of Ukraine.
Many of the stocks that led the rally will lead the drop down. Most of them are above their respective 200-day moving averages and trade at extremely high valuations relative to the broader market. The SPDR S&P 500 ETF (SPY), the SPDR Dow Jones Industrial Average ETF (DIA) and the Invesco QQQ Trust (QQQ) will all hit new lows in the coming months. The next level of support for SPY is around 320, so fasten your seat belt because it will be quite a ride.
Be the first to comment