

Oat_Phawat/iStock via Getty Images
Introduction
The Toronto-based Marathon Gold (OTCQX:MGDPF) is a gold exploration and development company. The company released the fourth-quarter earnings and full-year 2021 results on March 25, 2022.
Note: My preceding article on Marathon Gold was published on December 28, 2020, and I believe it is time to look at the Valentine Project.
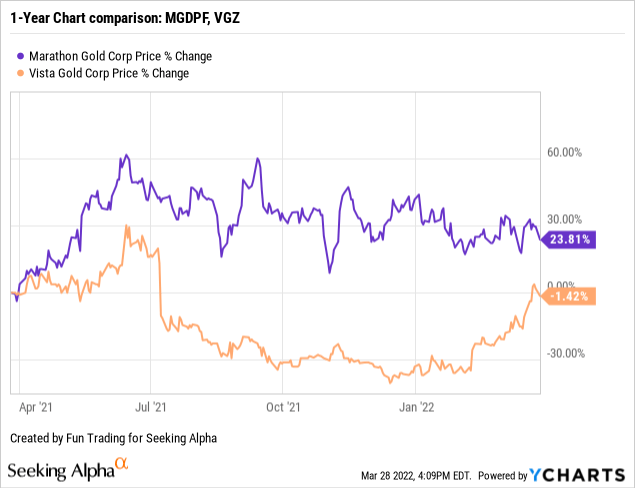
1 – Stock Performance
Marathon Gold is performing well and is up 24% on a one-year basis. The main reason for such excellent performance is the gold price, making these projects more attractive.
2 – Investment Thesis
The investment thesis that I recommend is to adopt a short-term trading strategy tied to a small, long-term investment until the project is sufficiently advanced and ready to be monetized (partnership) or about to be built.
MGDPF: Presentation Map (Marathon Gold)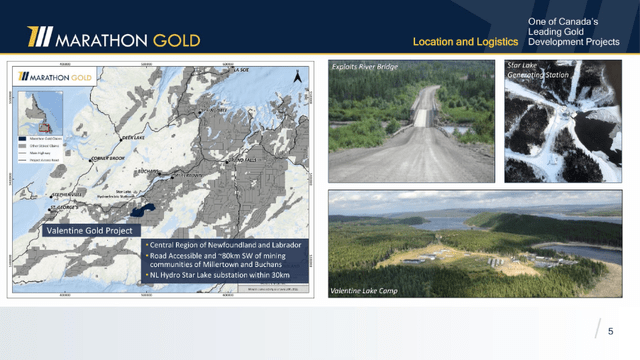
One negative which raised many flags: The company has financed the project by basically diluting the stock, and I am not a fan of this financing (bought private deal placement).
MGDPF: Three last recent financing presentation (Marathon Gold)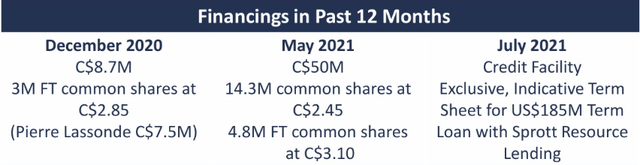
However, the wholly-owned Valentine Project is an attractive project located in Central Newfoundland that could eventually turn into a profitable takeover. It has the right location and the correct size.
The project has the largest Gold Resource in Atlantic Canada and 13-Year Mine Life. The company has $68.11 million in cash and cash equivalents at the end of December 2021.
Note: On February 21, 2019, Marathon sold a 2% net smelter returns royalty on the Valentine Gold Project to Franco-Nevada Corp. for gross proceeds of $18,000 and net proceeds of $17,979.
3 – A quick presentation of the Valentine Gold Project
Note: The company published the latest presentation in March 2022.
3.1 – Presentation
The company’s flagship asset is the Valentine Gold Project, located in the central region of Newfoundland, Canada, an excellent jurisdiction for the mining industry.
MGDPF: Map Presentation (Marathon Gold)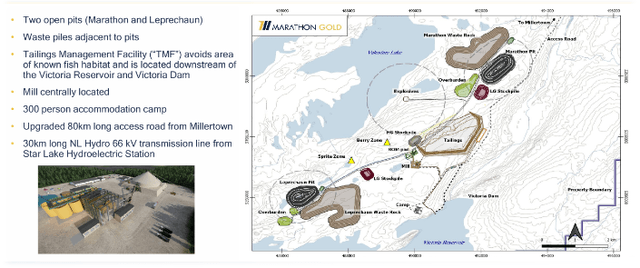
The project consists of two separate open pits called the Leprechaun and the Marathon, with a mill site centrally located, as we can see on the map above.
- Mineral reserves are 2.05M Au oz (47.1 Mt at 1.36 g/t Au), and mineral M&I resources of 3.14M Au oz (56.7 Mt at 1.72 g/t Au), 1.64 Moz inf. resources (29.6 Mt at 1.72 g/t Au).
- Access from Millertown (80 Kms) has been upgraded, and power has been secured with a 30 km long NL Hydro 66 kV transmission line from the Star Lake Hydroelectric Station.
- The annual gold production is expected to be 173K Au Oz (first ten years) with an annual after-tax cash flow of about $77 million. Life of mine is expected to be 13 years and over 2.5 g/t on average.
- The mill will run at 6,800 TPD (phase 1) for the first three years based on gravity leaching and then go to 11,000 TPD (phase 2) using gravity-floatation-leaching.
- Initial CapEx is about $205 million (C$272 million). With the mill expansion (phase 2) and others, we should add about $32 million. Sustaining CapEx is estimated at $183 million.
- LOM Project AISC is estimated at $833 per ounce.
MGDPF: Project highlight presentation (Marathon Gold)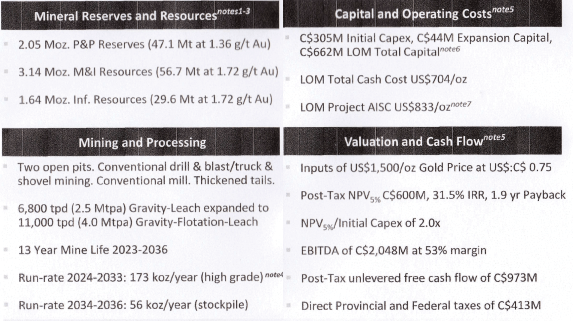
3.2 – On March 17, 2022, the company received approval from the Provincial Environmental Assessment, allowing sectoral permitting and construction. First gold is expected in 2024.
The FS began in August 2020, and EIS was filed with the federal and provincial regulators in September 2020.
On March 17, 2022, the company said:
The Company was notified by the NL Minister of Environment and Climate Change that the Environmental Assessment Committee overseeing the provincial environmental assessment (“EA”) of the Project had completed its review of the Project’s EIS and, concurrently, Marathon was advised that the Project has received approval by the Cabinet of the Government of Newfoundland and Labrador. This marks the completion of the provincial EA process, allowing Marathon to commence site-specific permitting including the acquisition of the Project’s Mining Lease;
Matt Manson, president and CEO, said in the press release:
We made steady progress during 2021 on multiple fronts towards the delivery of the Valentine Gold Project as Atlantic Canada’s largest gold producer. We delivered a positive Feasibility Study in April and had advanced our engineering, design and procurement work significantly by year end. We have continued to strengthen our project team and build-out our staffing in the central region of Newfoundland around our Grand Falls-Windsor base.
MGDPF: Approval from the PEA (Marathon Gold Presentation)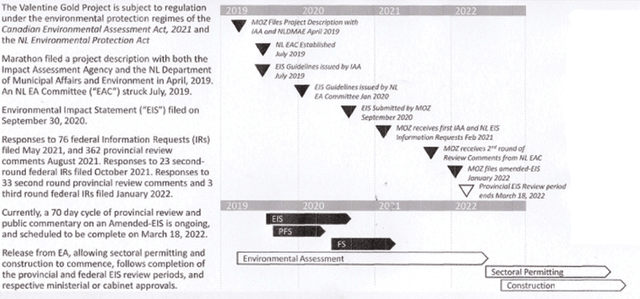
Marathon Gold – 4Q21 Financials. The raw numbers
Note: The company is not generating revenues. All numbers are indicated in $US.
| MGDPF in $US | 4Q20 | 1Q21 | 2Q21 | 3Q21 | 4Q21 |
| Net Income in $ Million | -2.25 | -2.10 | -2.70 | 0.99 | -1.85 |
| EBITDA $ Million | -1.96 | -1.26 | -1.94 | -1.87 | -2.02 |
| EPS diluted in $/share | -0.01 | -0.01 | -0.01 | 0.00 | -0.01 |
| Cash flow from Operation $ million | -0.72 | -1.27 | 0.84 | -2.92 | -1.08 |
| CapEx in $ million | 5.04 | 4.45 | 3.86 | 11.60 | 12.81 |
| Free Cash Flow in $ Million | -5.76 | -5.72 | -3.02 | -14.52 | -13.89 |
| Total Cash $ Million | 40.33 | 37.00 | 88.00 | 82.72 | 68.11 |
| Long term Debt in $ Million | 0 | 0 | 0 | 0 | 0 |
| Shares outstanding in Million | 231.14 | 212.47 | 255.34 | 251.33 | 234.20* |
Source: Marathon Gold filing (warning: numbers in the filing are in $C)
* Share capital (balance at December 31, 2021) is 253,919,265 shares.
Cash position history
MGDPF: Quarterly cash position history (Fun Trading)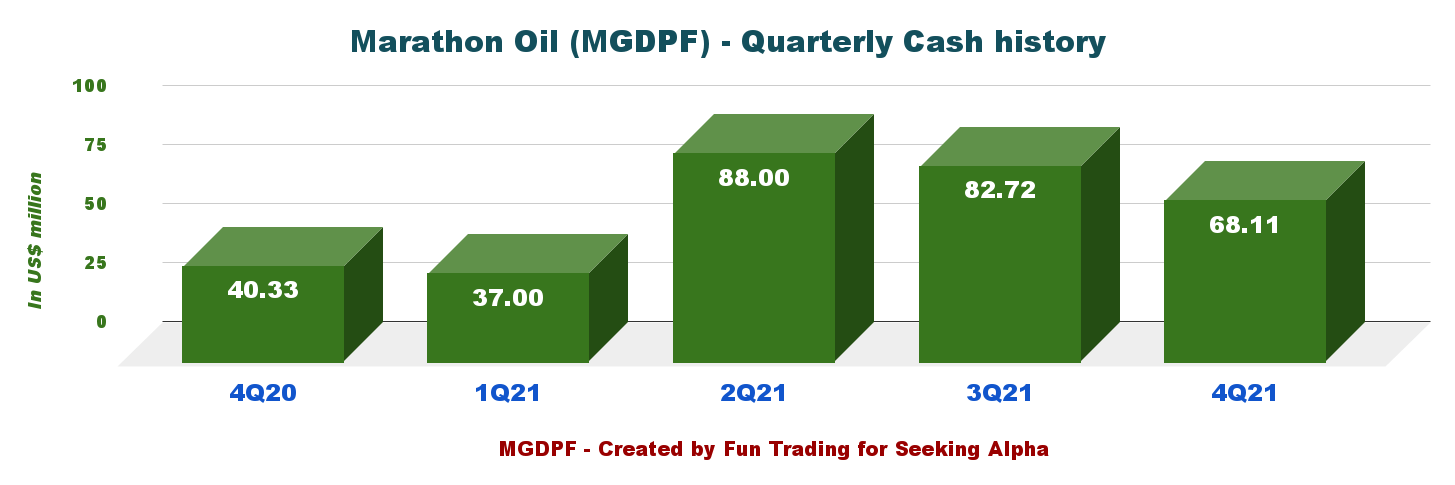
The cash position in 4Q21 was $68.11 million, up 68.9% year over year.
Technical Analysis (short-term) and commentary
MGDPF: TA Chart (Fun Trading)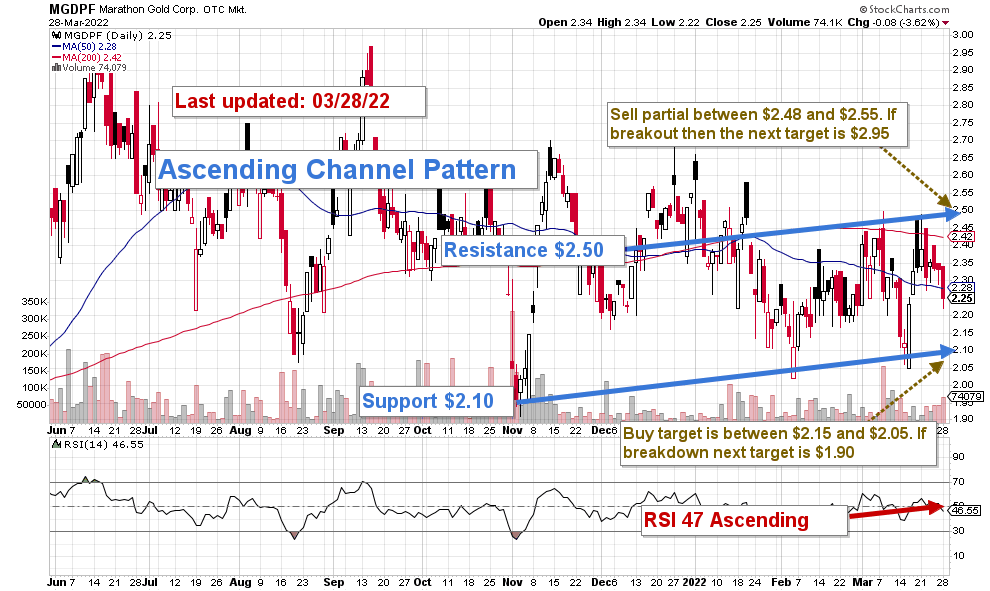
MGDPF forms an ascending channel pattern with resistance at $2.50 and support at $2.10.
The ascending channel pattern is considered short-term bullish in that a stock moves higher within an ascending channel. However, these patterns often form within longer-term downtrends as continuation patterns.
I recommend trading LIFO. The trading strategy is to sell about 50% of your position, starting at $2.48 to $2.55, and wait for a meaningful retracement at $2.15-$2.05. You can wait for a clear breakdown below $2 to start adding again.
The stock is highly correlated to the gold price.
The issue for gold is what the Fed will decide about this high-persistent inflation. Gold went up significantly over the past few weeks and reached $1,965 per ounce last Friday.
What pushed gold higher was the Fed’s lack of decisive action to counter the inflation threat. The Fed is always slow to react due to political pressure and its notorious lack of vision (behind the curve syndrome).
Another factor is the Russian invasion of Ukraine, which adds more interest in gold as a refuge. Moreover, the USA has recently increased restrictions on the Russian gold stockpile, representing about $140 billion that cannot be used, explaining the recent metal strength.
However, the Fed is signaling it may hike faster and higher in 2022 after admitting that it has been blind to the fundamental nature of inflation.
The result is that the gold price may struggle in the next few months.
Warning: The TA chart must be updated frequently to be relevant. It is what I am doing in my stock tracker. The chart above has a possible validity of about a week. Remember, the TA chart is a tool only to help you adopt the right strategy. It is not a way to foresee the future. No one and nothing can.
Author’s note: If you find value in this article and would like to encourage such continued efforts, please click the “Like” button below as a vote of support. Thanks!
Be the first to comment