

rrodrickbeiler
Almost one year ago, I wrote a piece framing the macro scenario for the foreseeable future. Basically, I used the 40s as my analog, and I even went as far as to set up three main hypotheses:
H1: Inflation will not reach the levels of the post-WWII period (18%), and inflation will revert in the following years.
H2: Interest rates will not pass 3.5% during the next year.
H3: The oil price will not return to all-time highs.
Now, here I am to take redemption.
Annotated mistakes
I kind of got right two of the three theses. Inflation did not spike to post-WWII highs (at least not yet), and the oil price did not return to all-time highs. If these two theses get crushed in the following months, then we are in a completely different territory, and we might skip to the end of this piece. If not, then we might learn some valuable lessons here.
The most important one is that you must always consider the randomness of human behavior. When I said that the interest rates wouldn’t go beyond 3.5%, I assumed the Fed would perform yield curve control or another form of financial repression to keep them below that level. It never occurred to me that they would embark on a Friedman renaissance at the wrong time (in my perspective, of course). Ignoring the merits of the hikes, in hindsight, I was naïve and allowed that risk to stay unchecked in my thesis.
Seeking Alpha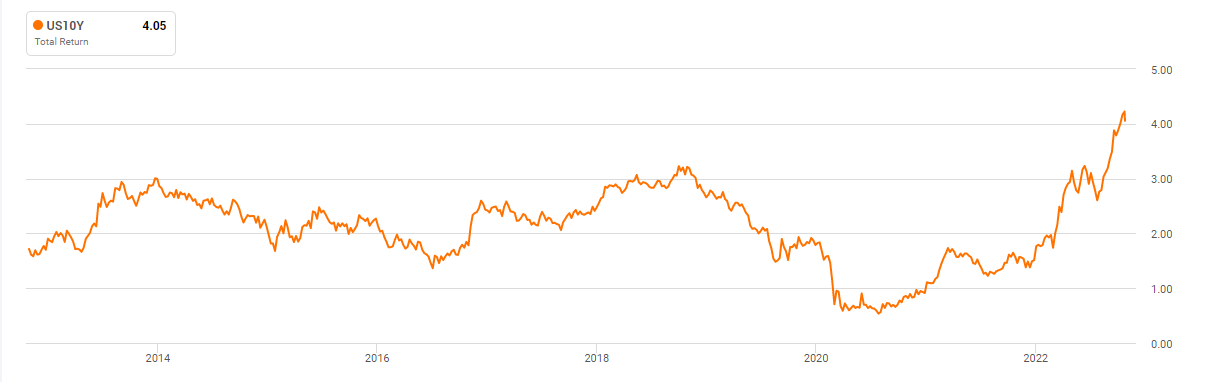
However, this could have been foreseen and avoided. Although I don’t agree with the current hikes, the extraordinary Fed’s measures during the Covid crisis and the Fiscal largesse it allowed (well into the reopenings) were a mistake. They should have been much more agile with the stimulus and tightened much sooner and at a slower pace than the current cycle. That could have avoided the insane instability in global markets while curbing demand at an initial stage, making it more manageable.
That said, they did the exact opposite, and by the end of 2021, it was clear that we would have inflation, which they quickly deemed transitory. In my opinion, it will be transitory, the problem being that they telegraphed just a couple of months of higher inflation. Nevertheless, inflation is never a couple of months transitory. It is more like years transitory if we are lucky (I’ll get back to this later).
Historically, as soon as inflation hits more than 5%, history shows that it usually takes more than 12 months to get back to tolerable rates. There is a logical reason for that, on the one hand, price increases are sticky, and on the other hand, you’ll need twelve months to start to have comparables on the new level. When it became evident that inflation wouldn’t end in a few months, market participants took the opposite view and embarked on a 70s-like scenario. The most panicked being the Fed board. Therefore, they embarked on the fastest tightening cycle in recorded history.
That was my mistake, to assume that the Fed, first, was telegraphing the right expectations, second, would keep cold-blooded when inflation arrived. I downplayed that there was too much reputational risk if they didn’t act. When pressure struck, they did the easiest and threw the baby out with the water.
Where do we go now?
First, it is still critical to make the correct diagnostic for inflation. So, let’s look at the analogs. Right now, people are mainly using two periods as analogous cases. One camp, defending the transitory thesis, holds the 40s as their analog. The other, supporting secular inflation, holds the 70s as the best example.
In the article that originated this piece, I defended that the sustained rise in oil prices was the primary reason why the 70s was so inflationary. We can also add the Baby boomers entering the workforce and becoming a major demand catalyst and the inflationary politics stemming from the guns and butter years. The current scenario lacks the force of a huge young generation suddenly becoming consumers.
Using the 5% as a reference, we can see that both cases are very different from each other.
Author based on https://www.usinflationcalculator.com/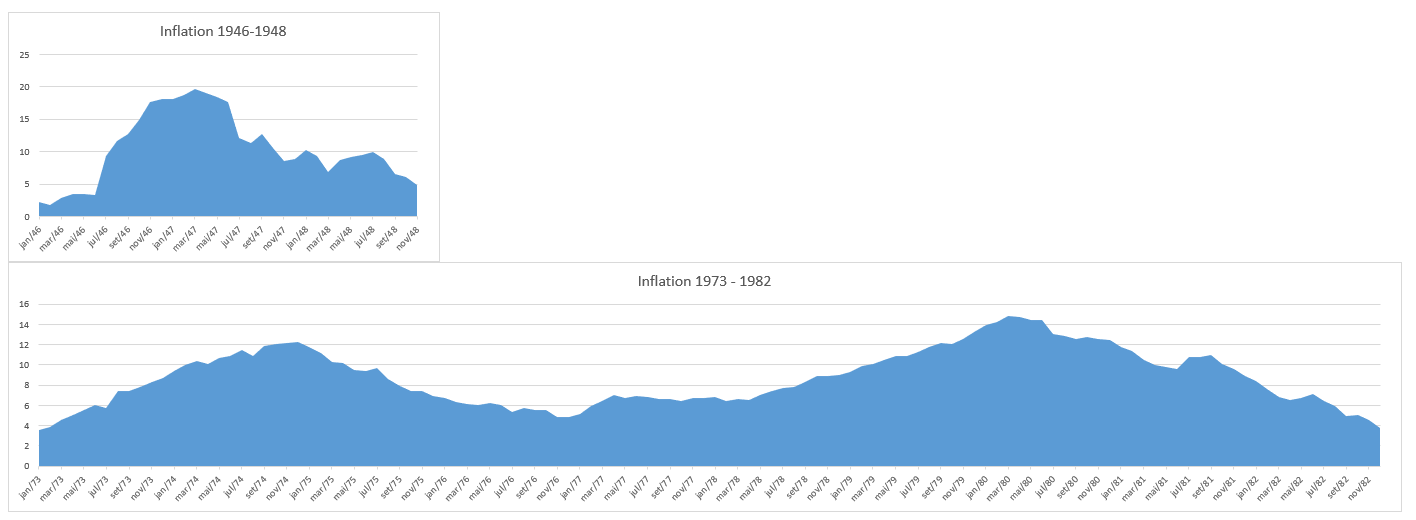
Looking at both graphs, it’s not hard to understand which one was transitory. The 40s case lasted almost three years, while the 70s lasted almost one decade. While the 40s was an adjustment to supply chains and logistics, the 70s was a huge adjustment to demographics and energy costs. The latter took a lot longer to play out. In my view, the Fed got the transitory right, it just didn’t apply the correct timeframe.
To sum it up, I still think the 40s is the correct analog to apply to the current scenario. If the best scenario is the 70s, then we are in a decade-long storm.
Investment action
How can we translate this scenario into action? Quoting an old market expression from the 80s, buy bonds wear diamonds. The brutal hiking cycle is pushing the economy into a recession. Higher interest rates are now starting to take their toll on the economy. The longer it takes for the Fed to pivot, the lower the inflation expectations at the long-term end of the curve. In addition, the instability in the financial market brought about by the rise of the dollar will provoke tectonic shifts in the Eurodollar offshore credit market, which will translate into something breaking. A couple of weeks ago, it was the Gilt market and UK pension funds. I dare to say that UK and EU institutions are particularly susceptible to accidents of this sort.
All that together justifies some yield curve control and financial repression. Demand destruction and the flattening of the owners’ equivalent rent portion of the CPI will bring the CPI down and the space for the Fed pivot. If all these conditions materialize, the short term of the curve will collapse faster than the long end. US bonds with maturities ranging from one to three years can significantly capture that movement. Since I expect the hiking cycle to crush growth expectations in the short term, I’m interested in low-duration bonds. The iShares 1-3 Year Treasury Bond ETF (NASDAQ:SHY) has 66% of its holding in bonds with lower than two years duration. It seems like a cost-effective proposition. With a 0.15% expense rate, this is one of the cheapest ways to get exposure.
Seeking Alpha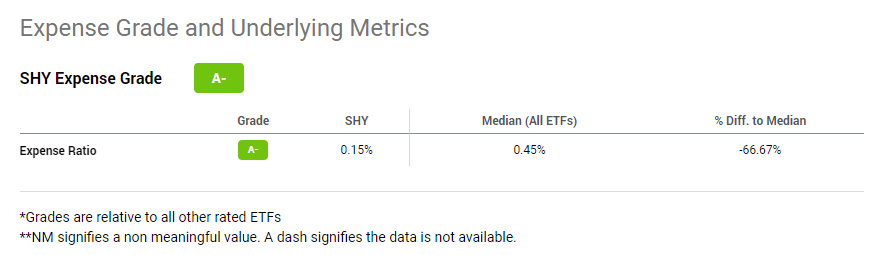
The price action has been awful during the last year, with the price trending lower by more than 5%.
Seeking Alpha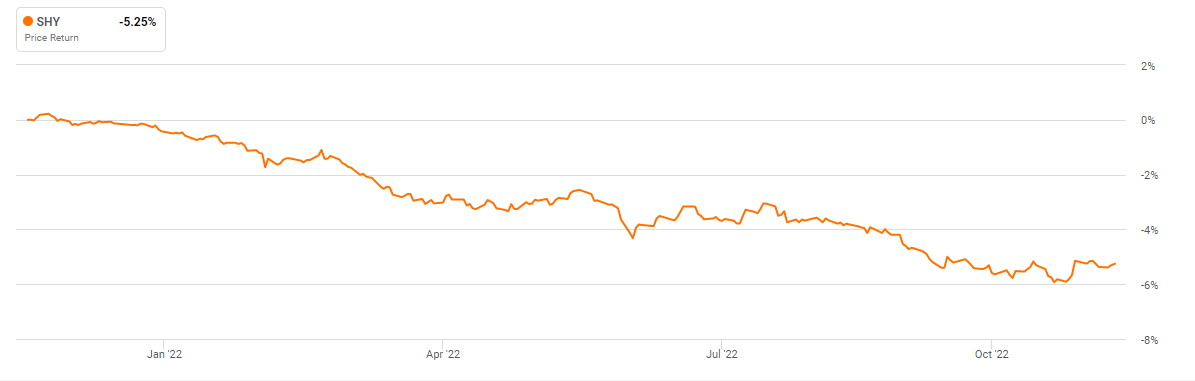
This ETF has interesting properties in terms of risk. If we look at the historical performance, we observe that it performed awfully in hiking cycles leading to growth scares. That happened from 2004 to 2007, from 2016 to 2018, and from 2021 to the present. On the other hand, it performed very well in 2007, 2019, and 2020, working effectively as a safe haven.
Seeking Alpha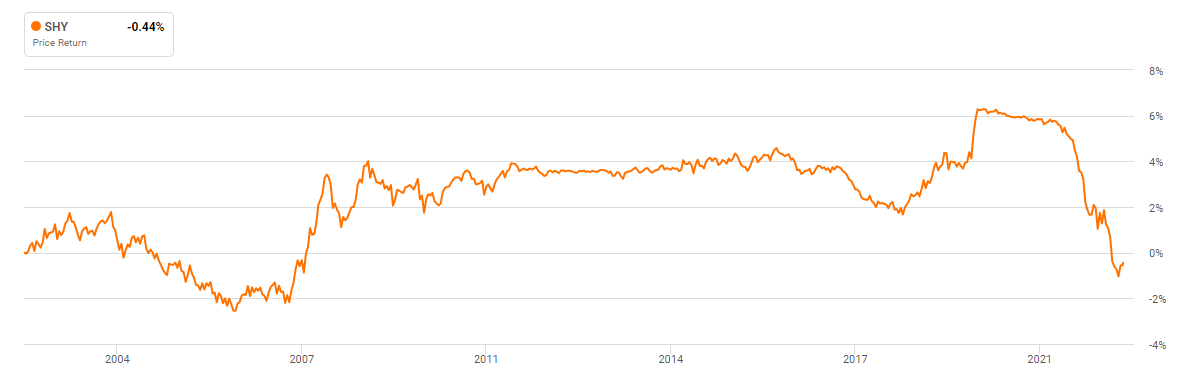
The current drawdown anticipated the Fed’s tightening cycle, and I dare say that it will provide a good signal for when the Fed pivots. With an SEC yield of 4.46%, the assets in the fund offer an interesting carry trade.
iShares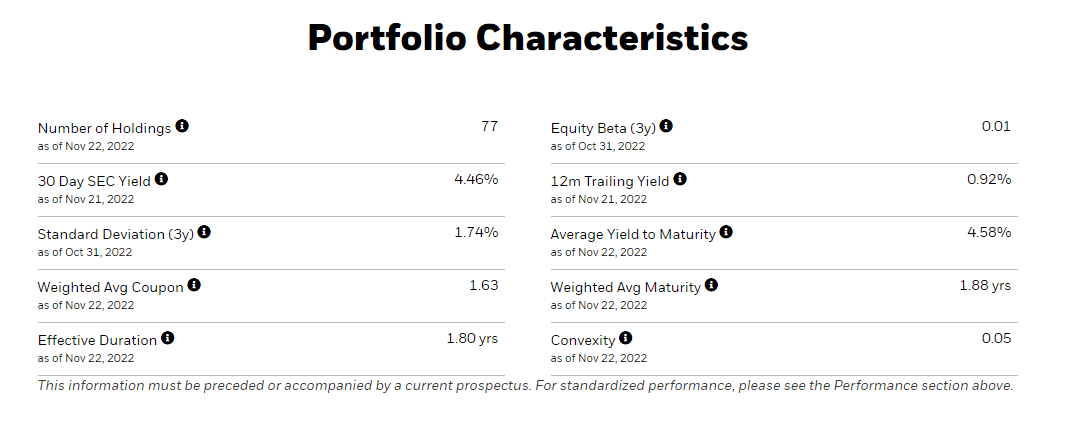
The main risk lies in the continuation of the hiking cycle and in the fact that the current yield for the assets present in the ETF does not keep your purchasing power. If the Fed sticks to the Taylor rule and ends up pursuing rate hikes through 2023, then even this ETF will suffer. Nevertheless, from peak to valley, the fund lost close to 6% so far. If you compare it with other asset classes, I believe the SHY shines.
Be the first to comment