

May Lim/iStock via Getty Images
Overview/Investment Rationale
The retail sector has started to improve from the pandemic disruptions. The 2021 holiday season helped increase customer traffics and tenant sales across malls in the US. The Macerich Company (MAC, or ‘Macerich’) primarily owns and operates in top-class US malls that benefit from the improved US retail markets growth. In recent times, Macerich also reduced its debt with increased cash flow from operations. Macerich has offered strong FY 2022 guidance.
Macerich, a real estate investment trust (REIT), primarily focuses on acquiring, leasing, managing, and developing regional malls throughout the US. As of December 31, 2021, Macerich owned 48 million square feet of real estate consisting primarily of interest in 44 regional town centers.
Please read my STAG Industrial (STAG) thesis to understand the industrial REIT market trends.
Reported Strong Earnings In Q4 2021 And Provided Solid Guidance
In Q4 20201, Macerich reported an FFO of $0.53, beating the consensus estimates by $0.05 (a surprise of 9.4%). The Company generated revenues of $229.4 million, up 17.9% y-o-y, beating the consensus estimates by $23.72 million (a surprise of 10.3%). The Company experienced double-digit tenant sales growth for three quarters in a row, higher than in 2019 levels. Tenants’ sales in Q4 2021 increased by 12% compared to Q4 2019. In 2021, the Company also signed more leases than in 2019.Macerich offered FY 2022 guidance with an FFO of $1.85 to $2.05 per share. Same-center NOI growth rate is expected to be a healthy 4% to 5.5%.
Macerich Is Positioned As A Strong Mall Player
Macerich now primarily owns and operates Class A malls. Macerich has disposed of about $4 billion worth of low-quality assets over ten years. It shows that Macerich was able to sell properties that had significant exposure with e-commerce sales and low occupancy. It is expected that online sales will continue to impact brick-and-mortar retail sales over the long run. As a result, many retail companies may think of reducing their store count in the long run. At the same time, foot traffic and sales productivity in Class A malls have recently improved and surpassed 2019 levels. As noted earlier, Macerich’s portfolios are well-positioned in Class A malls; as a result, Macerich should enjoy strong rental growth over the years to come.
Macerich’s Balance Sheet Improved With Reduced Debt
During 2020, the COVID-19 disruption significantly reduced the Company’s earnings, while its debt increased substantially. In Q1 2020, the Company withdrew its remaining capacity of about $1.5 billion from its credit facility. Therefore, the Company’s total debt increased to $8.72 billion in Q1 2020. Like other REITs, Macerich negotiated with its lenders for deferring debt service payments. Once the COVID-19 restrictions ease in 2021, the Company’s rent collections and occupancy have improved. In Q2 2021, the Company reduced its total debt to $7.53 billion, a 13% sequential decline compared to $8.66 billion in Q1 2021. In 2021, the Company raised capital through an at-the-market offering (ATM) and divested properties, which helped decrease its debt. In 2021, the Company generated approximately $240 million after paying dividends and recurring capital expenditures. As a result, the Company repaid about $1.7 billion of debt or 20%.
Exhibit 1: MAC’s Total Consolidated Debt Trends since Q4 2019
Macerich Filings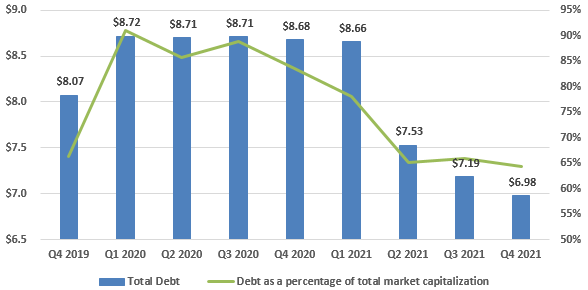
I believe Macerich’s balance sheet remains strong as the Company operates with a reasonable level of debts and coverage ratios. As seen in Exhibit 2, Macerich’s debt coverage ratios have started to improve. Net debt-to-adjusted EBITDA declined from 15.43xin Q4 2020 to 9.72x in Q4 2021. Further, the interest coverage ratio also improved from 2.65x in Q4 2020 to 4.12x in Q4 2021. I believe the Company could reduce its net debt-to-adjusted EBITDA to less than 8.0x over the next few years as the retail sector improves.
Exhibit 2: MAC’s Debt Coverage Ratios Trends Since Q1 2020
Macerich Filings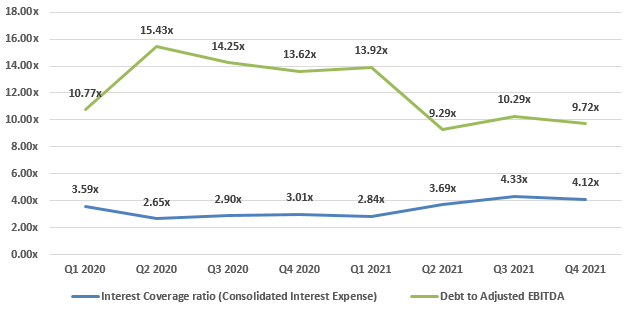
Increased Customer Traffics To Provide Strong Rental Growth
The 2021 holiday has helped increase customer traffics and tenant sales. Despite customer traffic improvement, it is still about 95% of 4Q 2019 traffic levels. At the same time, tenant sales growth has exceeded the 2019 levels.
Portfolio occupancy improved by 180 basis points year-over-year and 120 basis points sequentially to 91.5% in Q4 2021, as seen in Exhibit 3. As of December 2021, trailing 12 months leasing spreads stood at a healthy 4.9%. I believe the Company’s occupancy should increase in 2022 and 2023, primarily attributable to a solid leasing pipeline and the improving retail industry.
Exhibit 3: MAC’s Occupancy Trends since Q1 2019
Macerich Filings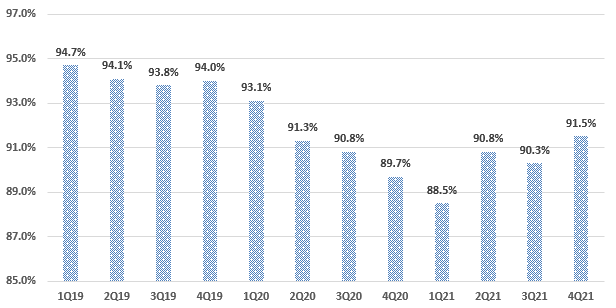
For Q4 2021, comparable sales for tenant space less than 10,000 square feet increased by approximately 12% compared to the pre-COVID levels (4Q 2019). Comparable sales for the second and third quarters of 2021 exceeded the pre-COVID levels by 14%. Comparable sales y-o-y growth rate for the fourth quarter of 2021 stood at 35.90%, as seen in Exhibit 4.
Exhibit 4: MAC’s Same-Store NOI Growth Rates Since Q1 2019
Macerich Filings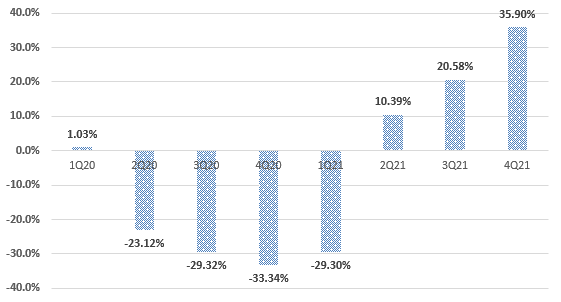
Peers Analysis
Macerich operates in a competitive business environment and competes with numerous malls, shopping centers, and other retail-oriented real estate owners. I have chosen Simon Property Group (SPG), Kimco Realty Corporation (KIM), Regency Centers (REG), Federal Realty Investment Trust (FRT), Brixmor Property Group (BRX), Kite Realty Group Trust (KRG), Tanger Factory Outlet Centers (SKT), RPT Realty (RPT), and Cedar Realty Trust (CDR) as these Macerich’s comparables as they also operate in the retail sector REIT segment and are listed in the US.
Macerich is significantly undervalued compared to its peers, as seen in Exhibit 5. As of March 31, 2022, share price of $15.87, Macerich trades at a forward P/AFFO of 10.3x, a significant 44% lower than the peers’ median forward P/AFFO of 18.5x. Further, Macerich trades at 8.3x of the 2022 FFO estimate versus the peer group at 13.5x, inferring a substantial discount of 39%. Macerich offers a slightly higher forward dividend yield of 3.7% against 3.6% for the peer group.
Exhibit 5: Peers Comparison Analysis
Seeking Alpha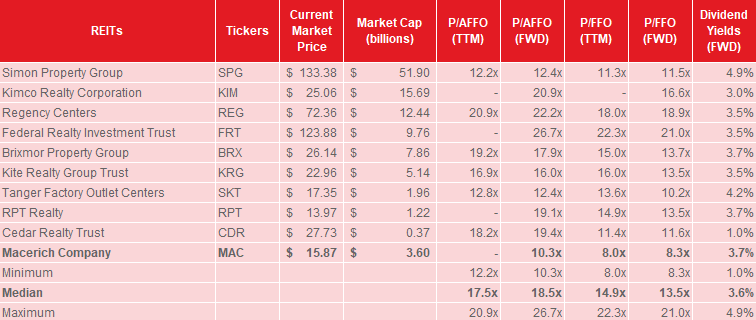
NAV Calculation
I estimate the Net Asset Value (NAV) of Macerich as $20.68 based on the cap rate of 8.0% and an assumed growth rate of 2.0% for the forward growth, as shown in Exhibit 6. The stock is underpriced and is currently trading at a 23.2% discount to NAV. My target price for Macerich is $20.00, almost in-line with its NAV. I believe the Company should generate significant revenues from its class A malls as the occupancy and rental rates improve. The Company is also relatively undervalued compared to its peers. The occupancy rates and same-store NOI are anticipated to strengthen as COVID-19 restrictions ease.
Exhibit 6: Macerich’s NAV Calculation
Author’s Calculation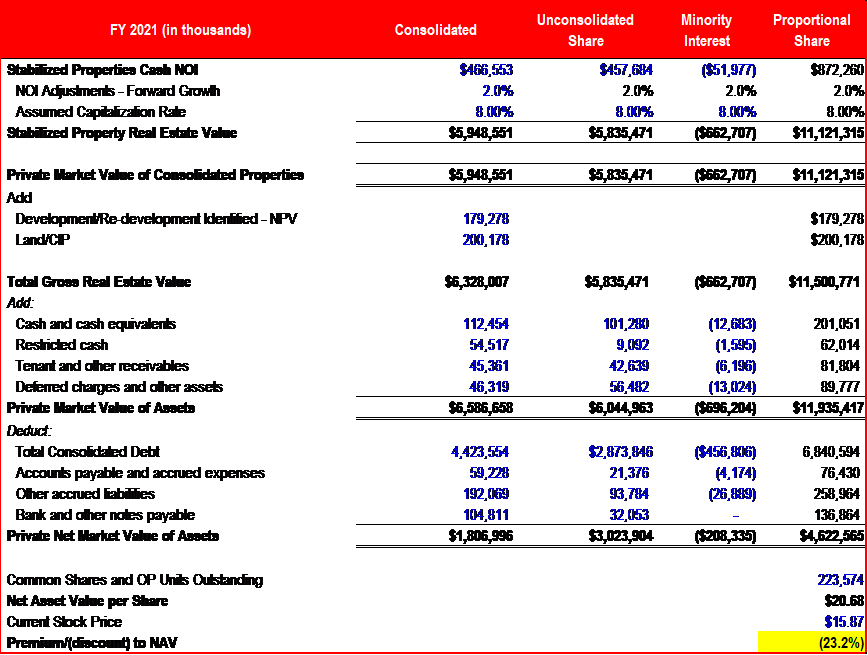
Exhibit 7 presents the sensitivity analysis for the NAV estimation with various growth rates and cap rates.
Exhibit 7: Sensitivity Analysis
Author’s Calculation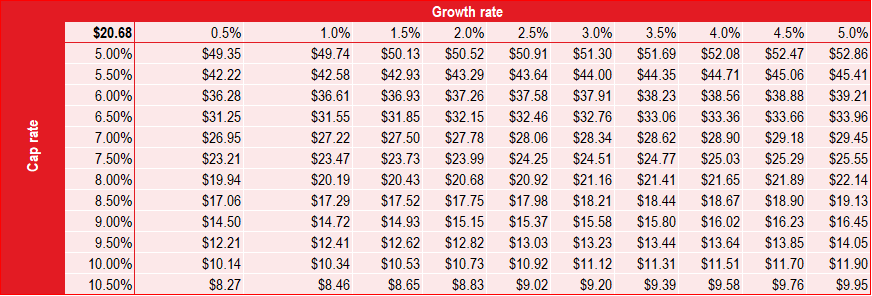
Foot Traffic Has Started To Return 2019 Levels
According to JLL research, a US-based real estate investment management firm, total retail and food services grew by 19.3% y-o-y to $7.4 trillion in 2021. Notably, in 2021, shopping centers’ foot traffic increased by 32.2% y-o-y. However, it is still below the 2019 levels. At the same time, foot traffic in sub-urban malls has nearly returned to the 2019 levels. The number of retailers’ bankruptcy also declined in 2021 and is the lowest in the last five years. In 2020, 70 major retailers filed bankruptcy, while the number of bankruptcy filings from retailers declined by 77% to just 16 bankruptcies in 2021. Leasing activity has also continued to improve with the solid net absorption since 2017.
Foot traffic at retail centers is expected to rise in 2022 as more COVID-19 restrictions are removed. Tenants now sign long leases, and investors invest more in retail assets, expecting a busy 2022 ahead.
Retails Sector Has Begun To Improve
According to CBRE, the retail sector has a relatively higher cap rate of 6.4% among four major sectors (industrials, office, retail, and apartment). The high cap rate is considered a risky investment. Meanwhile, the retail industry has been improving as discounts to NAV are in the decline phase. As seen in Exhibit 8 below, Grocery retailers are out-performers in the retail industry.
In 2020, COVID-19 severely impacted retail and the economy in general; as a result, shopping centers and regional mall REITs traded at a significant discount of over 40% to their NAVs. As of November 2021, the discount rates for shopping centers and regional malls are just at -2.3% and -8.3%, respectively. This shows investors’ increasing confidence in the retail sector. I believe the trends to continue in 2022 due to a strong appetite for grocery-anchored properties.
Exhibit 8: NAV Discount
CBRE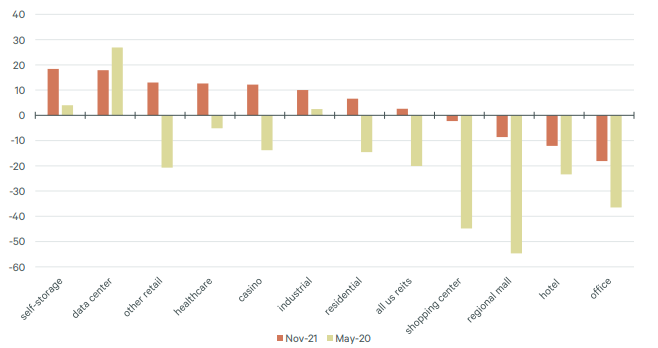
Risks
E-Commerce growth: the recent surge in eCommerce growth has a significant negative impact on traditional brick-and-Mortar retailers. Consumers continue to change their habits from buying in physical stores to shopping online. Therefore, demand for retail space in malls may decline.
Shifts in consumer behavior: Due to the surge in eCommerce and digital channel advances, consumers have shifted to online purchases. Customer loyalty has declined drastically, and buyers switching brands has increased at an unprecedented rate.
Increased interest rates: The Fed raised interest rates by 25 bps on March 16, 2022, the first increase since 2018. If interest rates have continued to increase, Macerich needs to refinance the maturing debt at much higher rate that will affect the company’s cash flow over a period of time.
Conclusion
I firmly believe Macerich has significant potential to grow its revenues as it primarily owns and operates Class-A malls located in the West Coast area, Arizona, the Metro New York to Washington and DC corridor. The 2021 holiday helped increase customer traffics and tenant sales. I believe the trends will continue in 2022 due to a strong appetite for grocery-anchored properties. In 2021, the Company paid approximately $1.7 billion, or 20% of the debt. Net debt to forward EBITDA stood at 9.72x in Q4 2021, significantly lower than the Company’s net debt to forward EBITDA of 15.43x Q2 2020. Further, Macerich has provided a solid FY 2022 guidance with same-center NOI growth rates of 4% to 5.5%.
Be the first to comment