

baona/iStock via Getty Images
|
Investment Terms and Service Providers |
|
|
Investment Structures: |
Delaware LP |
|
BVI Professional Company |
|
|
Management Fee: |
1% |
|
Performance Fee: |
20% |
|
High Water Mark: |
Yes |
|
Lockup: |
None |
|
Minimum Investment: |
$1,000,000 |
|
Redemption: |
Monthly, 30-day notice |
|
Auditor: |
EisnerAmper LLP |
|
Prime Brokers: |
IBKR |
|
Custodian: |
IBKR |
|
Fund Administrator: |
NAV Consulting |
|
Legal Counsel: |
Winston & Strawn LLP |
|
O’Neal Webster (BVI) |
|
|
Compliance: |
IQ-EQ (Blue River Partners) |
Dear Friends & Partners,
Our investment returns are summarized in the table below:
Results as of 9/30/2022. Periods longer than one year are annualized. All results are net of all fees and expenses. Past returns are no guarantee of future results. Please contact us if you would like to receive a full performance tearsheet. Please see the end of this letter for additional disclosures.
|
September’s results were poor – there is no way to sugarcoat it. We began the month with relatively low exposure to the stock market, and a plan to increase exposure if the market declined and stocks became more attractive. After the Federal Reserve meeting on September 21st, the U.S. stock market took a sharp turn lower and I proceeded to execute my plan, buying stocks almost every day over the following week-and-a-half.
As I have always said, I don’t believe you can time the stock market, but you can take advantage of attractive opportunities when they are presented. I also believe that once you formulate a plan one should follow the courage of one’s convictions and execute it faithfully. However, because U.S. stocks tanked through the end of the month and closed at the lowest point of the quarter on September 30th, our increased exposure to stocks after the Federal Reserve meeting let to our portfolio suffering substantially in the short-term.
As of October 3rd, 2022, our net exposure was approximately 102.73%, and our beta-adjusted exposure was 84.33%. We currently have 54 long positions with the top 10 accounting for approximately 40.07% of our total long exposure.
This month’s letter will be a bit shorter than usual as I want to focus on my views on the short-term direction of the economy and the markets. I anticipate returning to the regular format next month.
The Road Ahead
We are now positioned for a stock market rebound which I believe is imminent. Our portfolio is full of asymmetric opportunities: positions which I believe have limited downside and very high upside and I expect that we will benefit disproportionately from a stock market rebound. The results of the first two days of October show just how quickly things can change.1 I am truly sorry for the level of volatility we have experienced and the stress that you must be feeling because of it – I know I am. I believe that once we get through this difficult period, volatility will be considerably lower going forward.
I believe that a strong rebound in global stock markets is right around the corner, and there are several reasons for this view.
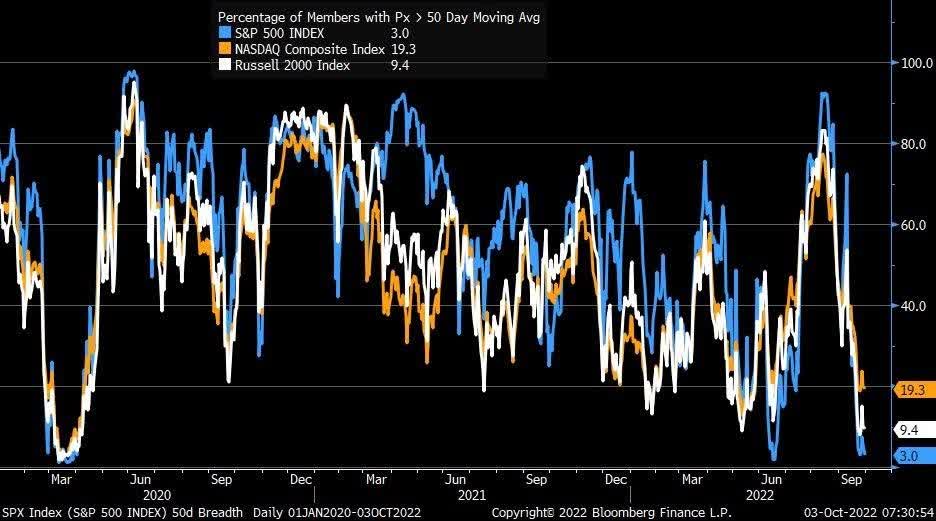
First, investor sentiment is at rock bottom with several indicators showing just how extremely negative it is. The % of stocks that at are trading above their 50-day moving averages is at levels that have historically coincided with strong rallies. Furthermore, the AAII Investor Sentiment Survey Bulls% less Bear% is at (41%), a level only once exceeded in the past twenty years (in March 2009).2 Any positive news can lead to a sharp snapback and a rally.
Anecdotally, stocks are beginning to react positively to what is prima facie bad news. For example, Micron Technology, Inc. (MU), the maker of memory chips reported earnings and provided updated guidance on September 29th. The guidance was well below what the company said previously and suggested the company may not make any money at all in Q1 next year.3 Yet, the stock went up, on the news, suggesting investors have priced in a lot of bad news already.
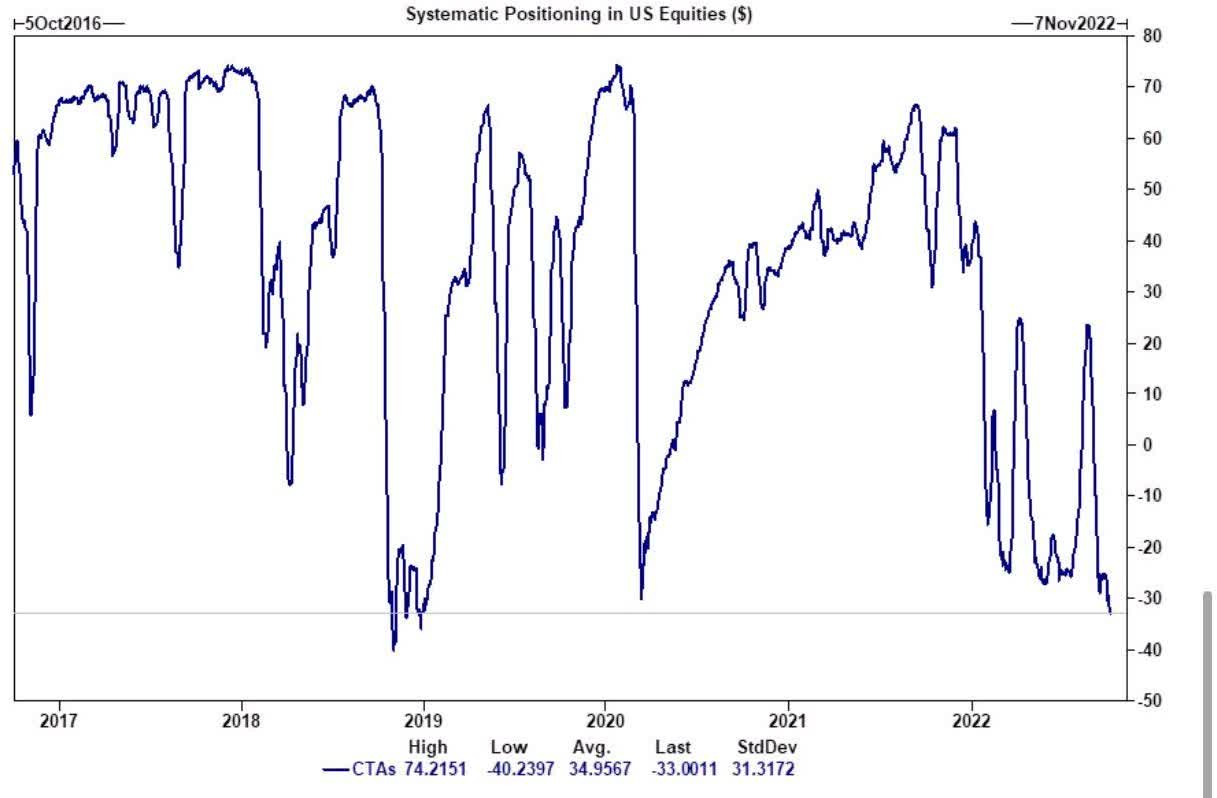
Trends following funds ((CTAs)) are max short. If the market stops going down CTAs will likely mechanically start buying stocks again. The chart below shows just how negative positioning is.
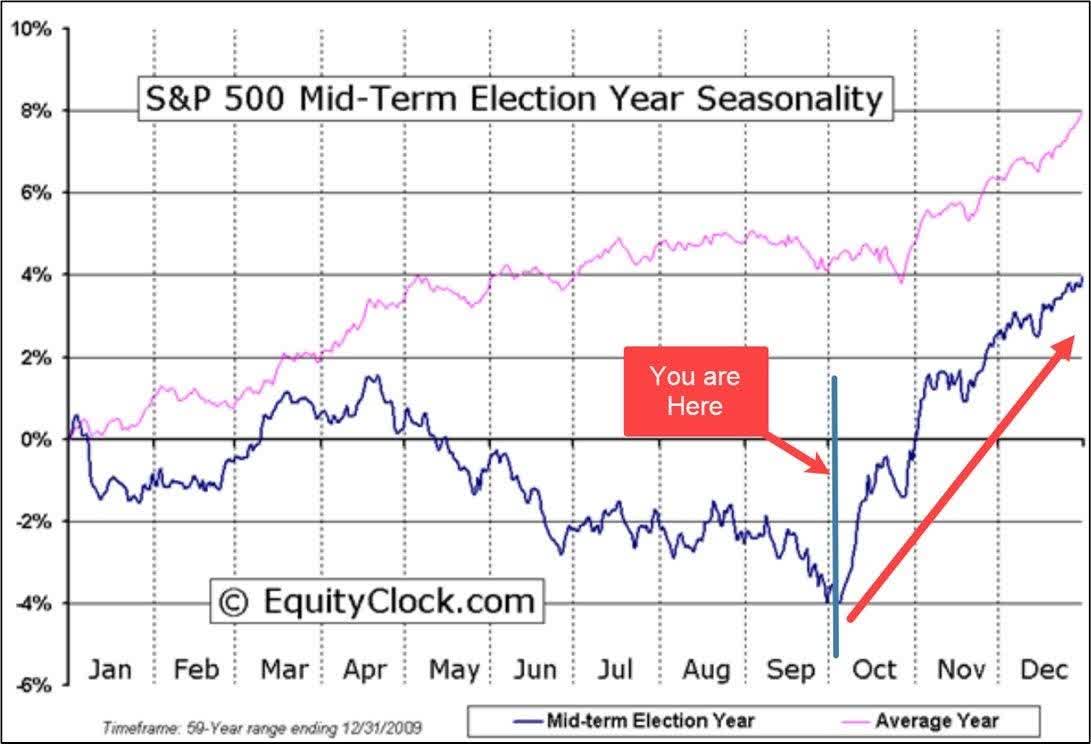
Stock market seasonality suggests that we are entering what is historically the strongest part of the year, Q4. Of note is that seasonality is even stronger in U.S. mid-term election years, like the one we are in now.
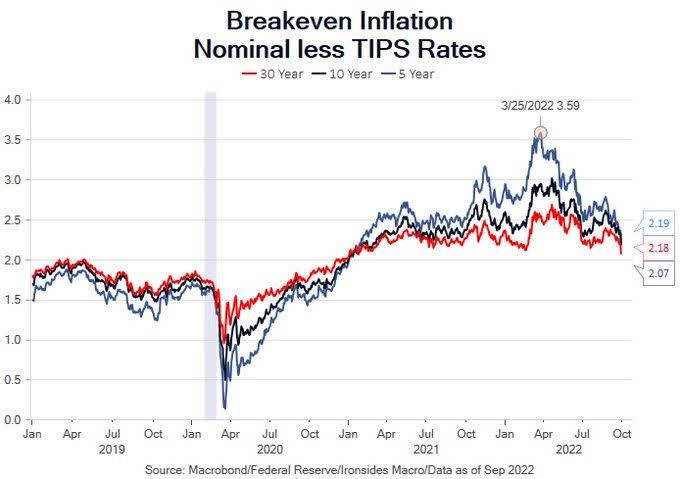
Inflation is peaking or has already peaked. Market expectations of inflation (inflation break- evens) peaked in March of 2022 and have been declining since.6 All forward looking indicators of inflation are now pointing towards declining prices. Housing prices have begun to decline both in the S&P Case-Shiller index7 and the FHFA data8. Even rental prices have begun to decline.9,10 Car prices are declining.11 Prices for lumber, oil, gasoline, natural gas and even wholesale electricity prices have peaked months ago and are declining.
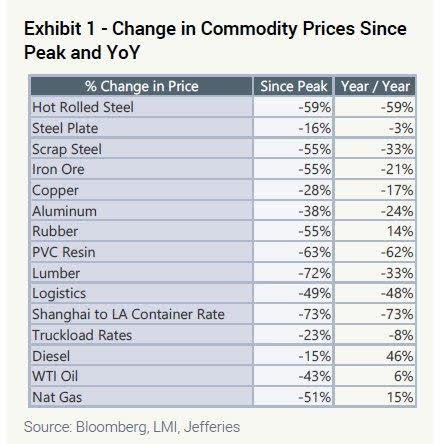
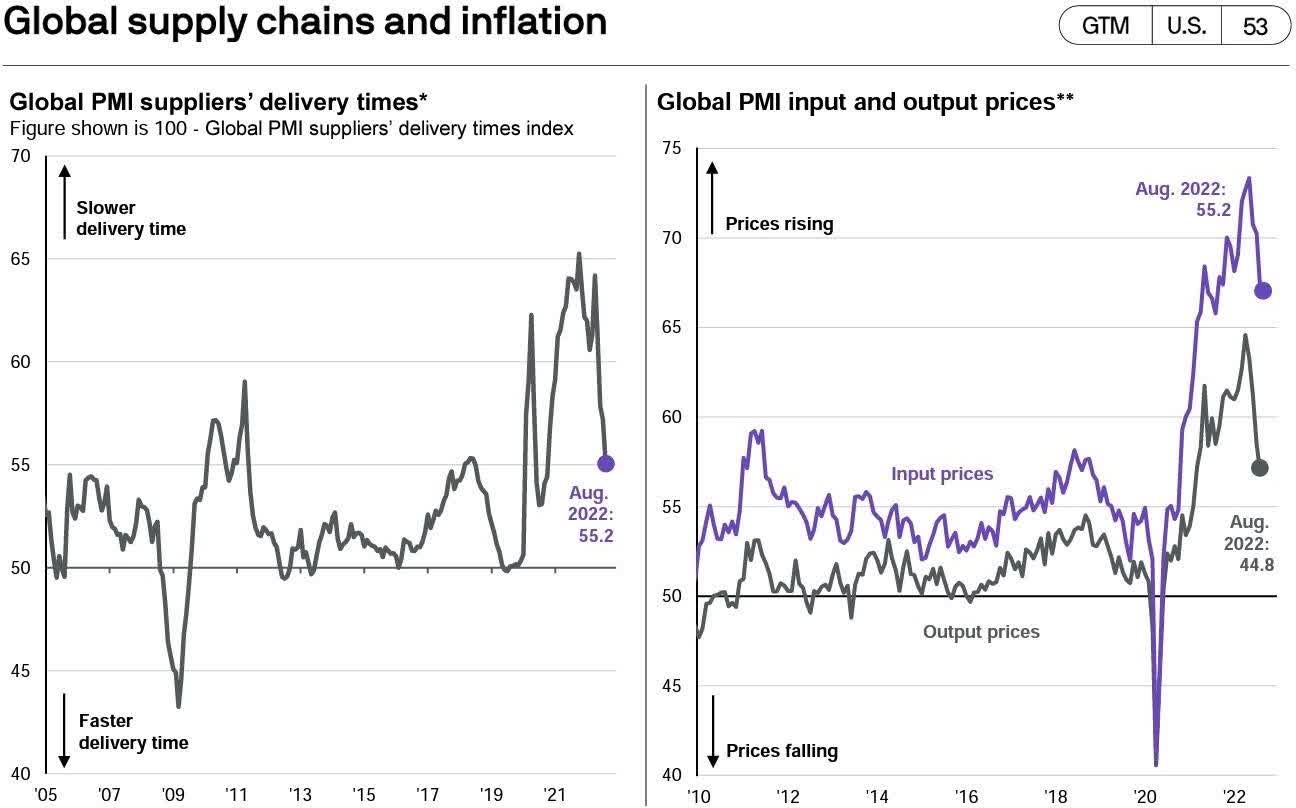
Prices of precious metals such as gold and silver have peaked and are down year-over-year. Industrial metals such as zinc, tin, nickel, lead, aluminum, and copper all peaked months ago. Similarly, agricultural commodities such as wheat, corn, soybeans, oats, sugar, cocoa, and cotton, have all been declining for months now. Global supply chain problems which previously helped push up inflation are now “unclogged” and will likely lead to disinflation in the months ahead. This can be seen in the chart below.
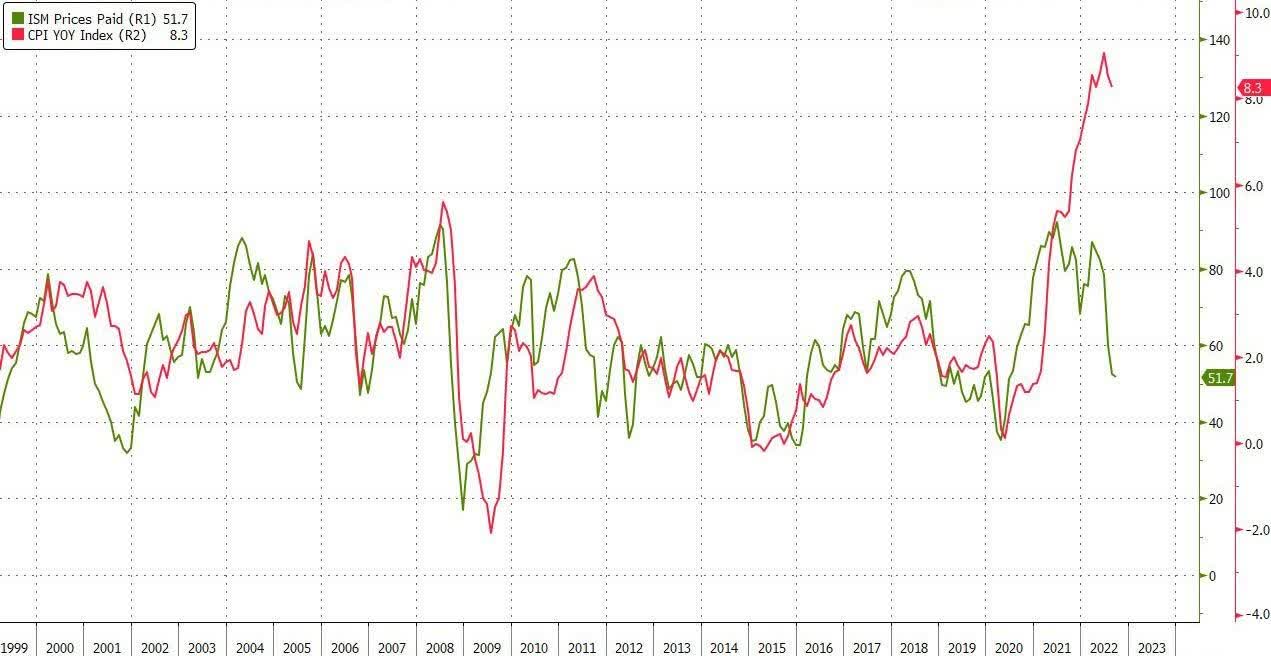
Manufacturing surveys, such as the ISM also point to lower inflation ahead.
The Federal Reserve will likely slow down or stop interest rate increases soon. The 1-year forward inflation break-evens are already below 2%. Based on forward looking data, I expect headline CPI to decline below 3% at the end of Q1 2023 and below 2% by Q2 2023. Since short term interest rates are already over 3% and are expected to increase before the end of the year, the Federal Reserve will likely need to consider interest rate cuts in the second half of 2023.
Based on forward looking market indicators, what is already happening in commodity markets and industrial survey data, I believe that the Federal Reserve is likely wrong about the need to raise interest rates significantly more and then keep them there for an extended period of time.
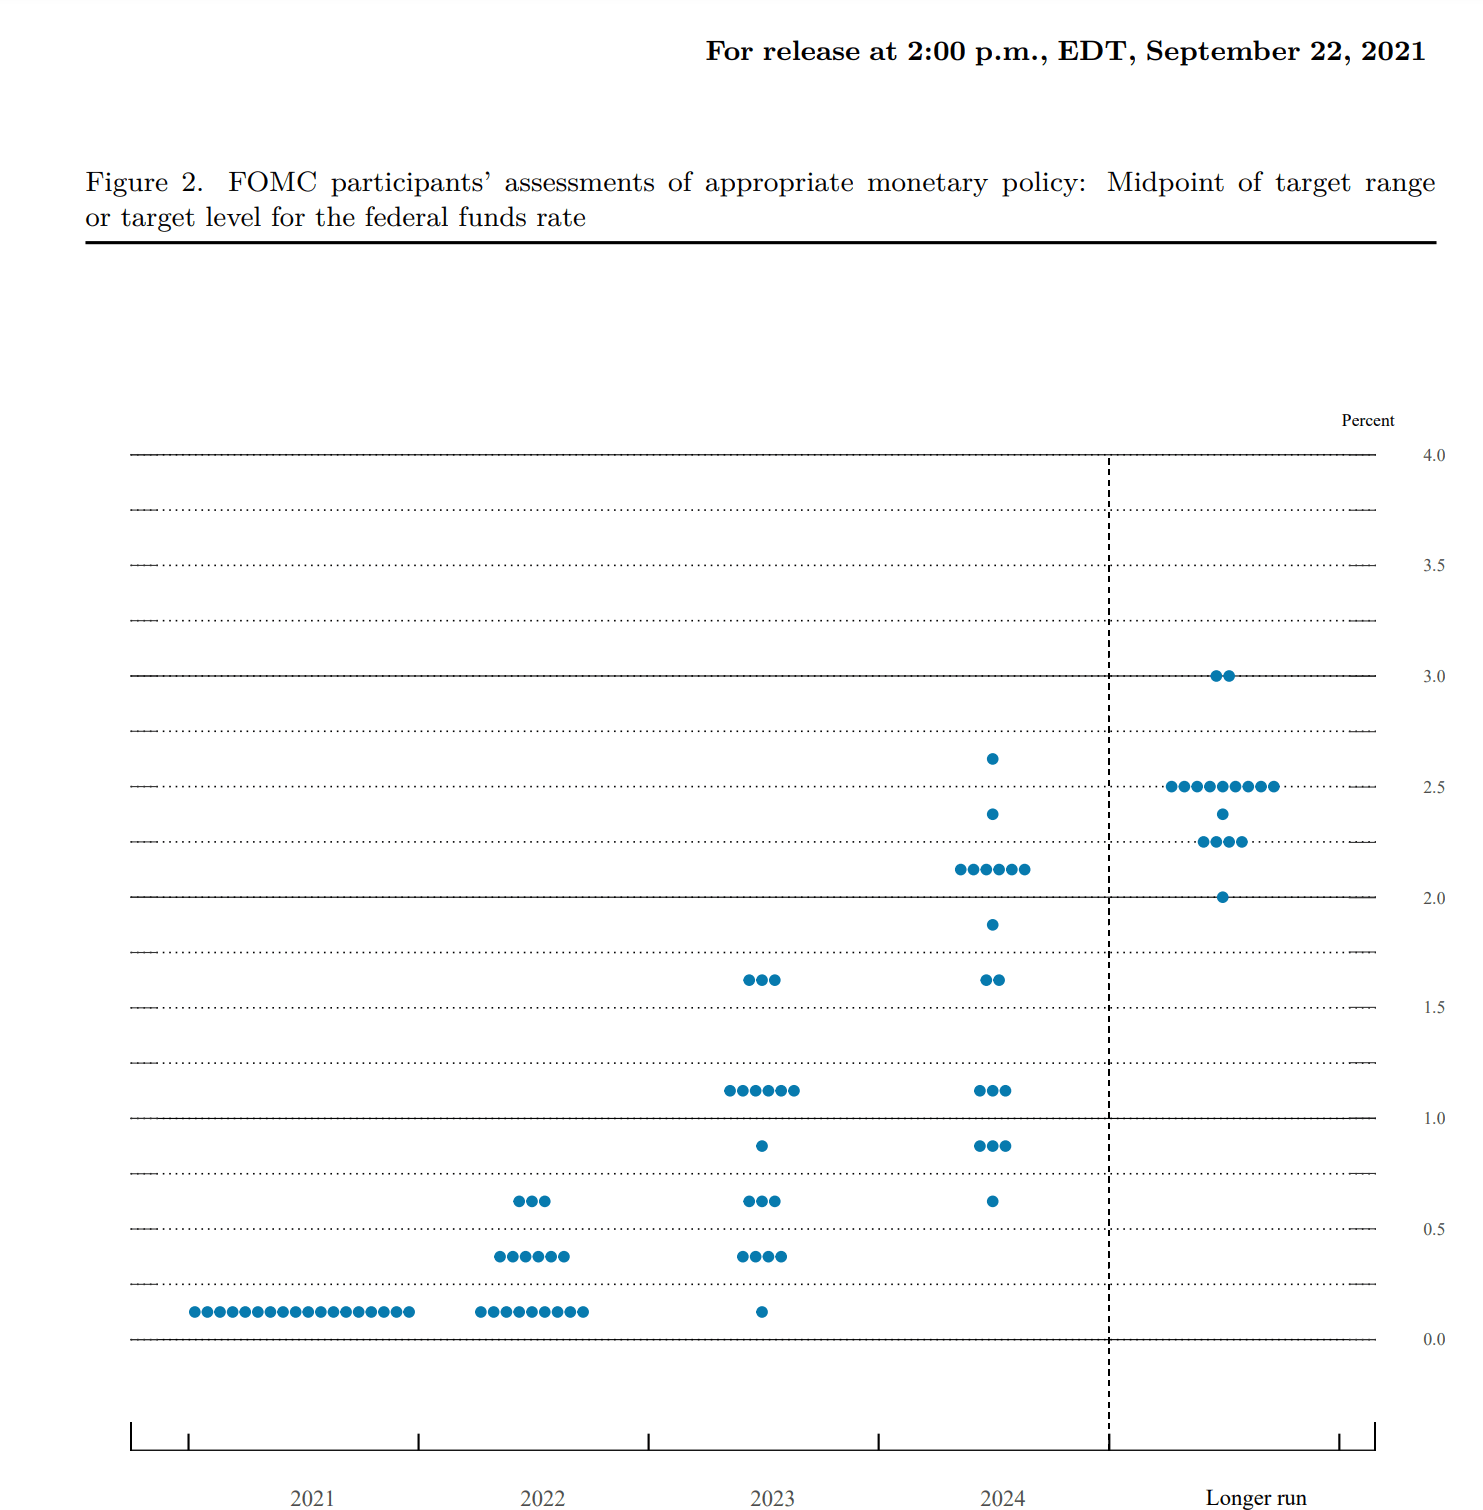
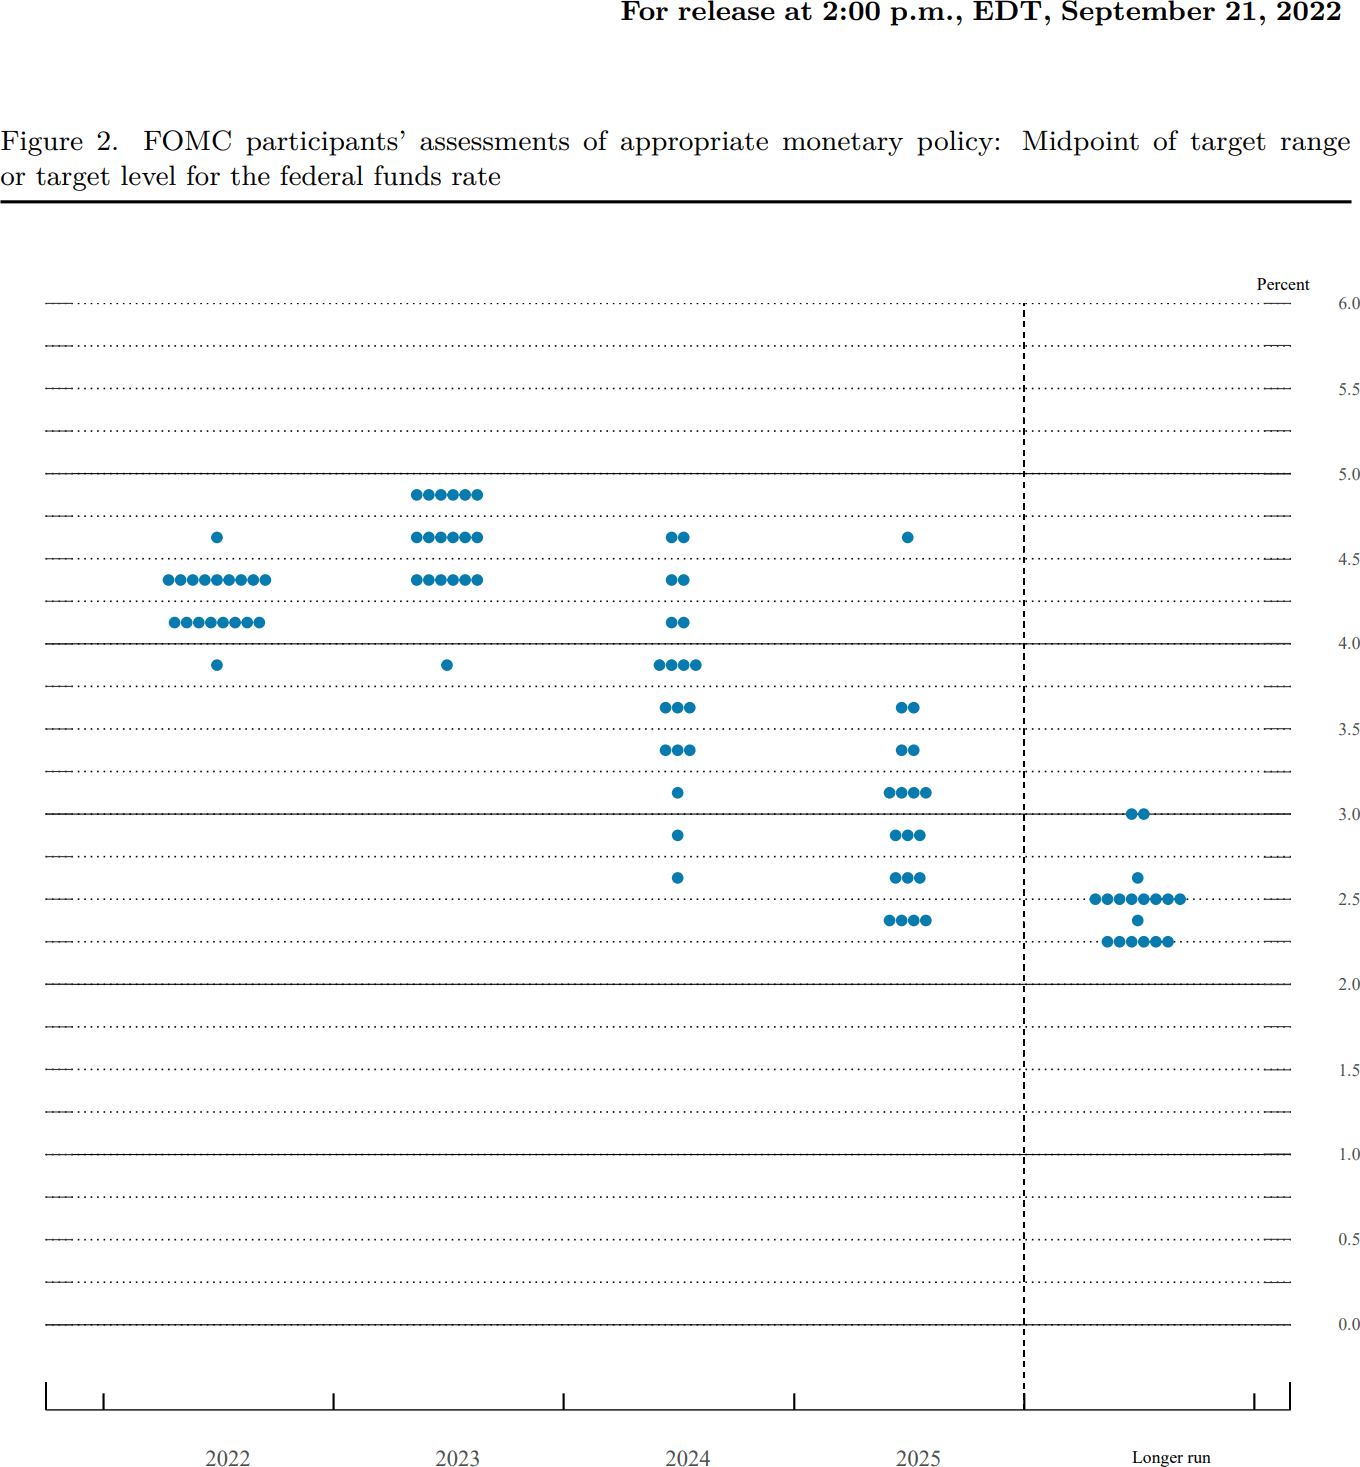
The Federal Open Market Committee (FOMC) members are often wrong about the outlook for interest rates and can change their views quickly. In September 2021, the Federal Reserve produced a “dot-plot” showing the expectations of voting FOMC members for future interest rates.14 The plot is shown below. In September 2021, not a single member of the FOMC expected interest rates to be above 0.75% at the end of 2022.
The latest “dot-plot”, from the September 2022 meeting can be seen below.15 As you can see, FOMC members now believe something completely different. The top expectation for interest rates at the end of 2022 is now 5%, a 4.25% difference from the top expectation a year ago. I believe that FOMC members are intelligent and hard-working people who want to do a good job, but we should not take their interest rate projections too seriously, as they almost always tend to be backward looking and reactive. If the outlook for inflation materially weakens, so will the interest rate projections of FOMC members.
The U.S. economy is doing fine, and stock valuations are not high. There is a lot of talk about the U.S. economy entering a recession, and how interest rate increases from the Federal Reserve will kill the stock market. People seem to have forgotten that stock markets almost always go UP during periods when the Federal Reserve is increasing interest rates.16 As I have said before, I expect a slowdown in the economy but not necessarily a recession. History is full of slowdowns in the rate of economic growth especially in response to tightening monetary conditions.
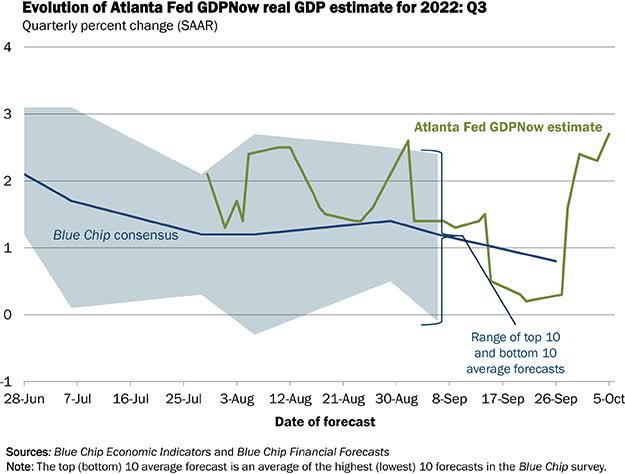
If the data changes, I will change my mind, but for now it appears that the U.S. economy is strong and growing. The data from the Atlanta FED “GDP Now” confirms this, as can be seen below, and now stands at an estimated 2.7% growth in Q3 2022.
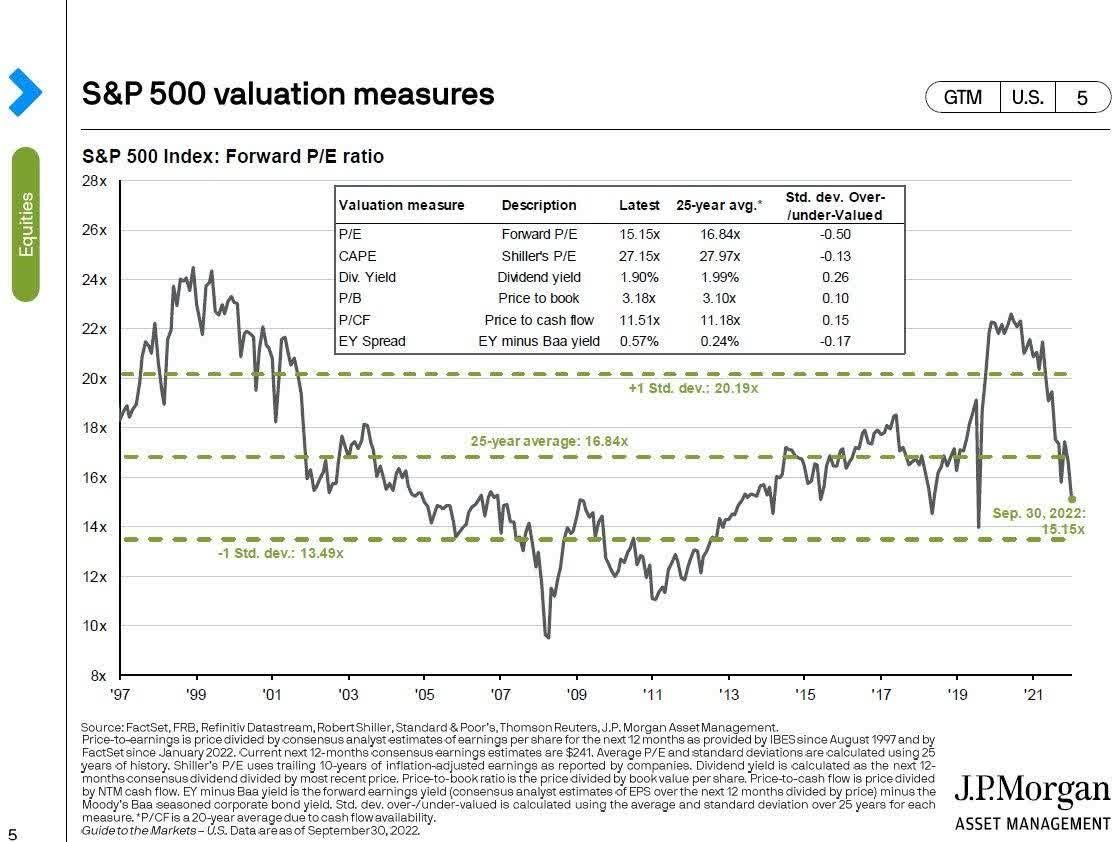
Finally, it is worth looking at valuations. Whether you look at forward valuations or trailing valuations, they are within historical norms. One might question what the “right” valuation for the S&P500 is given rising interest rates. Yet today’s trailing valuation for the S&P 500 is a bit under 19x, not materially different than it was during 2005-2006 (a period when the Federal Reserve had already raised rates to over 5%).17 Forward valuations also have come down dramatically and are reasonable, as seen in the graph below.
In conclusion, I believe we can expect very strong returns from the stock market overall in the days and weeks ahead. I believe that the weight of the evidence supports a view that stocks are more likely to rise than fall in the next few weeks. Most importantly, we continue to be invested in high quality companies that are delivering record earnings across the board.
Negative investor sentiment coupled with deeply negative investor positioning can create a scenario where any good news can trigger a large rally in the stock market. Our portfolio is positioned to outperform in such a scenario.
Thank you for your patience and support in these volatility times. I am always available to answer any questions you may have.
Lukasz Tomicki, Portfolio Manager, LRT Capital
Footnotes1 The portfolio has already recovered substantially, as of October 4th, 2022. 2 AAII Investor Sentiment Survey | AAII 3 Micron Technology, 8-k earnings, September 29th, 2022. 4 Source: Goldman Sachs 5 Source: Bloomberg 6 10-Year Breakeven Inflation Rate 7 Home prices cooled in July at the fastest rate in the history of S&P Case-Shiller Index 8 FHFA House Price Index Down 0.6 Percent in July; Up 13.9 Percent from Last Year 10 The U.S. Rental Housing Market is Cooling Off Fast 11 Used Car Prices Have Fallen for 4 Months Straight 12 Source: Bloomberg, September 30th, 2022 13 Source: Institute for Supply Management, September 2022. 14 https://www.federalreserve.gov/monetarypolicy/files/fomcprojtabl20210922.pdf 15 https://www.federalreserve.gov/monetarypolicy/files/fomcprojtabl20220921.pdf 16 See the tightening cycles of the early 1990s, late 1990s, mid-2000s and mid-2010s as examples. |
Appendix I: Attributions and Holdings as of 9/1/2022
|
LRT Economic Moat |
Portfolio Statistics |
||||
|
Top Holdings (%) |
Sector Allocations (Long Exposure) |
||||
|
Northrop Grumman Corporation (NOC) |
5.38 |
Sector |
Portfolio |
S&P 500 |
Delta |
|
Marriott International, Inc. (MAR) |
4.76 |
Consumer Cyclical |
27.03 |
11.27 |
15.76 |
|
Domino’s Pizza, Inc. (DPZ) |
4.52 |
Industrials |
21.78 |
8.35 |
13.43 |
|
Asbury Automotive Group, Inc. (ABG) |
4.05 |
Healthcare |
10.28 |
14.41 |
(4.13) |
|
Progressive Corp. (PGR) |
3.96 |
Technology |
9.81 |
25.28 |
(15.47) |
|
Texas Pacific Land Trust (TPL) |
3.89 |
Financial Services |
7.21 |
12.76 |
(5.55) |
|
Murphy USA Inc. (MUSA) |
3.83 |
Real Estate |
6.33 |
2.89 |
3.44 |
|
Public Storage (PSA) |
3.34 |
Communication Services |
4.98 |
8.42 |
(3.44) |
|
Deere & Company (DE) |
3.19 |
Basic Materials |
4.71 |
2.22 |
2.49 |
|
Booking Holdings Inc. (BKNG) |
3.13 |
Consumer Defensive |
3.98 |
7.03 |
(3.05) |
|
Top Holdings Total |
40.05 |
Energy |
3.89 |
4.38 |
(0.49) |
|
Utilities |
– |
2.99 |
(2.99) |
||
|
Hedges (%) |
Market Cap Allocations (%) |
||||
|
Vanguard Mid-Cap ETF (VO) |
-12.84 |
Large |
37.86 |
||
|
Vanguard Small-Cap ETF (VB) |
-11.78 |
Mid |
53.25 |
||
|
iShares Core S&P Mid-Cap (IJH) |
-11.54 |
Small |
8.89 |
||
|
SPDR S&P MidCap 400 ETF (MDY) |
-11.54 |
||||
|
iShares Russell 2000 (IWM) |
-11.12 |
||||
|
iShares Core S&P Small-Cap (IJR) |
-10.99 |
||||
|
Return Attribution (%) |
Country Allocations (%) |
||||
|
Long Equity |
-16.29 |
United States |
93.89 |
||
|
Hedges |
8.87 |
Canada |
3.87 |
||
|
Unlevered Gross Return |
-7.42 |
Denmark |
2.24 |
||
|
Leveraged Gross Return |
-20.41 |
||||
|
Net Return |
-20.49 |
||||
|
Source: Morningstar, Sentieo. Numbers may not add up due to rounding. Net returns are net of a hypothetical 1% annual management fee (charged quarterly) and 20% annual performance fee. Individual account results may vary due to the timing of investments and fee structure. Please consult your statements for exact results. Please see the end of this letter for additional disclosures. |
Appendix II: Investment Philosophy
Over the past 36 months, we saw a large increase in the number of LRT Capital partners (the term we use to describe our clients). With so many newcomers, it is important that we write about our investment philosophy again.
Here are the key points:
- Exceptional stock returns come from exceptional business returns on a per-share basis.
- We seek to invest in high-quality companies, i.e., those possessing sustainable competitive advantages (moats), the ability to grow and reinvest capital over time, and management that excels at capital allocation.
- We only purchase companies whose shares trade at a discount to our assessment of their intrinsic value.
- It is futile to predict short-term market movements. We seek to hold our investments for as long as possible.
- The financial markets are dominated by short-term traders who see stocks as casino chips. This occasionally allows us to purchase shares in great companies at large discounts to their true worth.
- If we are right about the trajectory of the businesses we invest in, over time, we will be right on the trajectory of their stock prices.
We view stock market volatility as a source of opportunity. Volatility allows us to profit by acquiring shares in superb businesses at attractive prices. The more that markets (the “other” participants) are irrational, the more likely we are to reach our ambitious performance objectives.
In the long run, stocks are the best investment asset class, but our experience has taught us that our investment process will not generate linear returns. In some years, our portfolio will outperform, and in others, it will generate a below average return. This is a certainty that we must accept. We are long-term investors and we do not try to dance in and out of the market.
In summary, our investment strategy can be summed up in three steps:
- Only seek out high-quality companies.
- Do not overpay.
- Do nothing – patience and discipline are the keystones to success.
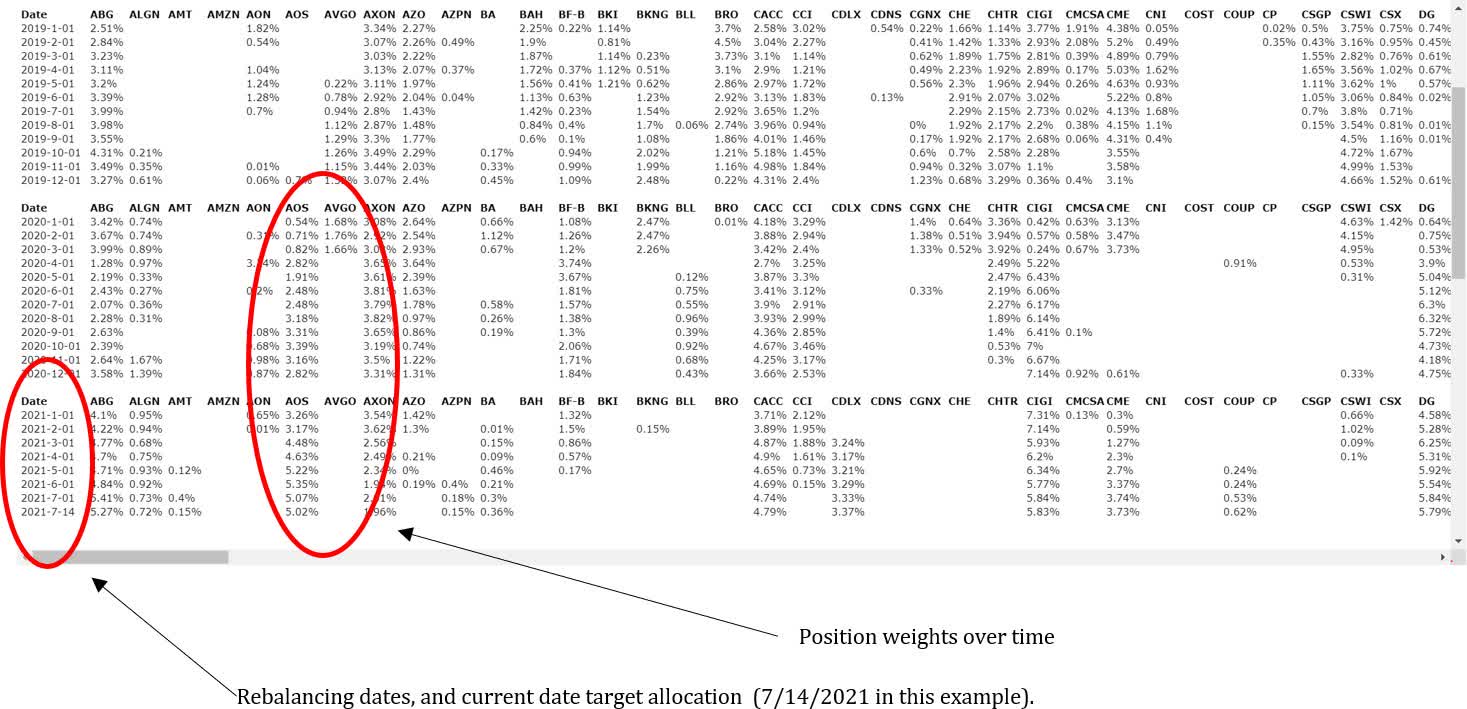
Appendix III: Portfolio Construction Software Overview
LRT separates the discretionary and qualitative process of selecting the equity holdings from the portfolio construction process which is systematic and quantitative.
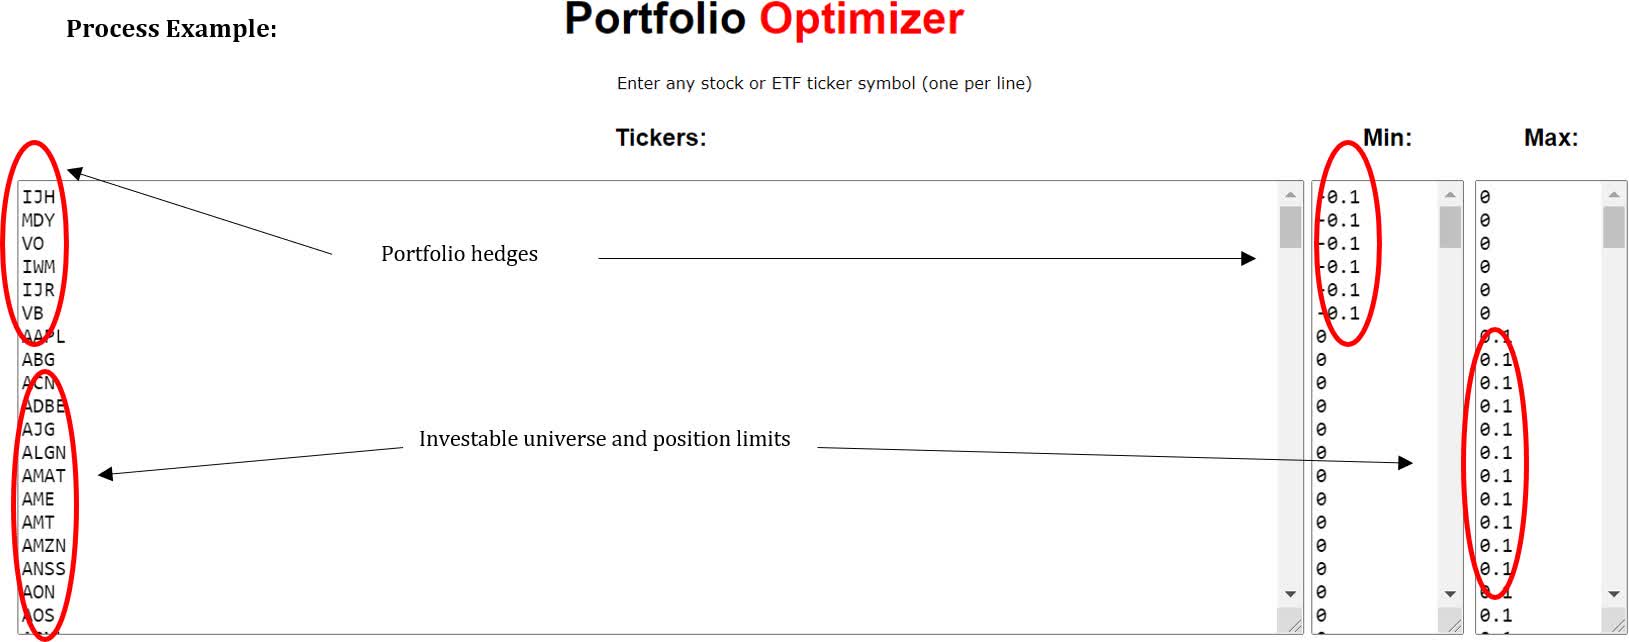
Our quantitative process considers each position’s contribution to portfolio volatility, contribution of idiosyncratic vs. systematic risk and portfolio factor (size, value, quality, momentum, vol, etc.) exposures.
The system outputs target portfolio weighs for each position. We trade mechanically to rebalance the portfolio each month to the targeted exposures. This eliminates emotions, human biases, and overconfidence risk.
Example system output:
DisclaimerLRT Capital Management, LLC is an Exempt Reporting Adviser with the Texas State Securities Board, CRD #290260. Past returns are no guarantee of future results. Results are net of a hypothetical 1% annual management fee (charged quarterly) and 20% annual performance fee. Individual account returns may vary based on the timing of investments and individual fee structure. The forward-looking statements and projections in this memorandum are based on our current beliefs and assumptions as of the date of this presentation and are based on information currently available that we believe to be reasonable. Such statements are not a promise or guarantee about future events. You should not put undue reliance on any of these statements. This memorandum and the information included herein is confidential and is intended solely for the information and exclusive use of the person to whom it has been provided. It is not to be reproduced or transmitted, in whole or in part, to any other person. Each recipient of this memorandum agrees to treat the memorandum and the information included herein as confidential and further agrees not to transmit, reproduce, or make available to anyone, in whole or in part, any of the information included herein. Each person who receives a copy of this memorandum is deemed to have agreed to return this memorandum to the General Partner upon request. Investment in the Fund involves significant risks, including but not limited to the risks that the indices within the Fund perform unfavorably, there are disruption of the orderly markets of the securities traded in the Fund, trading errors occur, and the computer software and hardware on which the General Partner relies experiences technical issues. All investing involves risk of loss, including the possible loss of all amounts invested. Past performance may not be indicative of any future results. No current or prospective client should assume that the future performance of any investment or investment strategy referenced directly or indirectly herein will perform in the same manner in the future. Different types of investments and investment strategies involve varying degrees of risk—all investing involves risk—and may experience positive or negative growth. Nothing herein should be construed as guaranteeing any investment performance. We do not provide tax, accounting, or legal advice to our clients, and all investors are advised to consult with their tax, accounting, or legal advisers regarding any potential investment. For a more detailed explanation of risks relating to an investment, please review the Fund’s Private Placement Memorandum, Limited Partnership Agreement, and Subscription Documents (Offering Documents). This report is for informational purposes only and does not constitute an offer to sell, solicitation to buy, or a recommendation for any security, or as an offer to provide advisory or other services in any jurisdiction in which such offer, solicitation, purchase, or sale would be unlawful under the securities laws of such jurisdiction. Any offer to sell is done exclusively through the Fund’s Private Placement Memorandum. All persons interested in subscribing to the Fund should first review the Fund’s Offering Documents, copies of which are available upon request. The information contained herein has been prepared by the General Partner and is current as of the date of transmission. Such information is subject to change. Any statements or facts contained herein derived from third-party sources are believed to be reliable but are not guaranteed as to their accuracy or completeness. Investment in the Fund is permitted only by “accredited investors” as defined in the Securities Act of 1933, as amended. These requirements are set forth in detail in the Offering Documents. |
Editor’s Note: The summary bullets for this article were chosen by Seeking Alpha editors.
Be the first to comment