

Canadian Dollar, USD/CAD, Loonie Talking Points
- The USD/CAD breakout has finally calmed after buyers stepped-back from a test of the 17-year-high.
- The US Dollar has gained more than 8% in the past few weeks; USD/CAD has been up by as much as 9.2%.
- As USD/CAD tests long-term resistance, short-term strategies may find bullish potential as the 1.4500 level looms large.
USD/CAD Finally Finds Some Resistance – but Can it Hold?
The rampage in the US Dollar has finally found some element of pullback after an extreme two-week outlay that saw the Greenback surge by more than 8%. In USD/CAD, that USD-strength was meshed up with CAD weakness, exacerbating the bullish move in the pair as USD/CAD ran-up by more than 9.2% over the same period of time.
CAD-weakness has been showing for most of 2020 trade, so far. USD/CAD came into the year after pushing below the 1.3000 level to finish off 2019 trade; but what started as a pullback in the bearish theme soon took on the tone of a full-on reversal; and that strength in USD/CAD remained a fairly persistent driver for much of the time since. The open a couple of weeks ago saw USD/CAD gap above the psychological level at 1.3500; and buyers continued to push without that gap completely filling.

Recommended by James Stanley
Building Confidence in Trading
The breakout has since continued up to a near-test of the 17-year-high at 1.4690. Buyers have so far shied away from a re-test at this level; but given persistence from bulls combined with shorter-term chart setups, a showdown may soon be in the cards. Current resistance is showing around a key spot on the chart taken from the 1.4500 psychological level, which is confluent with the 76.4% retracement of the 2002-2007 major move.
USD/CAD Monthly Price Chart
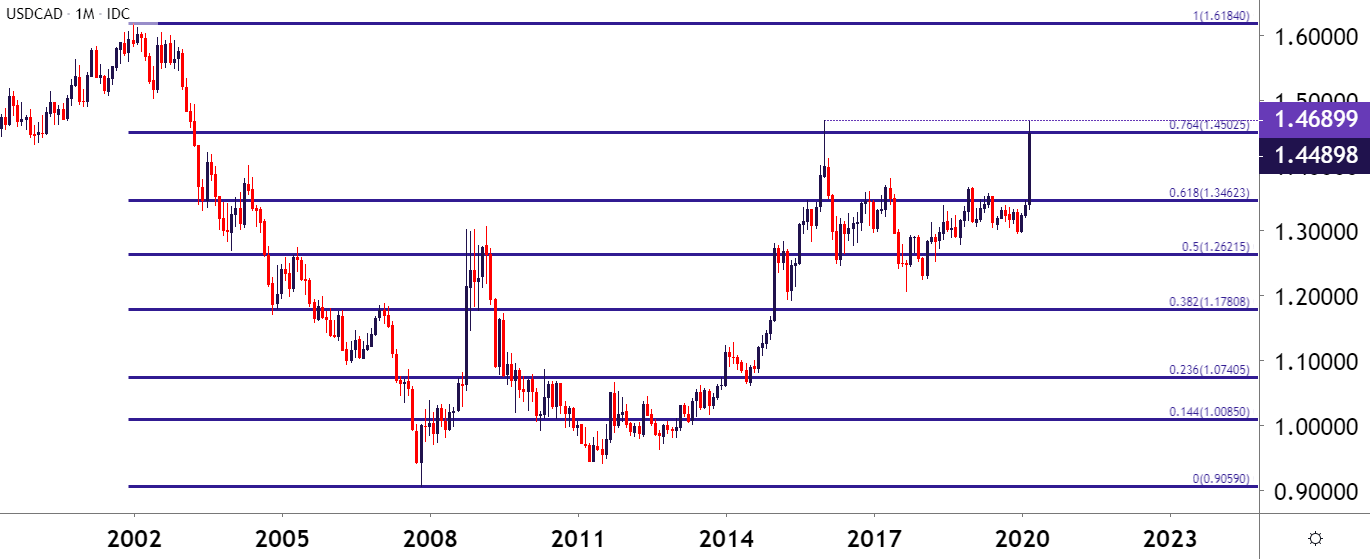
Chart prepared by James Stanley; USDCAD on Tradingview
The reason for current resistance appears to be fairly clear: A stretched move pulled up just shy of a significant swing-high, and the move was fairly overbought before prices began to turn. That 17-year-high, combined with the 1.4500 psychological level, have since come into play to help hold buyers at bay.
Starts in:
Live now:
Mar 26
( 17:03 GMT )

James Stanley’s Thursday Webinar
Trading Price Action
From the Daily chart, the importance around the 1.4500 level becomes fairly clear as we’ve now seen five consecutive days of seller reaction here.
USD/CAD Daily Price Chart
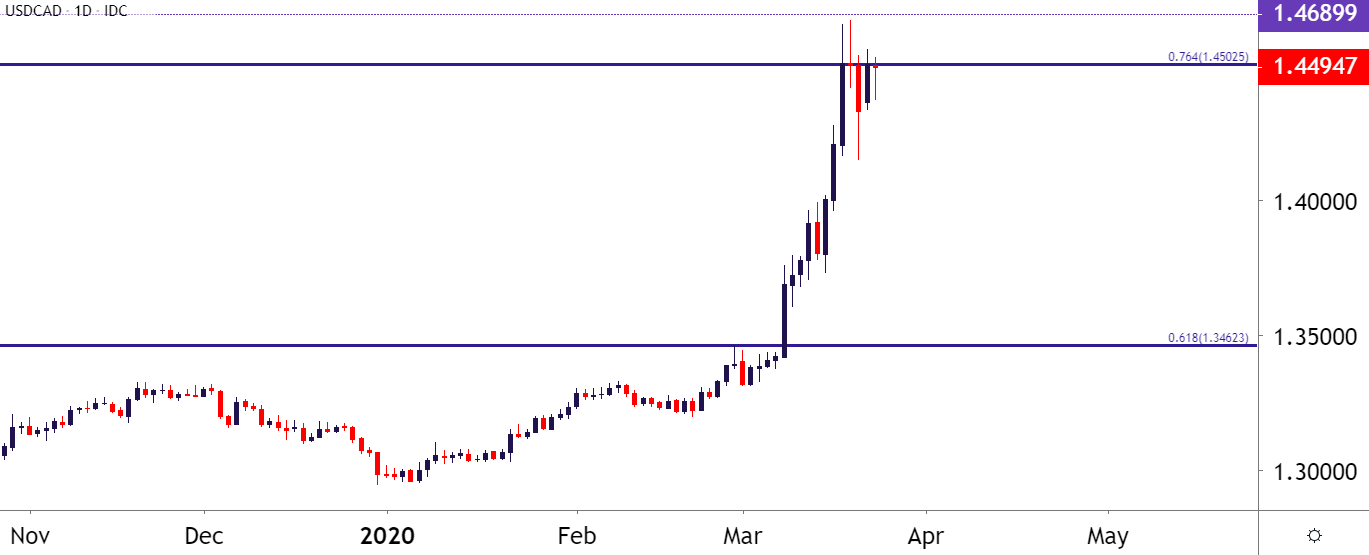
Chart prepared by James Stanley; USDCAD on Tradingview
USD/CAD – Bull Pennant Potential
While the Daily chart above may open the door for swing or reversal strategies focusing on a pullback; going even shorter-term brings back the prospect of bullish potential, as the five-day-hold of that resistance has brought in a series of lower-highs that’s coupled with an observation of higher-lows. This produces a short-term symmetrical wedge formation that, when taken in consideration of the prior bullish move, creates a bull pennant formation. Such a backdrop will often be approached with the aim of bullish continuation.
| Change in | Longs | Shorts | OI |
| Daily | -12% | 15% | 7% |
| Weekly | 0% | 20% | 14% |
USD/CAD Two-Hour Price Chart
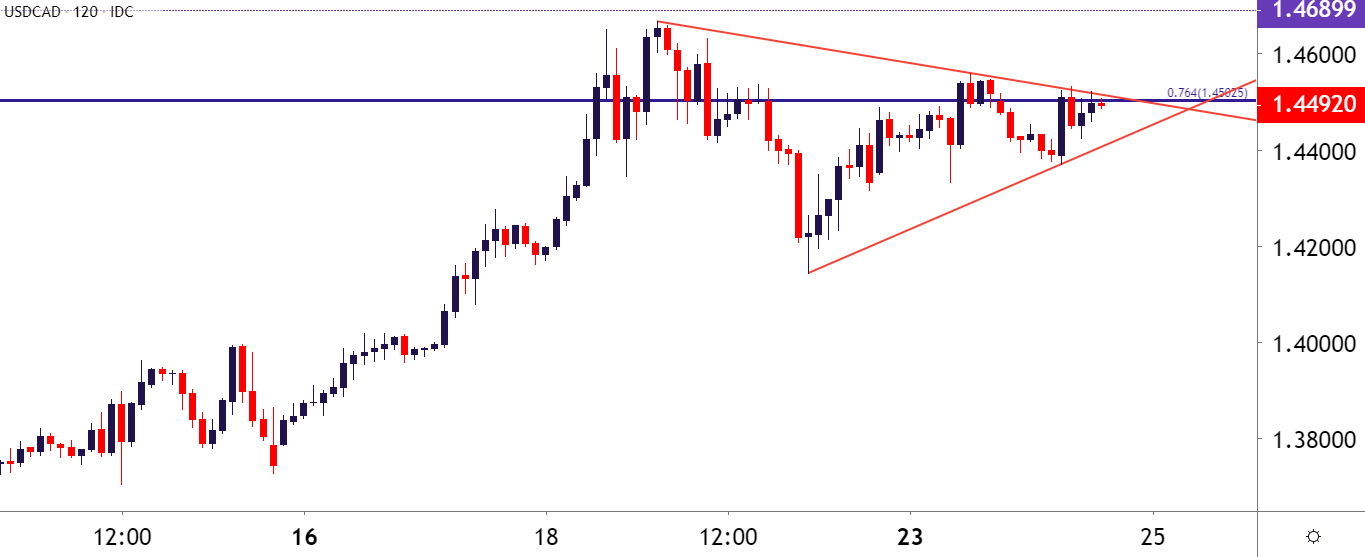
Chart prepared by James Stanley; USDCAD on Tradingview
— Written by James Stanley, Strategist for DailyFX.com
Contact and follow James on Twitter: @JStanleyFX
Be the first to comment