

Canadian Dollar, Loonie, USD/CAD Talking Points:
- USD/CAD put in an aggressive breakout in March, and has since started to pullback.
- That bullish breakout stopped 21 pips shy of the 17-year-high.
- The ensuing snapback has grown in aggression, with price action now testing around the 1.4000 psychological level.
USD/CAD Builds into Descending Triangle After Aggressive Bullish Breakout
The past few weeks have been somewhat of a constant in the bad news department for both US and Canadian economies. The major hit seen in Oil prices has certainly had an impact on the Canadian Dollar, but its been the spread on the novel coronavirus in both countries that’s been really troubling. And from an economic standpoint, it’s a brute force of risk as there’s just so much utter uncertainty around everything, with Central Banks from both the US and Canada hurriedly shuffling in stimulus policies designed to keep markets afloat even with a near-certain economic slowdown on the horizon.
In USD/CAD, this has not gone unnoticed, marked by a pronounced bullish run in the month of March as a potent combination of USD-strength and Canadian Dollar weakness, aided by a massive bearish move in oil prices, pushed the pair up to fresh four-year-highs. USD/CAD pushed up to the 1.4668 level, which is a mere 21 pips away from the 17-year-high in the pair; showing some fairly clear evidence that buyers didn’t yet want to encounter that level just yet.
Starts in:
Live now:
Apr 16
( 17:04 GMT )
James Stanley’s Thursday Webinar
Trading Price Action
USD/CAD Monthly Price Chart
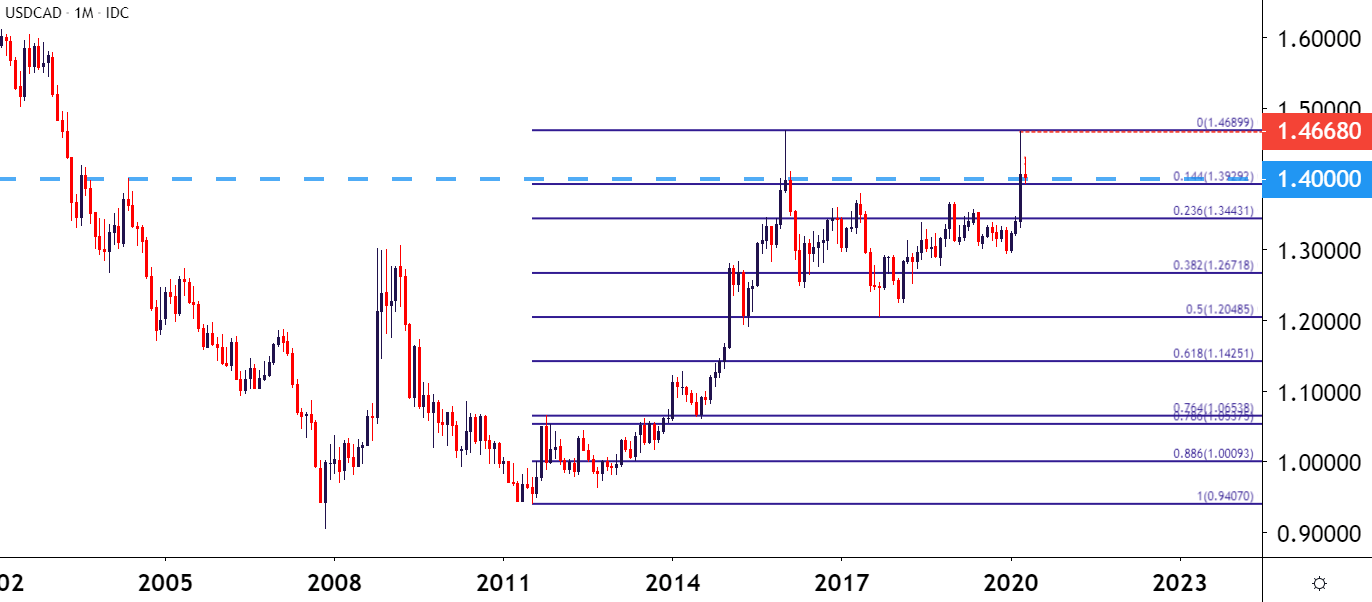
Chart prepared by James Stanley; USDCAD on Tradingview
USD/CAD Driven by a Potent Combination of Drivers
There’s a few key drivers to keep in mind when analyzing anything around USD/CAD. The month of March saw both a strong US Dollar and falling oil prices propel the pair up to those fresh four-year-highs. Of recent and particularly earlier today, both of those themes were facing a bit of pullback: the US Dollar was dropping after yet another stimulus announcement from the Fed while oil prices were gaining on the prospect of production cuts. Oil prices have since begun to fall again, helping USD/CAD to hold support at a key area on the chart, taken from the 14.4% Fibonacci retracement of the 2011-2016 major move.
| Change in | Longs | Shorts | OI |
| Daily | 0% | -7% | -5% |
| Weekly | 3% | 35% | 23% |
This horizontal support, combined with lower-high resistance, takes on the appearance of descending triangle, which will often be approached with the aim of bearish breakouts.
USD/CAD Four-Hour Price Chart
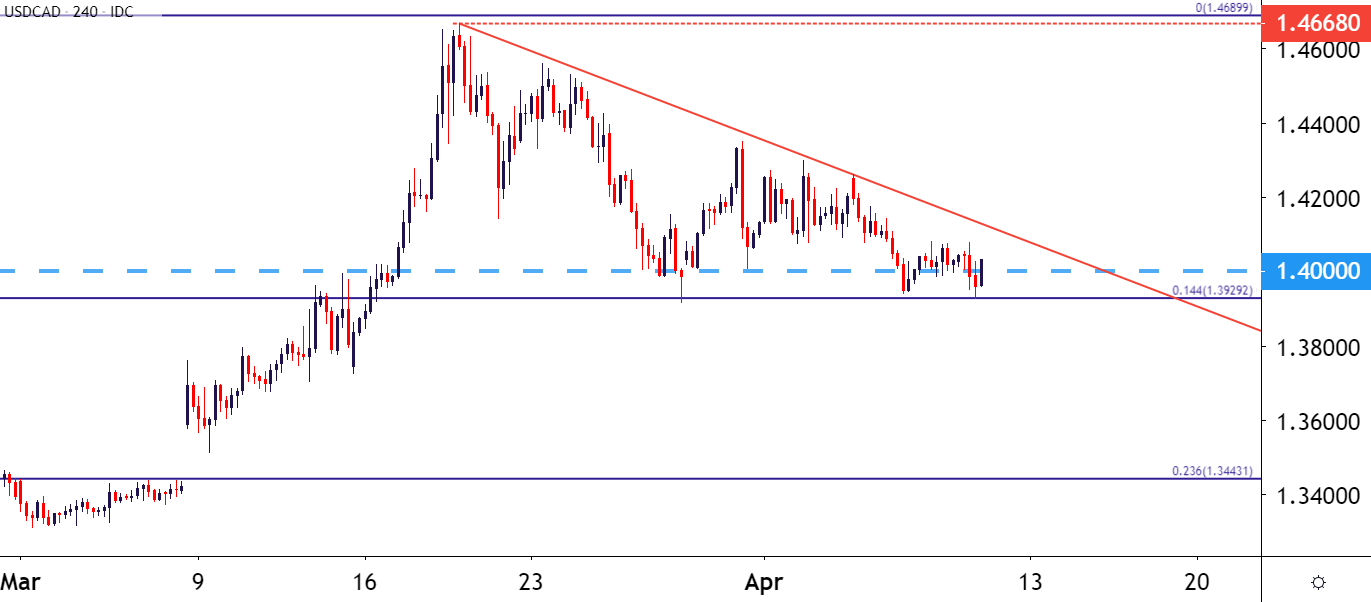
Chart prepared by James Stanley; USDCAD on Tradingview
USD/CAD Rally from Support as Oil Prices Fall – What’s Next?
At this point, price action in USD/CAD is rallying after a hold of support at the above noted Fibonacci level. Prices have moved back above the 1.4000 handle, and fast approaching is an area of prior swing-support-turned-resistance around the 1.4075 level. A hold of resistance in this area can open the door for bearish strategies in the pair, looking for a re-test of the 1.4000 level and, perhaps even the 1.3929 level that’s so far held two support tests over the past couple of weeks. And if that Fibonacci level does give way – there could be a further slide towards the 1.3750 or 1.3500 psychological levels, the latter of which was gapped-through in early-March and, as yet, hasn’t been tested for support since last month’s breakout.
USD/CAD Two-Hour Price Chart
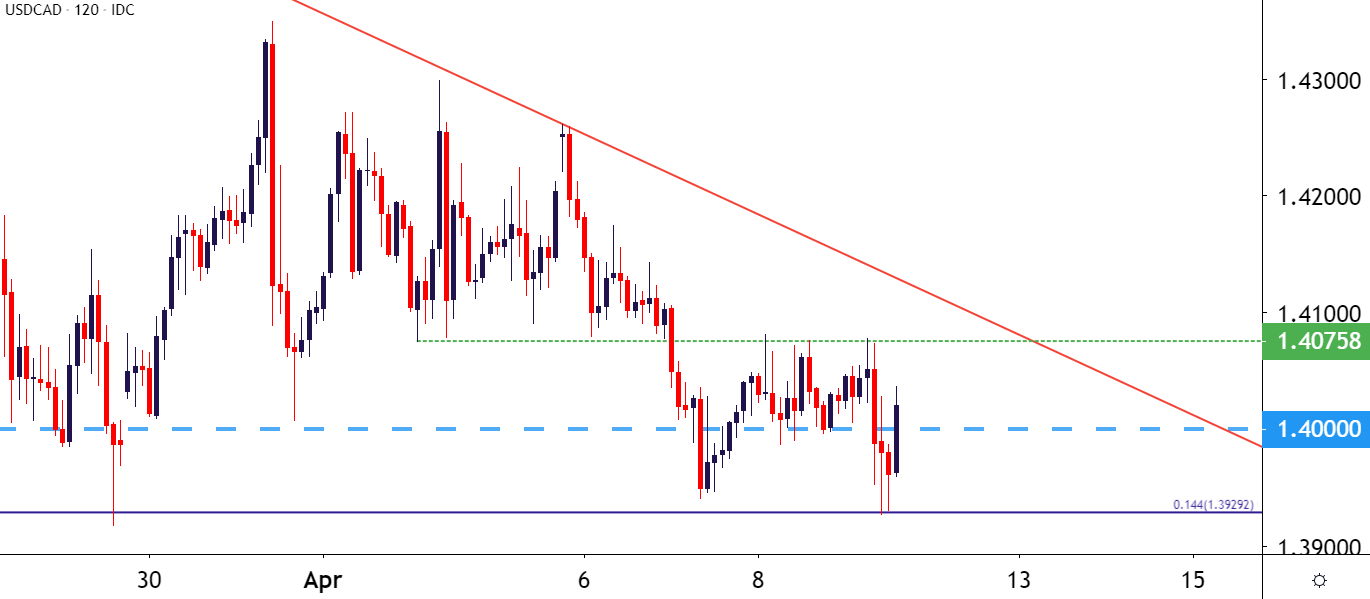
Chart prepared by James Stanley; USDCAD on Tradingview
— Written by James Stanley, Strategist for DailyFX.com
Contact and follow James on Twitter: @JStanleyFX
Be the first to comment