

davidrasmus
Introduction
As I was reviewing my past coverage of Medtronic (NYSE:MDT) stock, it came to my attention that my September 26th, 2019 article “Medtronic: A 10-Year, Full-Cycle Analysis” was the only article with an outright “Sell” rating on the stock on Seeking Alpha since 2012. I always like to follow up on the performance of my previous article suggestions because I tend to be fairly quantitative with my articles. I prefer to have the results of my valuation techniques speak for themselves rather than create stories around the stocks and the businesses. Here is how Medtronic has performed since that 2019 article compared to the S&P 500 (SPY):
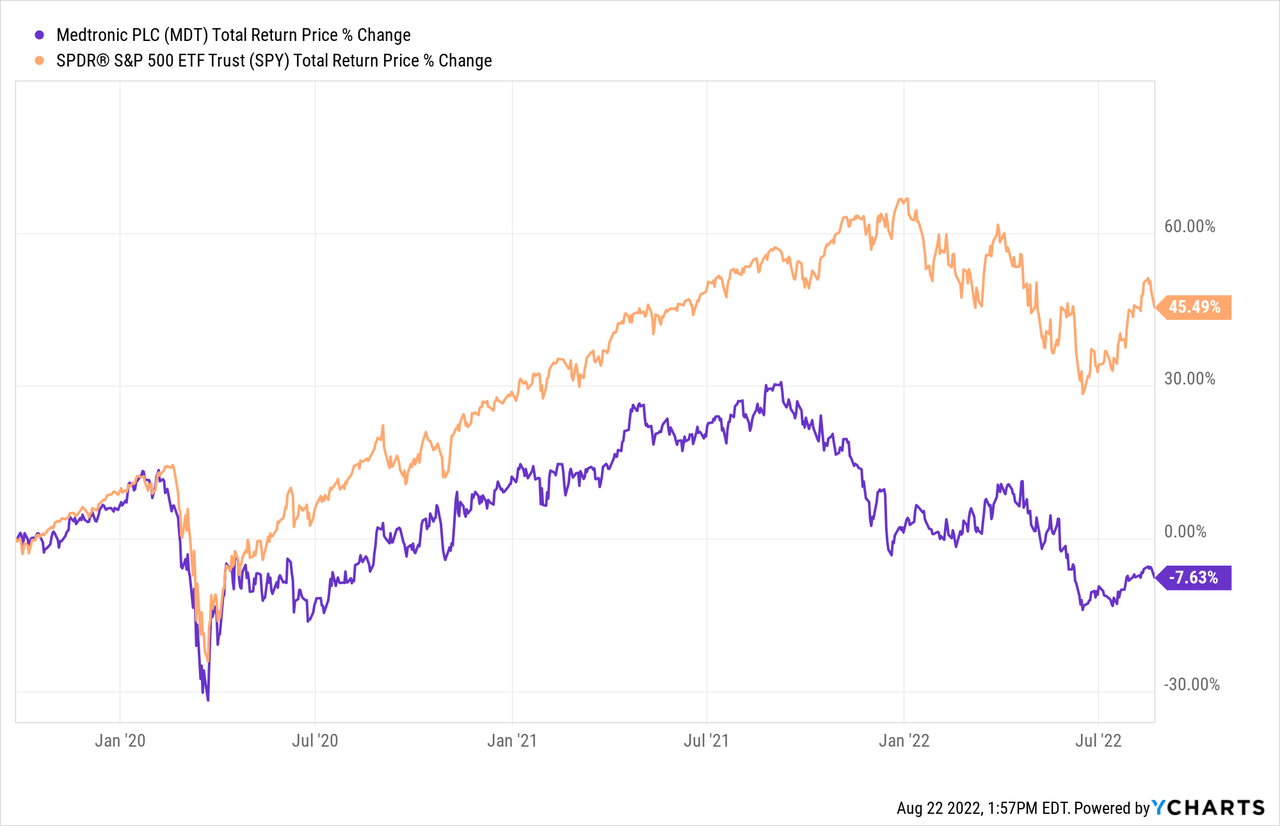
It would appear that three years later, my valuation warning was warranted, with Medtronic stock losing money both in absolute and relative terms.
Earnings have actually risen during this time period, and combined with Medtronic’s price decline, it now seems like a reasonable time to update Medtronic’s valuation analysis to see whether the stock is currently a Buy, Sell, or Hold. I will essentially use the same method in this article that I used back in 2019’s article to warn Medtronic investors about the likelihood of poor future returns.
My Valuation Method For Medtronic
The valuation method I use for Medtronic first checks to see how cyclical earnings have been historically. Once it is determined that earnings aren’t too cyclical, then I use a combination of earnings, earnings growth, and P/E mean reversion to estimate future returns based on previous earnings growth and sentiment patterns. I take those expectations and apply them 10 years into the future, and then convert the results into an expected CAGR percentage. If the expected return is really good, I will buy the stock, and if it’s really low, I will often sell the stock. In this article, I will take readers through each step of this process.
Importantly, once it is established that a business has a long history of relatively stable and predictable earnings growth, it doesn’t really matter to me what the business does. If it consistently makes more money over the course of each economic cycle, that’s what I care about — numbers over stories.
FAST Graphs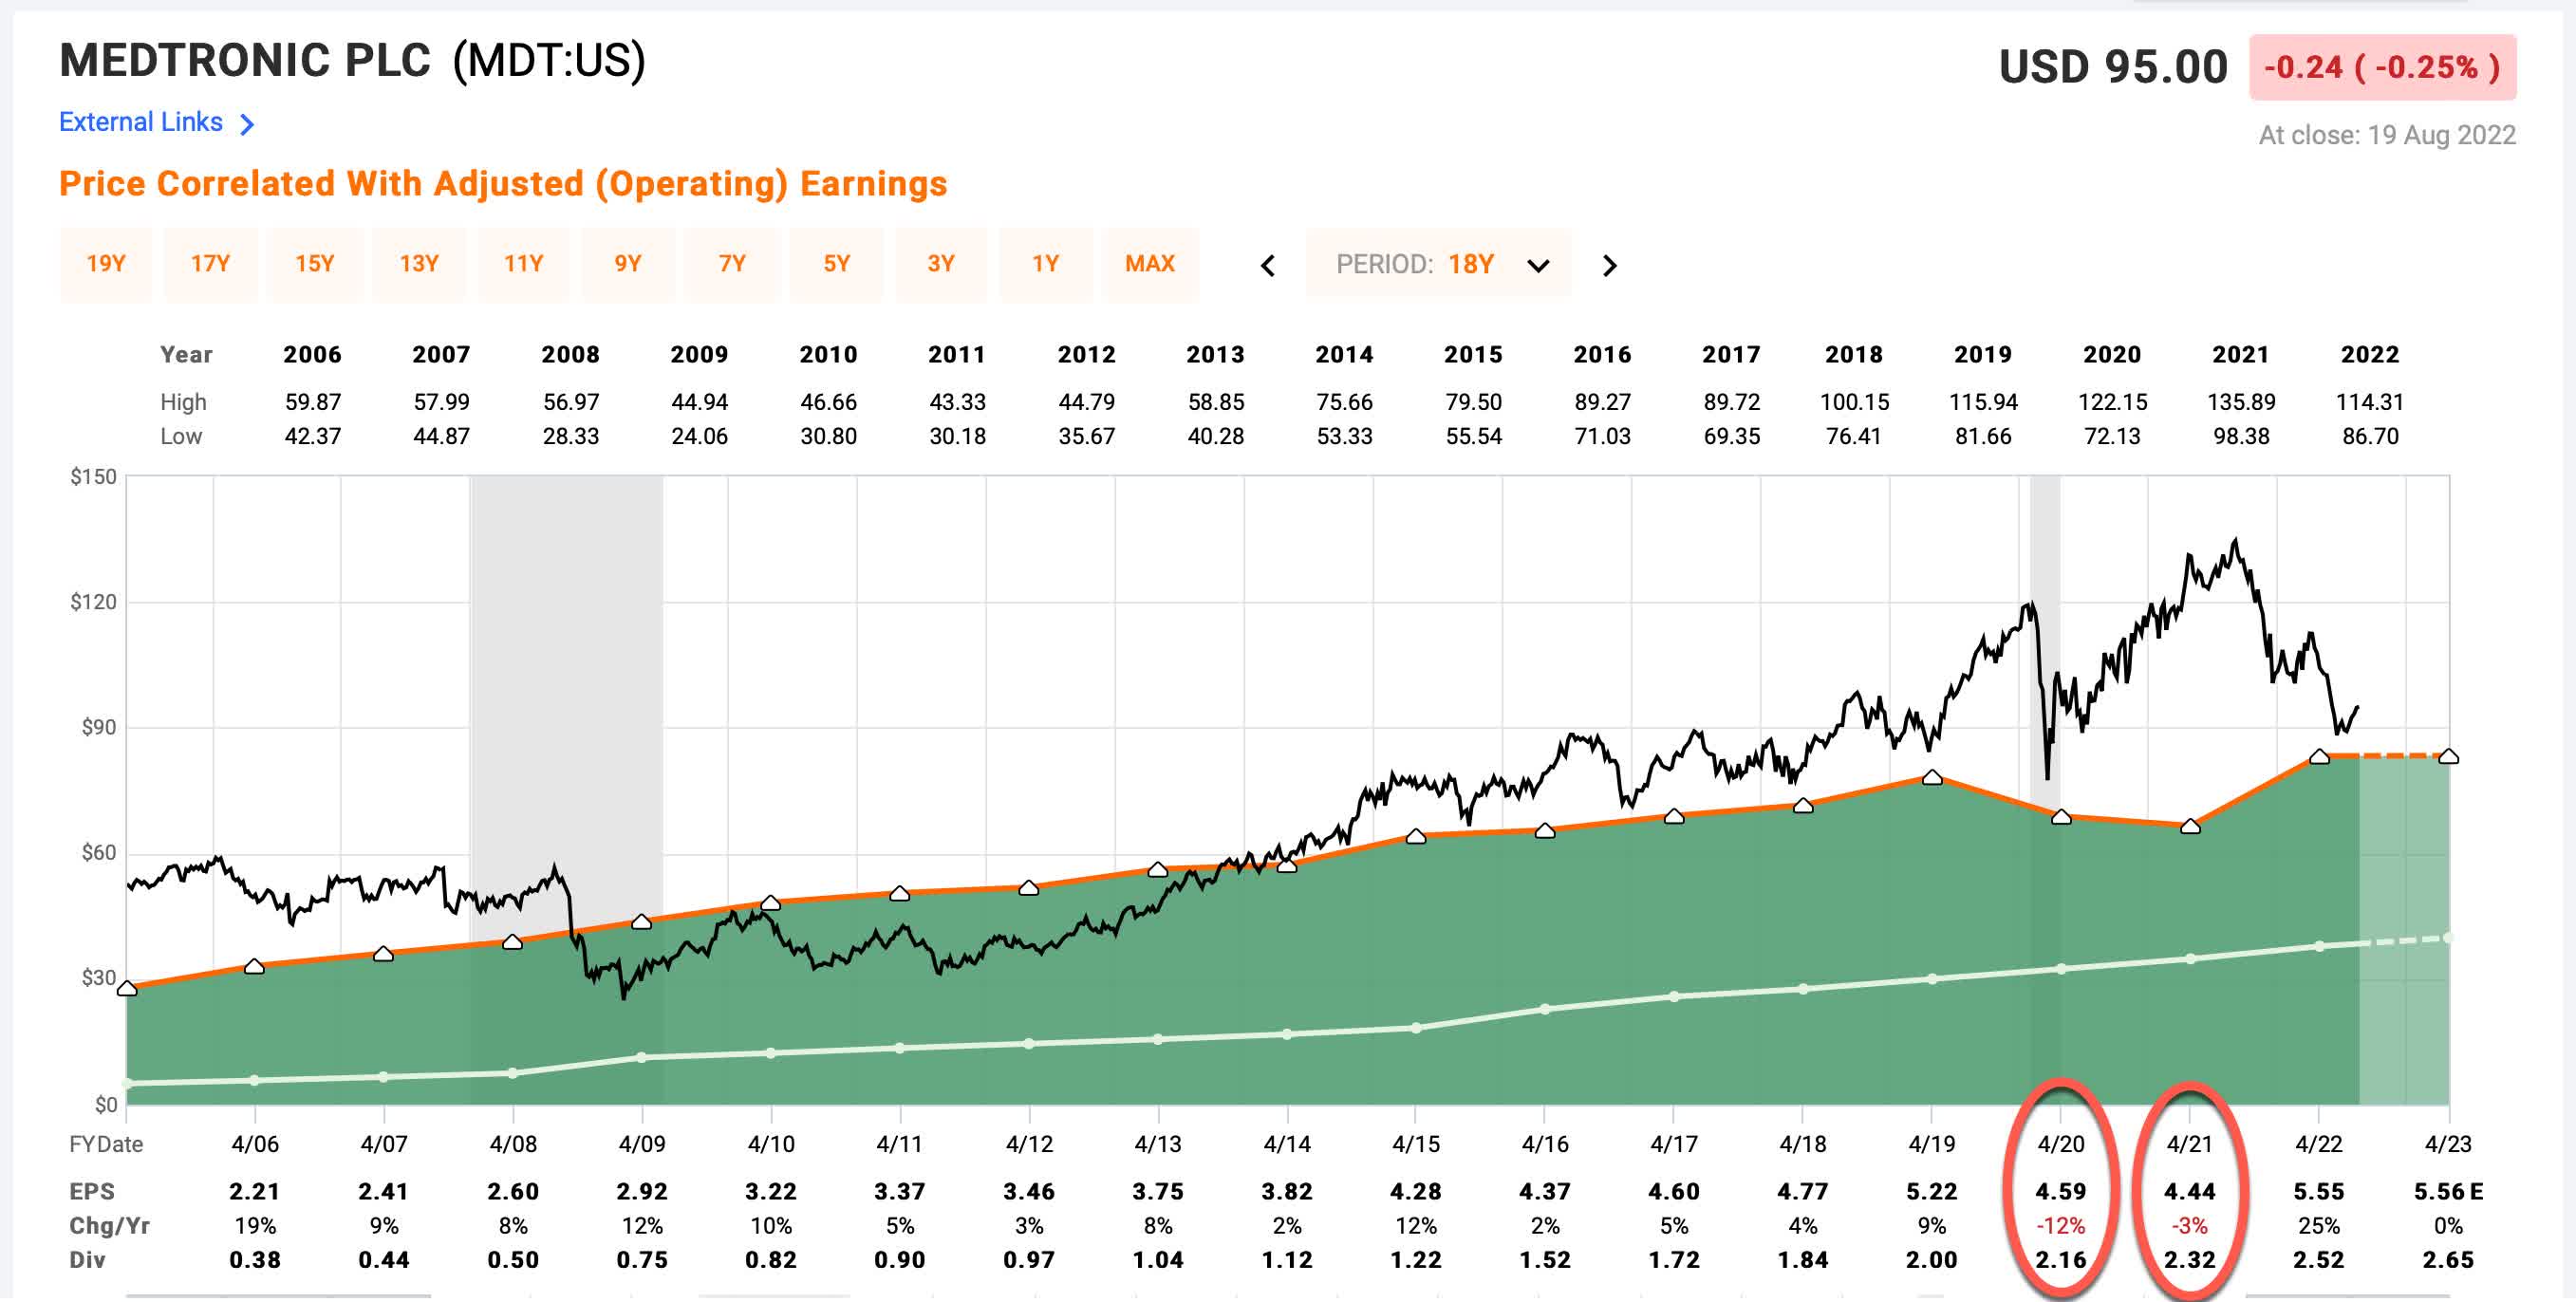
Medtronic’s historical earnings are represented by the dark green shaded area in the FAST Graph above. Up until 2020 and 2021 when we had to contend with COVID, Medtronic had never had a year of negative earnings growth. And even during the COVID years EPS growth really didn’t fall that much, all things considered. Because Medtronic’s earnings are so stable, it is reasonable to use the sort of earnings and earnings growth based analysis I’m going to use in this article. If earnings were more deeply cyclical, then I would use a different approach.
Market Sentiment Return Expectations
In order to estimate what sort of returns we might expect over the next 10 years, let’s begin by examining what return we could expect 10 years from now if the P/E multiple were to revert to its mean from the previous economic cycle. For this, I’m using a period that runs from 2015-2023.
FAST Graphs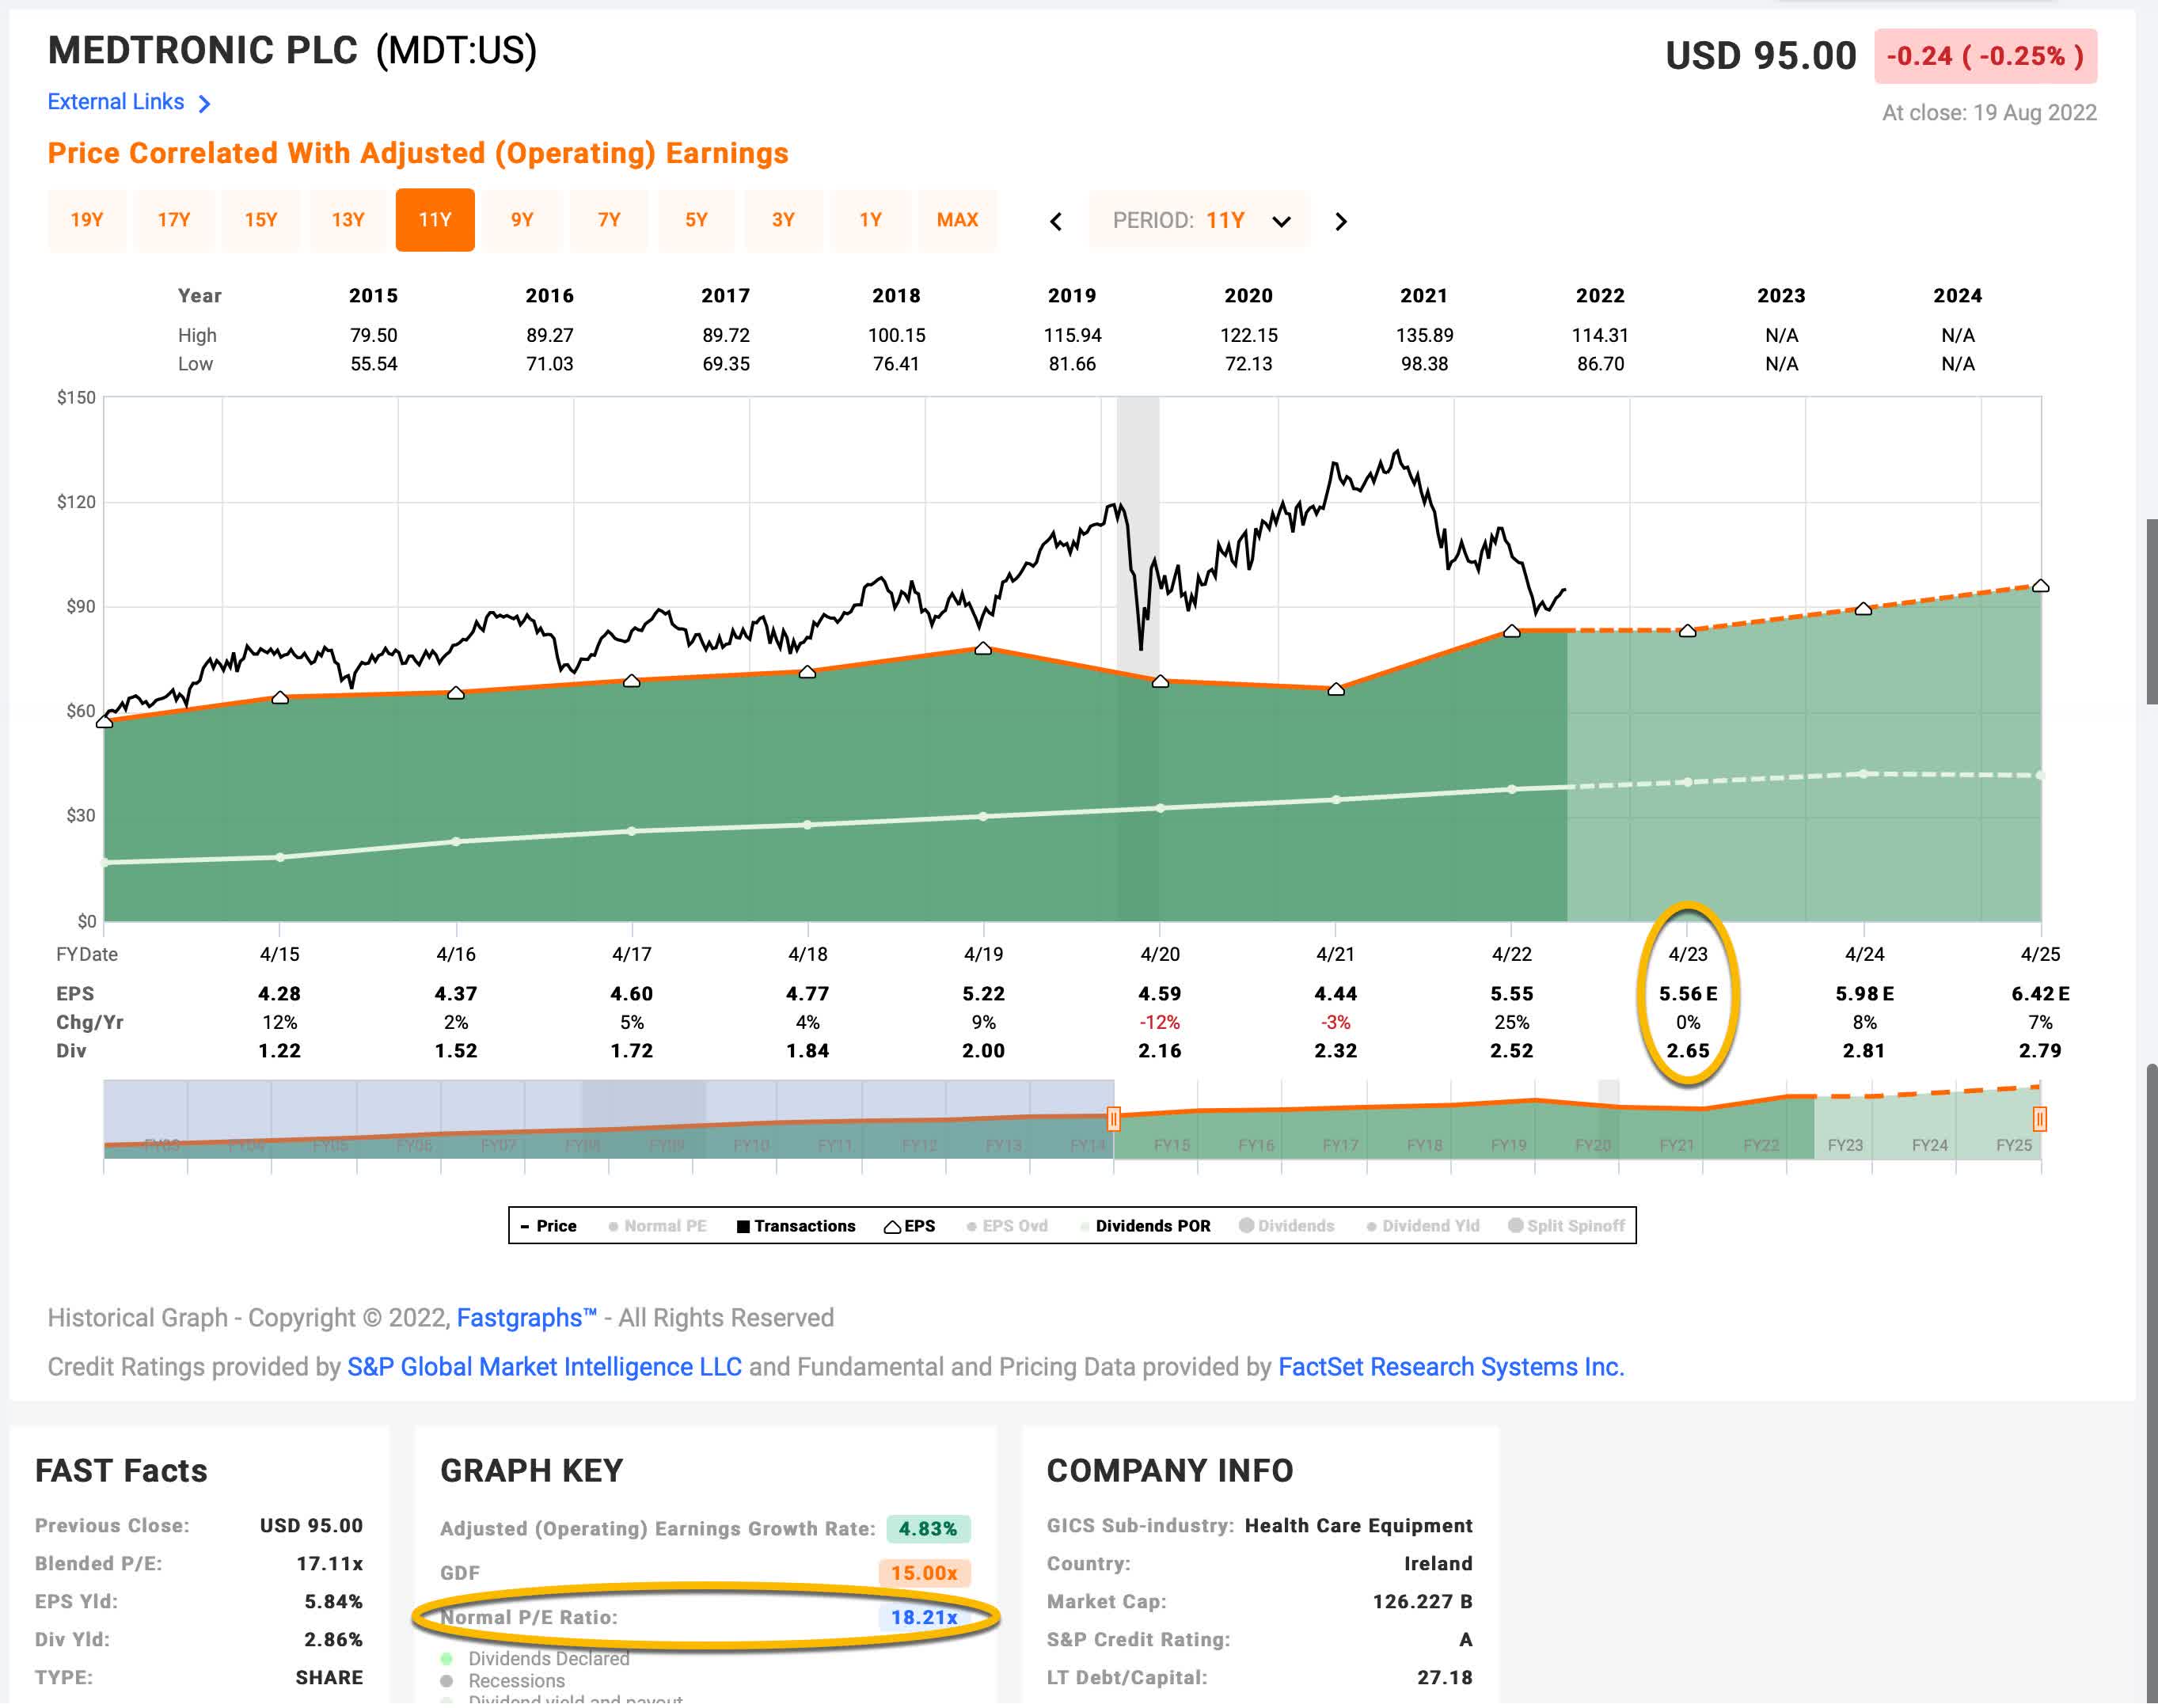
Medtronic’s average P/E from 2015 to the present has been about 18.21 (the blue number circled in gold near the bottom of the FAST Graph). Using 2023’s forward earnings estimates of $5.56 (also circled in gold), MDT has a current P/E of 16.75. If that 16.75 P/E were to revert to the average P/E of 18.21 over the course of the next 10 years and everything else was held the same, MDT’s price would rise and it would produce a 10-Year CAGR of +0.97%. That’s the annual return we can expect from sentiment mean reversion if it takes 10 years to revert. If it takes less time to revert, the return would be higher.
Business Earnings Expectations
We previously examined what would happen if market sentiment reverted to the mean. This is entirely determined by the mood of the market and is quite often disconnected, or only loosely connected, to the performance of the actual business. In this section, we will examine the actual earnings of the business. The goal here is simple: We want to know how much money we would earn (expressed in the form of a CAGR %) over the course of 10 years if we bought the business at today’s prices and kept all of the earnings for ourselves.
There are two main components of this: the first is the earnings yield and the second is the rate at which the earnings can be expected to grow. Let’s start with the earnings yield (which is an inverted P/E ratio, so, the Earnings/Price ratio). The current earnings yield is about +5.97%. The way I like to think about this is, if I bought the company’s whole business right now for $100, I would earn $5.97 per year on my investment if earnings remained the same for the next 10 years.
The next step is to estimate the company’s earnings growth during this time period. I do that by figuring out at what rate earnings grew during the last cycle and applying that rate to the next 10 years. This involves calculating the historical EPS growth rate, taking into account each year’s EPS growth or decline, and then backing out any share buybacks that occurred over that time period (because reducing shares will increase the EPS due to fewer shares).
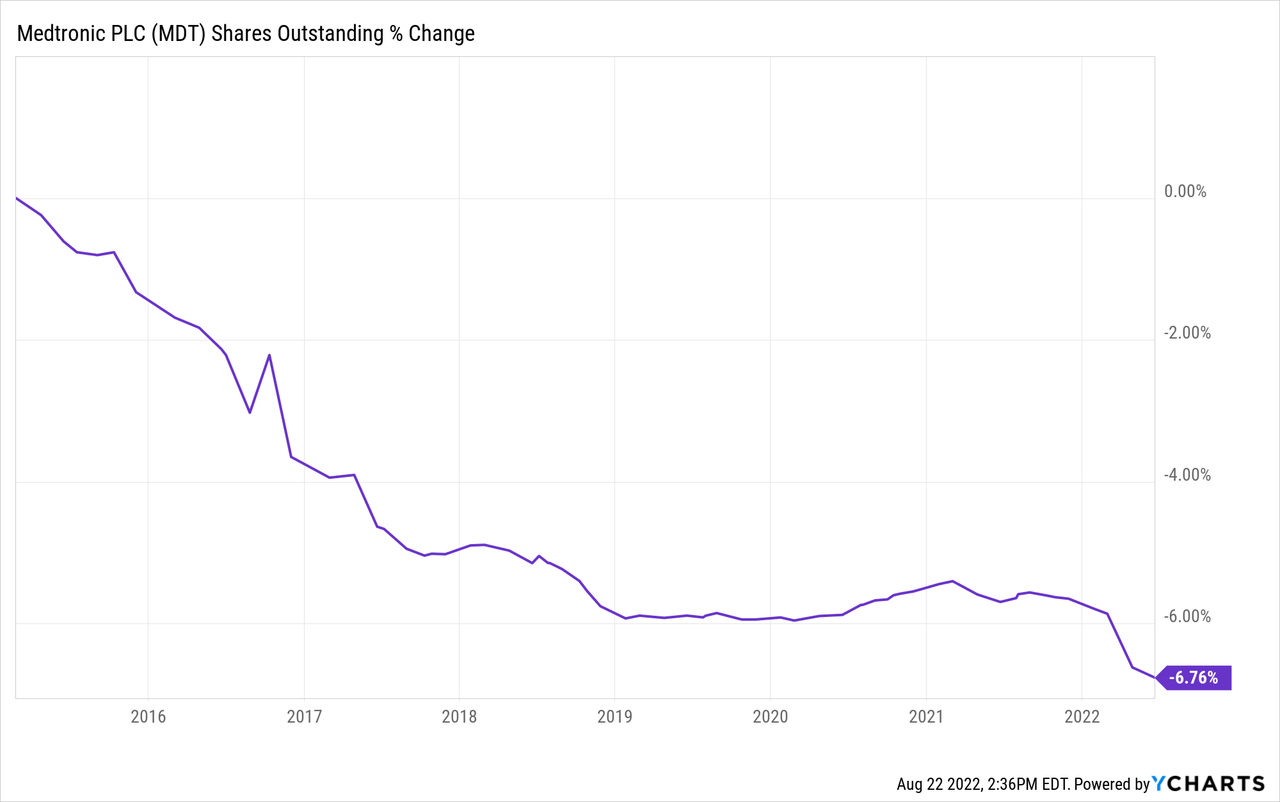
Since 2015, Medtronic has bought back about 7% of the company via share buybacks. I will control for that with my earnings growth estimates, which will make them more conservative. However, since COVID in 2020 and 2021 was probably a unique one-time event that is unlikely to happen again during the next 5-10 years, I will exclude those years of earnings declines for my earnings growth estimates, and in that way, I will be a little more generous.
When I do all that I get an earnings growth estimate of about +4.87%, which happens to be right in line with the FAST Graph +4.83% rate over this period.
Next, I’ll apply that growth rate to current earnings, looking forward 10 years in order to get a final 10-year CAGR estimate. The way I think about this is, if I bought MDT’s whole business for $100, it would pay me back $5.97 plus +4.87% growth the first year, and that amount would grow at +4.87% per year for 10 years after that. I want to know how much money I would have in total at the end of 10 years on my $100 investment, which I calculate to be about $178.37 (including the original $100). When I plug that growth into a CAGR calculator, that translates to a +5.96% 10-year CAGR estimate for the expected business earnings returns.
10-Year, Full-Cycle CAGR Estimate
Potential future returns can come from two main places: market sentiment returns or business earnings returns. If we assume that market sentiment reverts to the mean from the last cycle over the next 10 years for MDT, it will produce a +0.97% CAGR. If the earnings yield and growth are similar to the last cycle, the company should produce somewhere around a +5.96% 10-year CAGR. If we put the two together, we get an expected 10-year, full-cycle CAGR of +6.93% at today’s price.
My Buy/Sell/Hold range for this category of stocks is: above a 12% CAGR is a Buy, below a 4% expected CAGR is a Sell, and in between 4% and 12% is a Hold. A +6.93% CAGR expectation makes Medtronic stock a “Hold” at today’s price, and pretty close to the middle of what I would consider the fair value range.
Assuming today’s earnings trends stay intact, I would be a potential buyer of Medtronic stock if the price were to fall below $67 per share. And if I was a current owner of Medtronic stock (which I am not) I would be a seller if the price rose above $114 per share without a corresponding rise in earnings.
Conclusion
Every now and then you run across a stock where the basic valuation process is pretty darn straightforward. Earnings are pretty consistent and have a long history, there aren’t crazy buybacks or huge M&A to sort through, and we can make reasonably decent predictions about the future based on the past. Medtronic is one of those types of stocks. In these situations, an investor needs to ask themselves what types of returns they are looking to achieve over the medium-term or long-term (earnings valuations don’t help much to predict short-term stock price movements). I usually try to only buy stocks that I think can at least get me a 15% CAGR over five years or so. That means I need to buy at very good valuations and sell when the valuations look pretty poor. Right now, Medtronic is right in the middle of the range. Investors who hold here might do okay over the next five years, but are unlikely to produce market-beating returns.
Be the first to comment