

gece33
Thesis and Q3 recap
I have been a long-time bull on both Lockheed Martin (NYSE:LMT) and General Dynamics (NYSE:GD). My first bull article on both of them was published about 1 year and a half ago back in June 2021. In that article, entitled “General Dynamics, Lockheed Martin, And Perpetual Growth”, I argued that:
Thanks to their technological lead, scale, and wide moat, both investments are also in an excellent position to capitalize on the long-term secular trend of global defense needs. At their current price levels (LMT~$385 and GD~$190), both investments provide large short-term upside (up to 50%~75% in 3 years) but little downside.
At the time, no one could foresee the tragic break out of the Russian/Ukraine war. The war accelerated the time frame of my thesis. And only about 1 year and a half later, both stocks’ prices rose to near an all-time peak level, especially after they reported strong Q3 results recently.
To wit, LMT reported better-than-expected 2022 Q3 results. Its Q3 adjusted EPS dialed in at $6.87, beating consensus estimates by a good margin. Cash flow from operations rose to $3.13B, a whopping growth of 62% YOY. Looking ahead, there are plenty of growth catalysts such as the follow-on contract from the Pentagon for its F-35 jets. The company reaffirmed its 2022 full-year outlook and as a show of financial flexibility, it doubled its share repurchase plan from the previous $4B to the new $8B. And in tandem, its stock prices surged by nearly 9% in one day after its earnings report (“ER”). Its price currently hovers around $477, only about 3.7% below its all-time high of $495.
LMT Q3 ER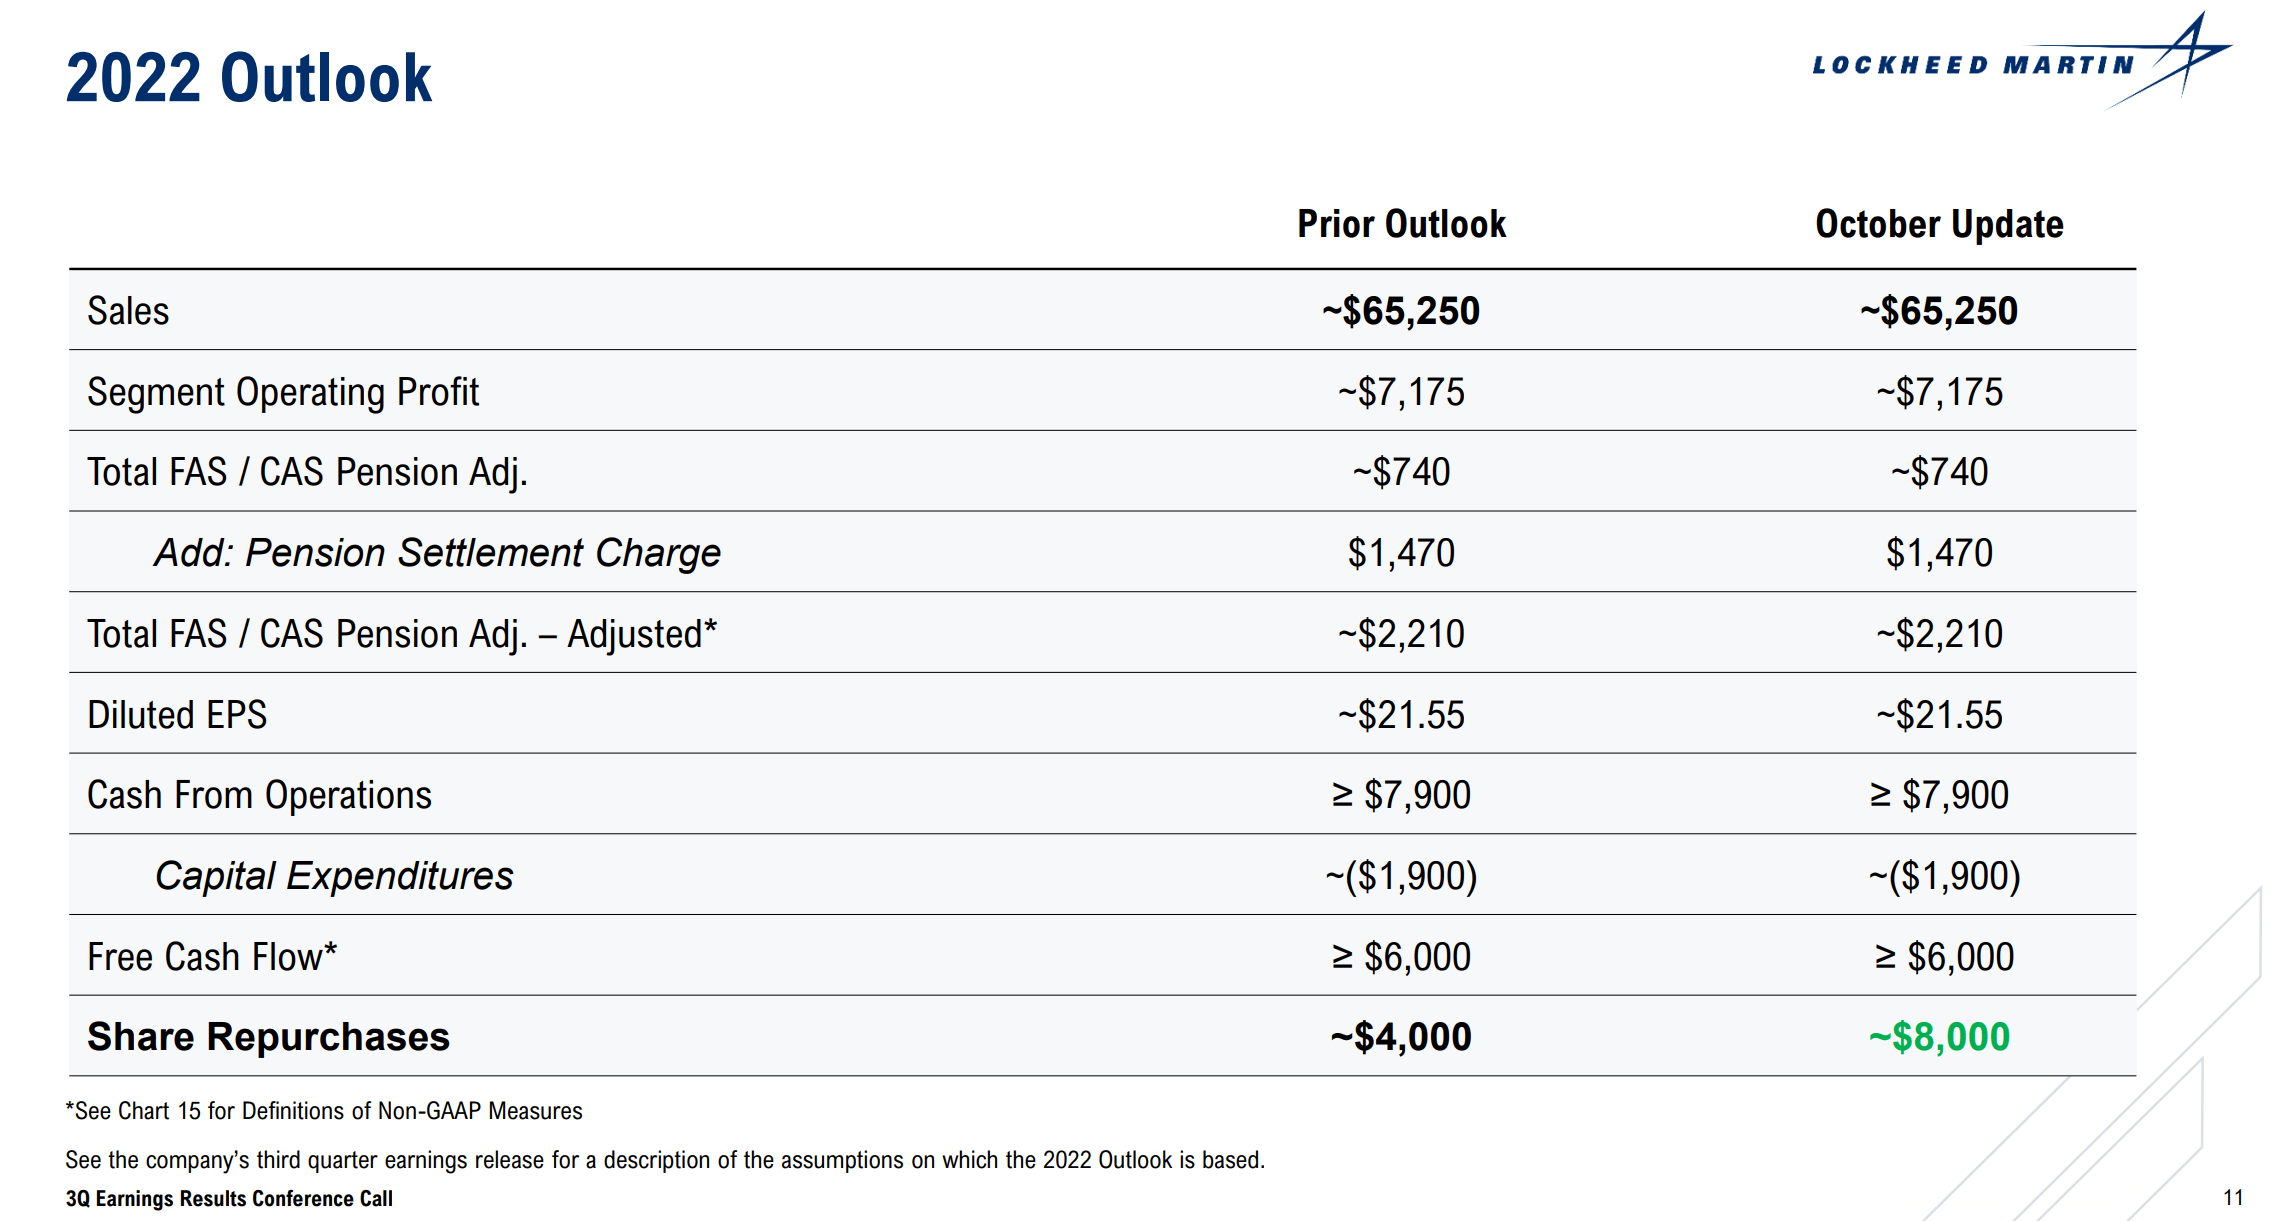
GD’s results were similar up-beating. In its Q3 ER, it reported results that beat consensus estimates on both lines. Its EPS came in at $3.26, translating to a growth of 6.2% YOY and exceeding the consensus estimate by 10 cents. In terms of the top line, its revenue increased to $10.0 billion, translating into an annual growth rate of 4.5% and also beating consensus estimates (by about $70 million). In particular, its book-to-bill ratio signals robust revenue growth ahead. The book-to-bill ratio is a key metric that compares orders received to units shipped and billed. And for GD, the ratio came in at 1.1 during the third quarter, indicating a favorable growth curve ahead.
Encouraged by such strong fundamentals, its stock price also hovers at an all-time high. It is around $248, only about 2.3% below its all-time peak of $255.
GD Q3 ER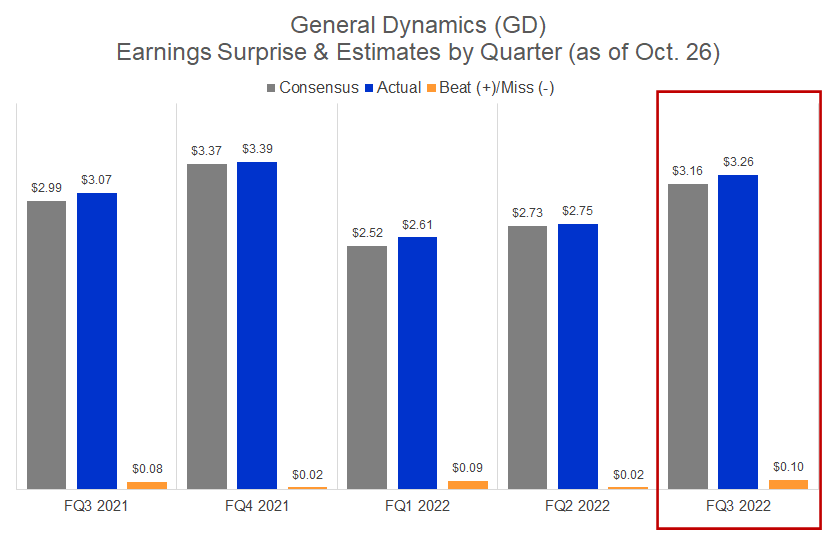
Despite the large price appreciations, I am still seeing above-average total return potential above the overall market. To be more specific, the chart shown below (to be elaborated on in the next section) provides my projected annual return for both LMT and GD and also the S&P 500 index. As you can see, LMT is projected to provide about 8.6% annual return (“ROI”) under current conditions and GD about 7.5%. In contrast, the S&P 500 is projected to provide an overall return of about 6.5%.
Furthermore, as leading defense contractors, both stocks can also serve as a hedge against ongoing global geopolitical tensions. Thus, all told, I still feel comfortable holding them despite their current price levels. And the remainder of this article will further elaborate on this assessment.
Source: author based on Seeking Alpha data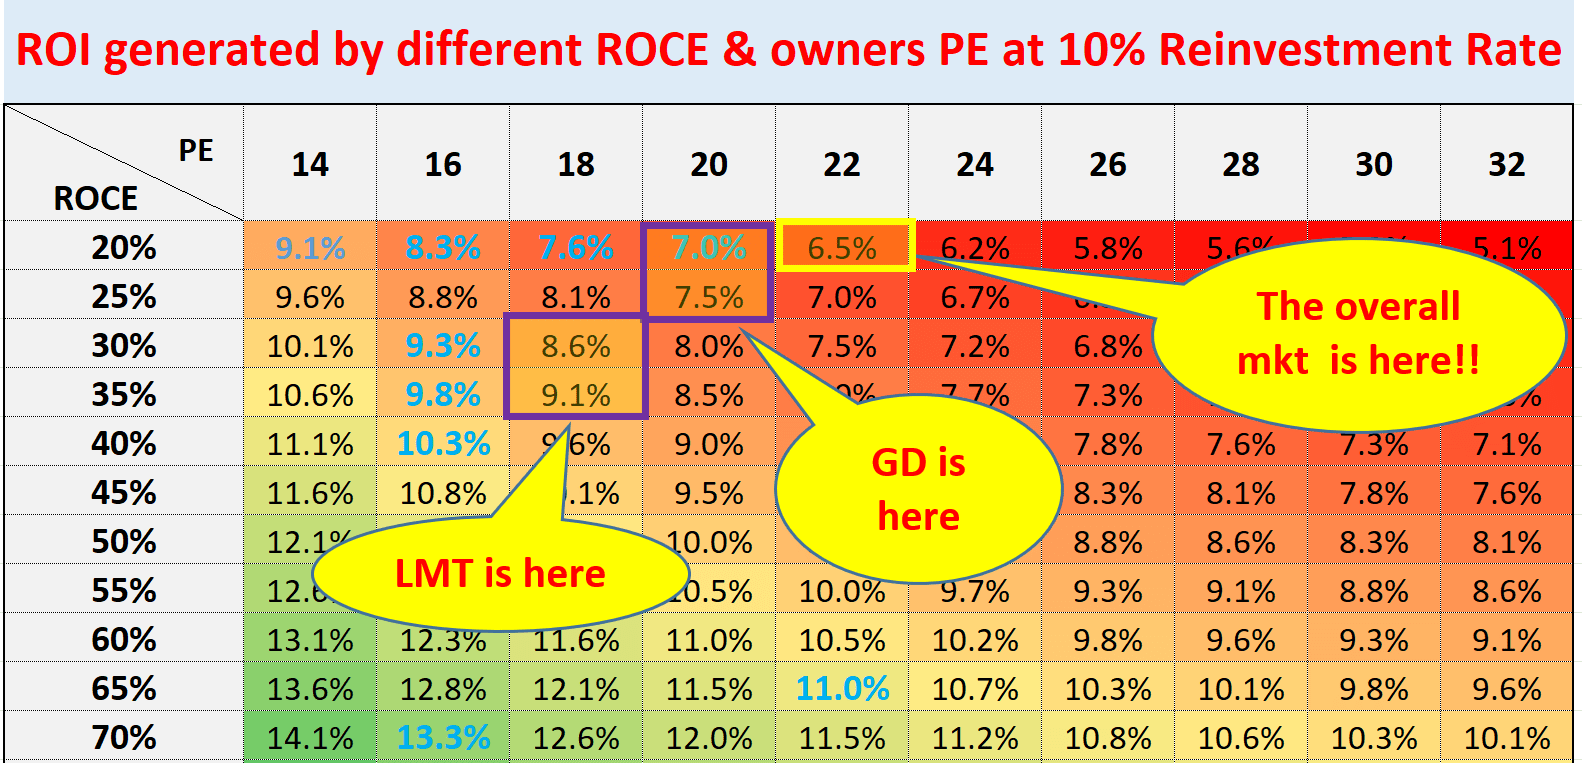
LMT, GD, and our roadmap
First, a bit of background on the chart shown above. Readers familiar with our approach know we call it our “investment roadmap” – for good reasons. We use it to guide all our investment decisions (and for our members in our market service too) at a high level. Details are provided in this free blog article and the key principles behind it are:
- The long-term ROI for a business owner is simply determined by two things: A) the price paid to buy the business and B) the quality of the business. More specifically, part A is determined by the owner’s earning yield (“OEY”) when we purchased the business. And that is why PE is the first dimension in our roadmap. Part B is determined by the quality of the business and that is why ROCE, the most important metric for profitability, is the second dimension in our roadmap.
- Now, the long-term growth rate is governed by ROCE and the Reinvestment Rate. These are the two most important growth engines, and they mutually enhance each other. High ROCE means every $1 reinvested can lead to a higher growth rate, which leads to more future profits and more flexible capital allocation to fuel further growth, and so on. Therefore, to summarize:
- Longer-Term ROI = valuation + quality = OEY + Growth Rate = OEY + ROCE*Reinvestment Rate
How did our roadmap perform?
The next chart below shows our current holdings picked for our son’s UTMA account using the roadmap. And their places in our roadmap are highlighted by those bold blue cells.
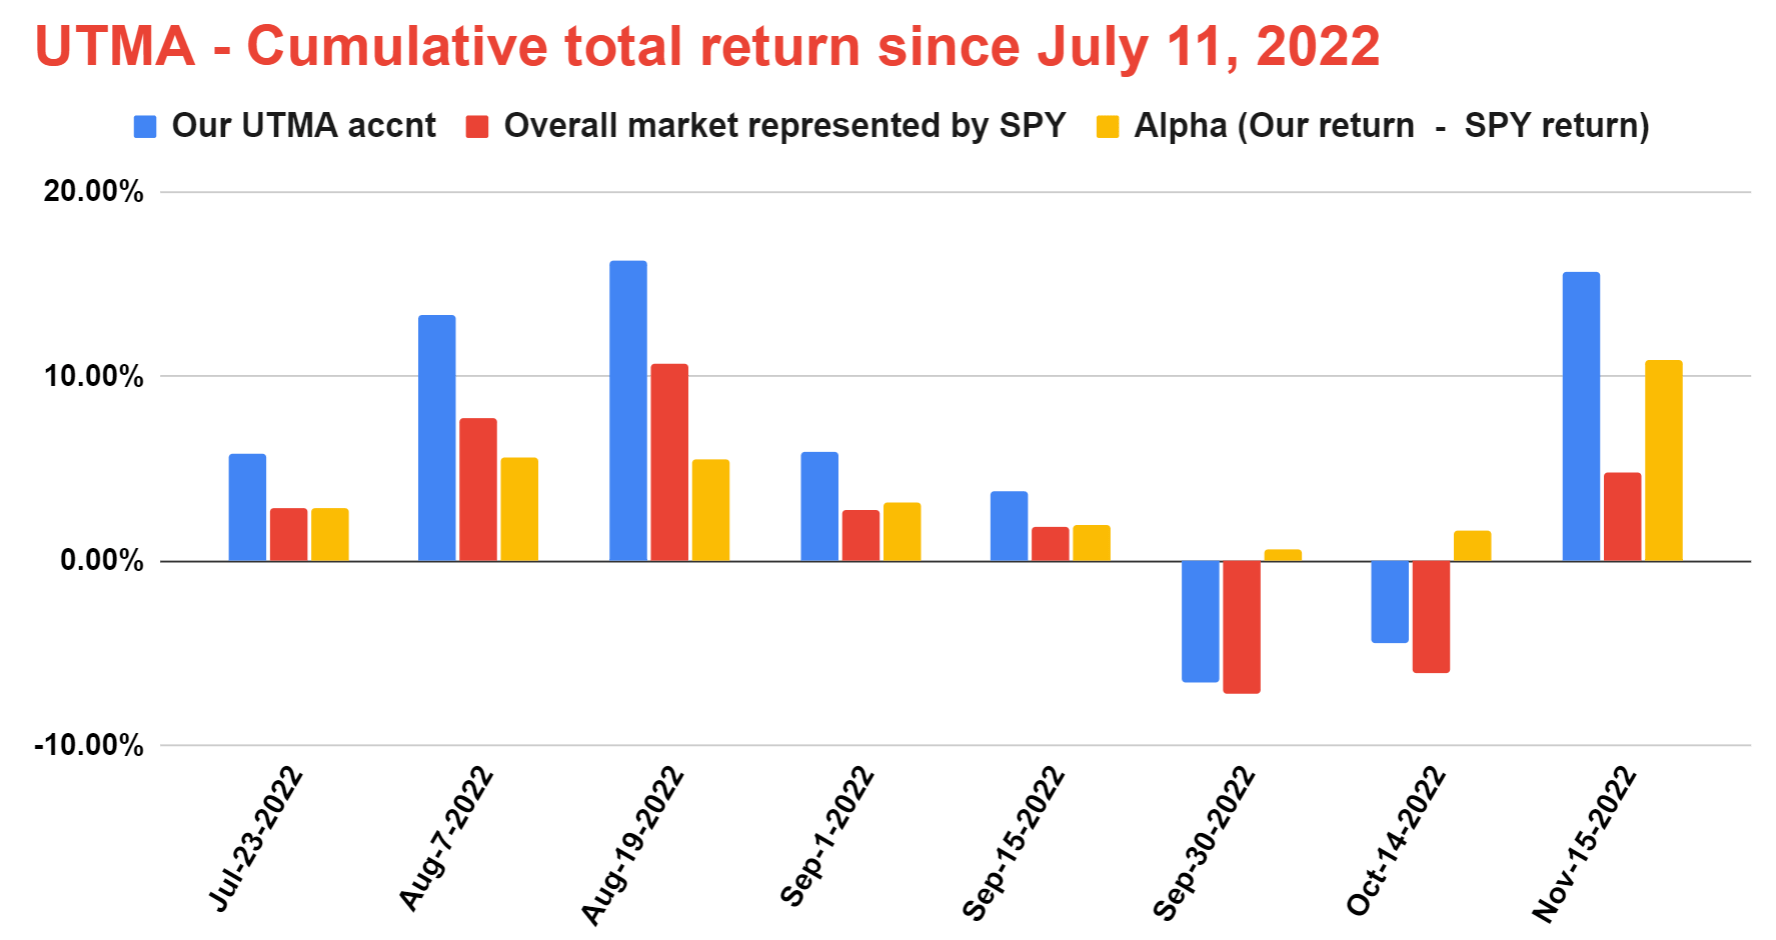
For performance tracking, these charts used the prices on July 11, 2022 (the date I first published the UTMA account on SA). As can be seen, the UTMA account has consistently outperformed the SPY since then amid extreme market turbulence, despite (probably because of) the fact that it only holds a total of 6 stocks.
It is currently outperforming SPY by a large margin of 10.6% as of Nov 15 (we update the account monthly in the mid of each month). Note our picks yield much higher (3.82%) than SPY (about 1.51%), and the returns reported here were adjusted for dividend yields.
Source: author based on Seeking Alpha data Source: author.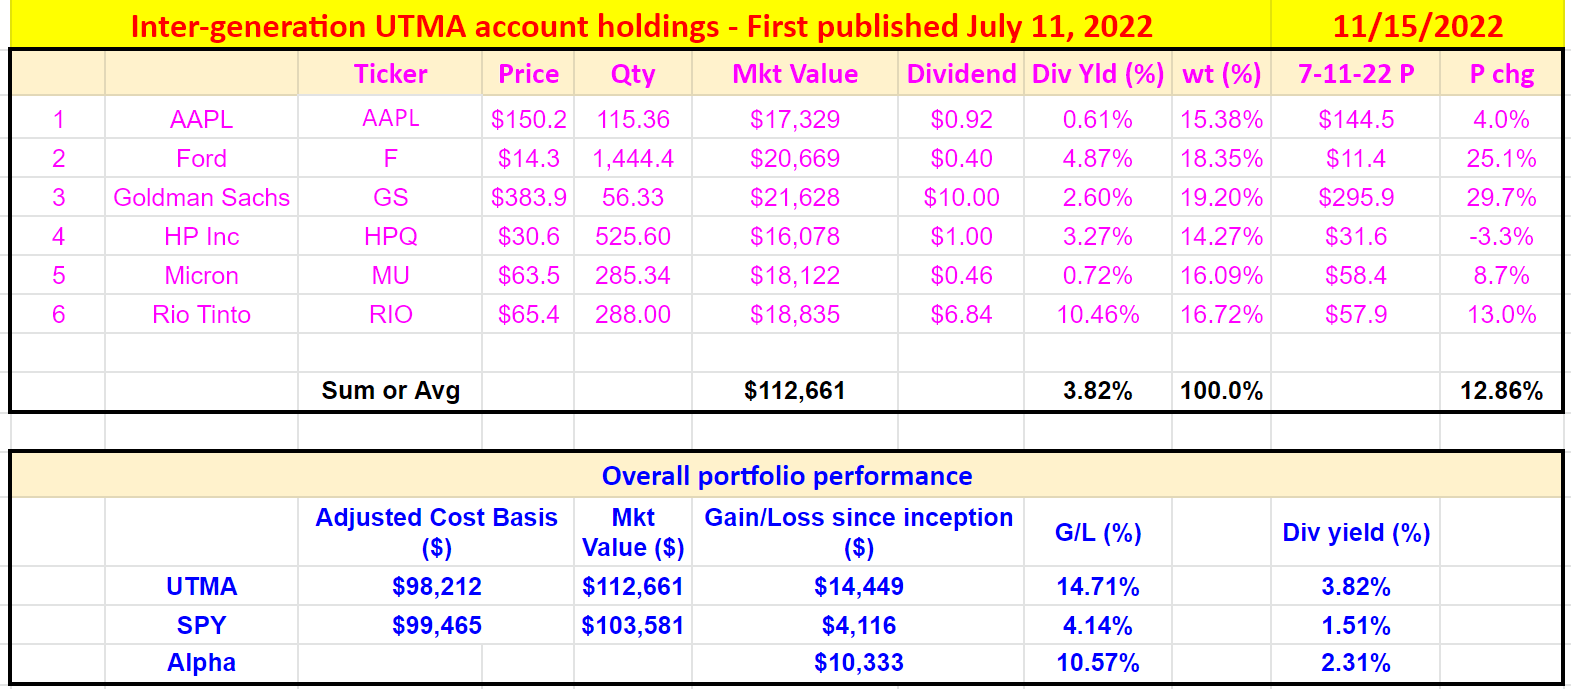
LMT and GD: profitability and long-term compounding power
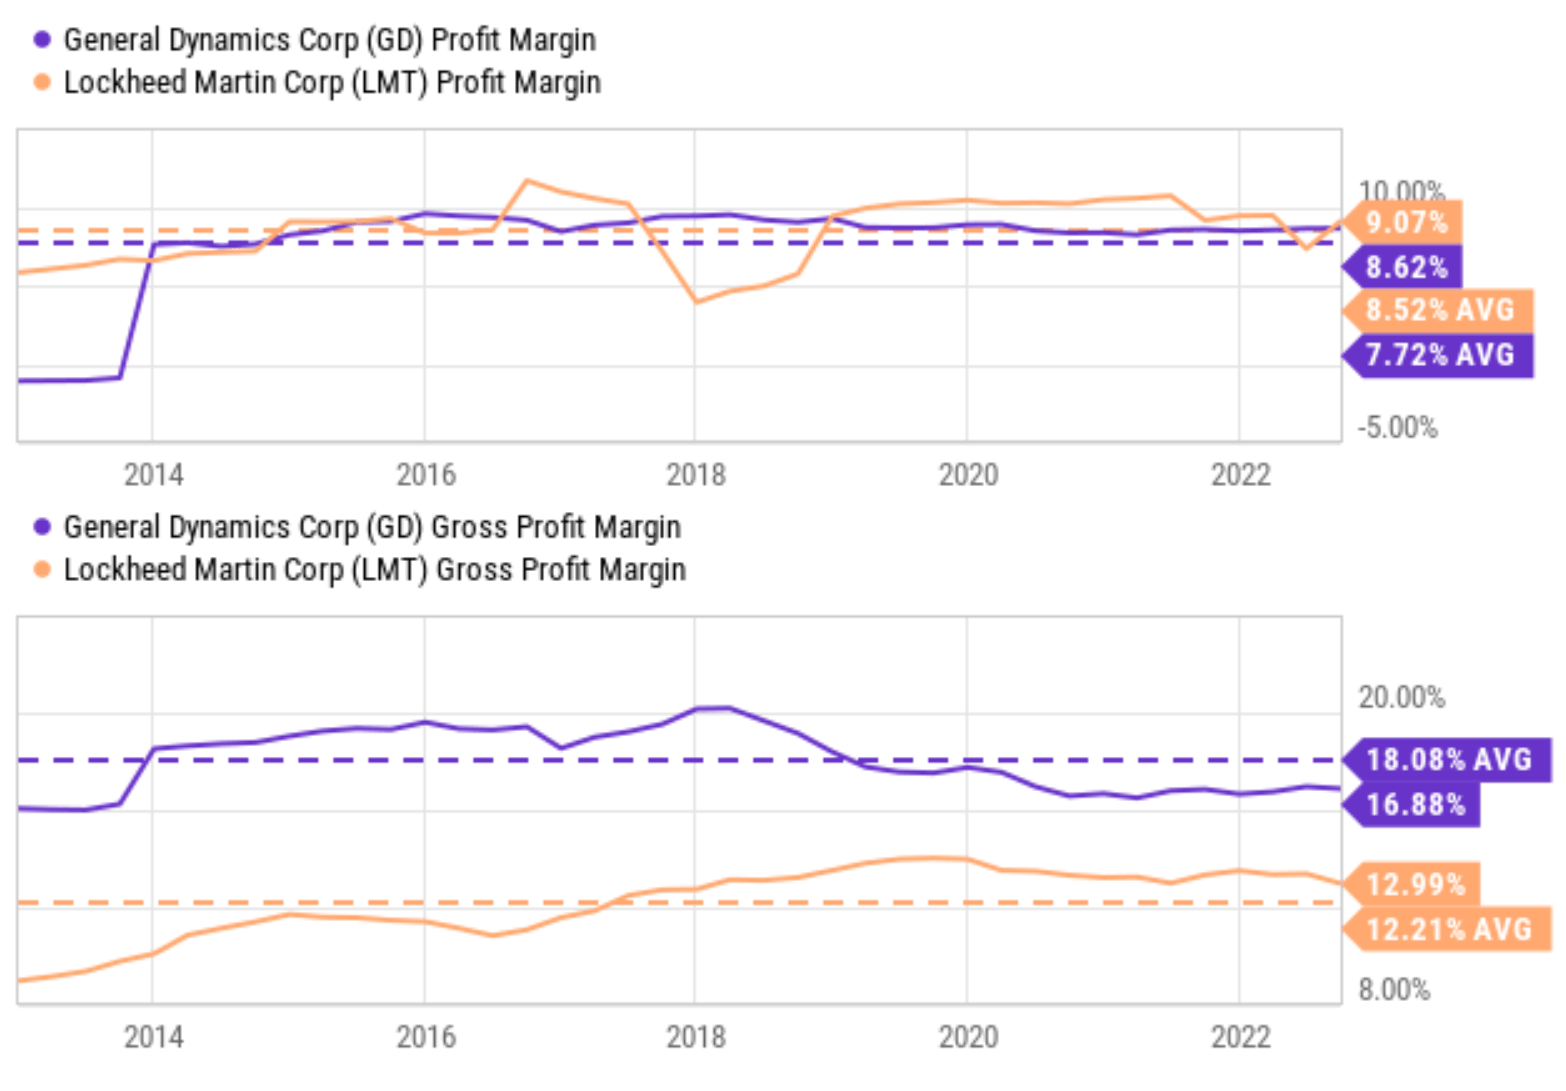
After the above background, let’s get back to LMT and GD. Both boast superb profitability in all metrics as summarized in the charts below. Take the gross profit margin (“GPM”) as an example. LMT features a GPM of around 12.99%, slightly lower than GD’s 16.88%. In terms of net profit margin (“NPM”), LMT’s 9.07% NPM is slightly higher than GD’s 8.62%. The net profit margins are better than their historical averages as seen in the second chart below. However, GD’s current gross margin is a bit lower than its historical averages (16.88% vs 18.08%) and we will elaborate on the cause in the risk section later.
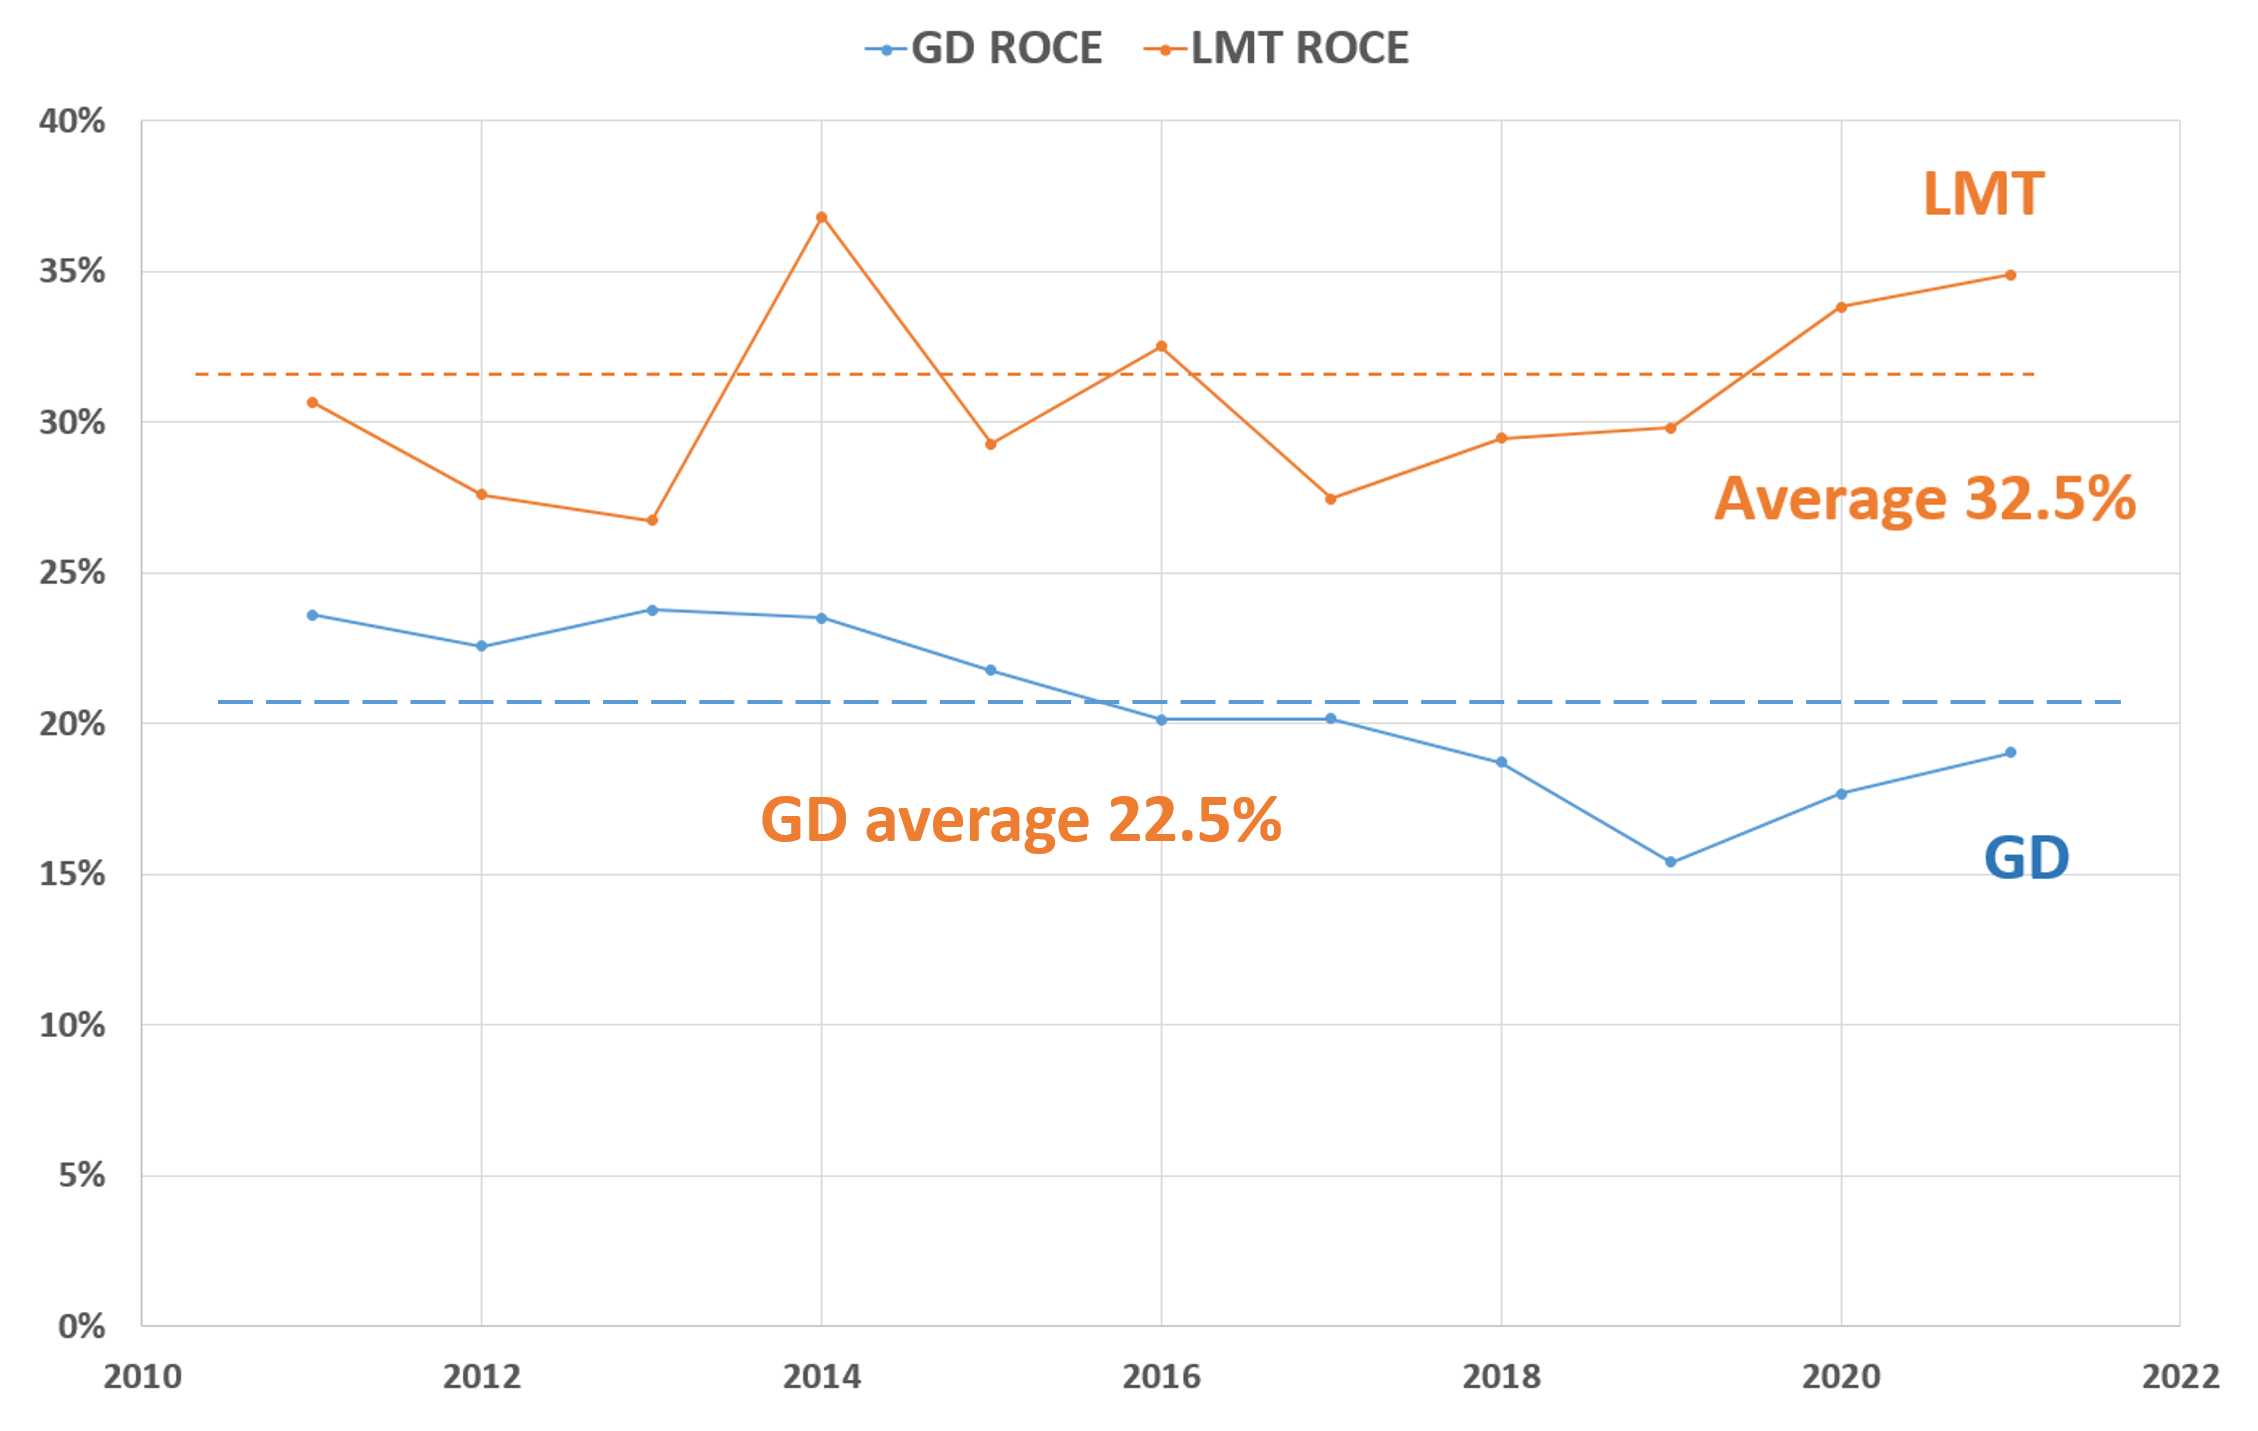
Besides these margins, the third plot also compares their ROCE (return on capital employed) over the long term (the past 10 years). In my mind, ROCE is the most important profitability metric since it measures the return of capital ACTUALLY employed in the business operation. As you can see, both GD and LMT have been maintaining consistent and healthy ROCE over the long term. LMT’s ROCE has been on average 32.5% and GD’s ROCE on average 22.5%.
Source: Seeking Alpha. Source: Seeking Alpha. Source: author and Seeking Alpha.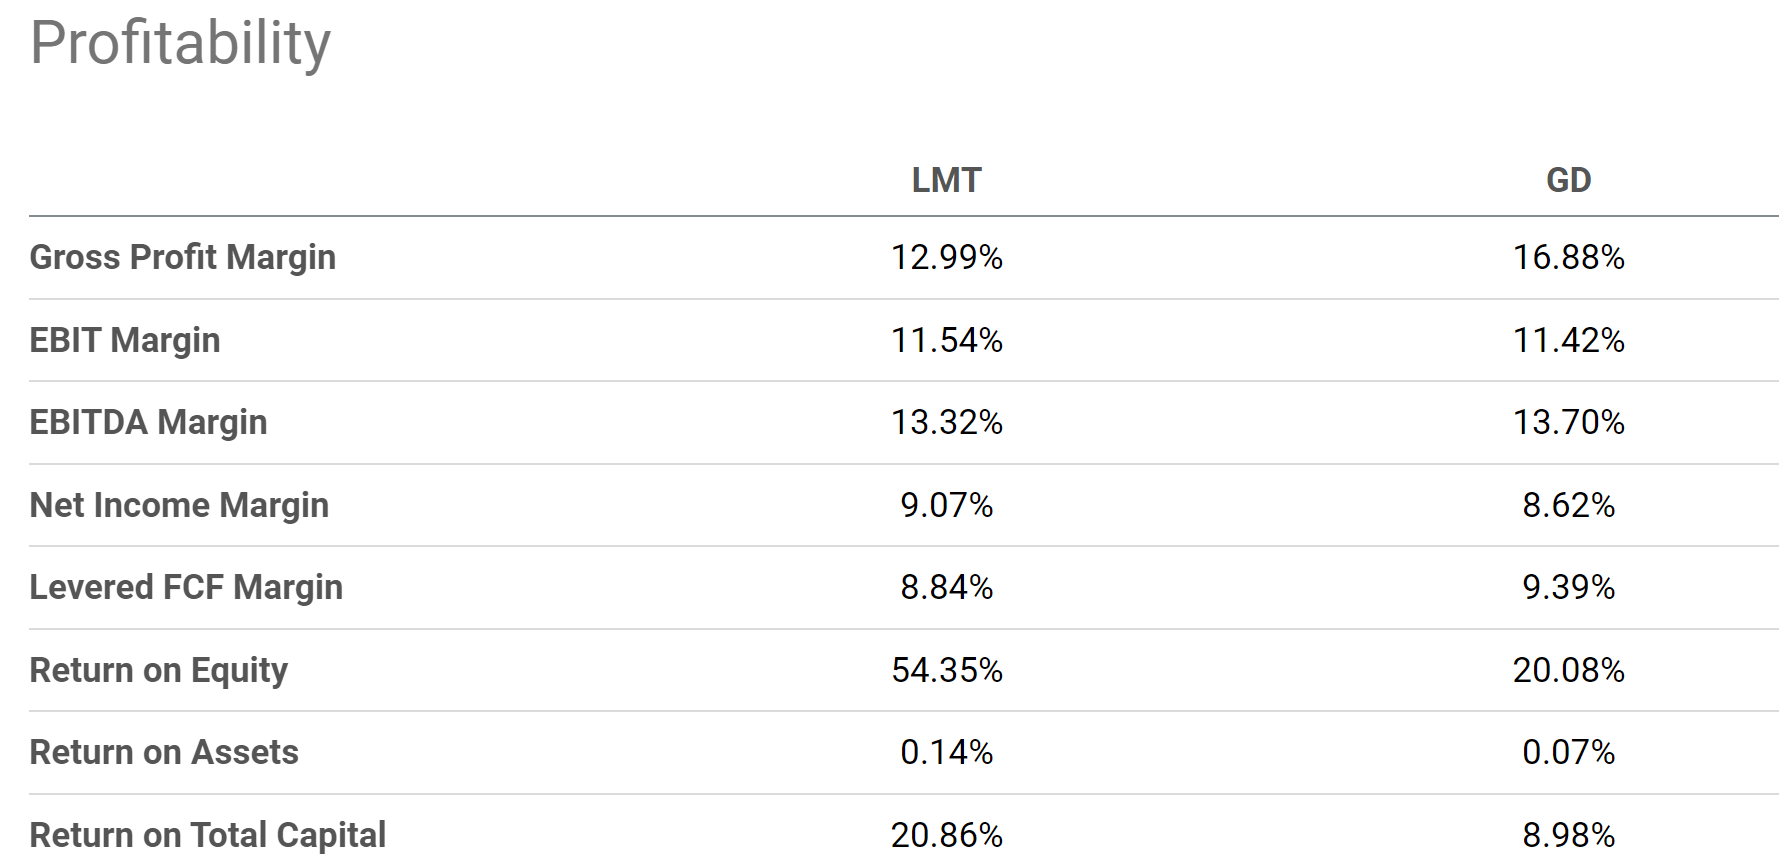
LMT and GD: Back to the roadmap
Now, let’s revisit the roadmap and conclude. At their current price levels, their PE multiples are still reasonable (although admittedly not as attractive as I first wrote about them ~1.5 years ago). As a result, both still provide a decent OEY (owners’ earning yield). To wit, LMT offers an OEY of ~5.6% (based on an FY1 FW PE of 17.7x). And GD offers an OEY of ~4.9% (based on an FY1 FW PE of 20.4x).
Their growth rates are projected based on their ROCE discussed above and a projection of 10% reinvestment rates (“RR”). As a result, the growth rate is about 3.25% for LMT (long-term growth rate = ROCE * RR = 32.5% * 10% = 3.25%). As a result, the total expected return for LMT is about 8.8% as shown in the roadmap below (5.6% OEY + 3.25% long-term growth rate).
Similarly, the growth rate is about 2.25% for GD (again long-term growth rate = ROCE * RR = 22.5% * 10% = 2.25%). And the total expected return for GD is about 7.1% as shown (4.9% OEY + 2.25% long-term growth rate).
Source: author and Seeking Alpha.
Risks and final thoughts
Both stocks do face some risks ahead. As aforementioned, GD’s current gross margin is a bit lower than its historical averages (16.88% vs 18.08%). A major reason is the higher costs due to labor, raw materials, and general inflation. As a net result, aircraft maintenance costs have run higher than anticipated (and the same issues are facing LMT too). At the same time, as a general headwind to the defense sector, project fulfillment has been interrupted by global supply chain issues across the board (ranging from missiles, ships, helicopters, et al).
But all told, I see the above issues as only short-term and temporary. Once we look past them, my view is that both stocks are still excellent buy-and-hold candidates. Even at their current all-time record stock prices, these stocks still provide a well-rounded package combining superb financial strength, robust perpetual growth prospects, and total annual return potential that exceeds the broader market. In particular, with the ongoing geopolitical tension, both the domestic and foreign governments should continue to loosen their purse strings to address their defense needs, providing a secular tailwind for both stocks. And in turn, both stocks provide a hedge to my portfolio should such tension further escalate.
Be the first to comment