


SimonSkafar/E+ via Getty Images
In order for life to exist, water is, undeniably, one of the most vital resources. With the world’s population larger than it has ever been and concerns over the real threat of climate change, making sure that we have a functional and healthy relationship with water, as a society, is of the utmost importance. One company dedicated to making this a reality is Lindsay Corporation (NYSE:LNN). The company provides a variety of products and services aimed at helping customers achieve their water-oriented needs. In addition to this, the company also provides a variety of other products that fall under the infrastructure market that helps to diversify its revenue stream so that investors have some additional degree of stability. In recent years, the company’s financial performance has been volatile; this has been especially true on its top line. But cash flows are good and getting better. At the same time, however, shares of the business do look a bit pricey. At best, the company is likely fairly valued. But it is possible the stock is a bit overpriced at this time.
A small but diverse prospect
As I mentioned already, Lindsay is dedicated to providing a variety of goods and services dedicated to the water space. The company does this through its Irrigation segment. That unit focuses on manufacturing and marketing center pivot, lateral move, and hose reel irrigation systems that are largely used in the agricultural industry for the purpose of increasing or stabilizing crop production while simultaneously conserving water, energy, and labor. For context, a center pivot is a makeshift device that extracts water using a pumping system, transports it through pipes, and then sprays it out through sprinklers onto crops as the device itself is moved, using electric motors, across an agricultural field. This helps to drastically reduce the time, energy, and money associated with ensuring that crops are watered appropriately. On top of this, the company provides other goods, such as repair and replacement parts for the irrigation systems, as well as controls. In recent years, management has moved the company into the IIoT (Industrial Internet of Things) direction, integrating various technologies into its irrigation products. During the company’s 2021 fiscal year, this segment was responsible for 83% of the company’s revenue but for a more modest 75.8% of profits.
The second and much smaller segment operated by Lindsay is called Infrastructure. Through this, the company produces movable barriers, specialty barriers, crash cushions, end terminals, road marking and road safety equipment, large-diameter steel tubing, and railroad signals and related structures. These products help with the construction and safe-making of roads, railroads, and other thoroughfares. Under the road marking and road safety equipment category, the company’s offerings include preformed tape and road safety accessory products. Preformed tape is used primarily in temporary applications like marking for work zones and St crossings. Under the road safety accessory products category, the company produces plastic and rubber products that are used for delineation, slowing traffic, and signaling. Last year, this unit was responsible for just 17% of the company’s revenue but was responsible for an impressive 24.2% of profits.
Author – SEC EDGAR Data
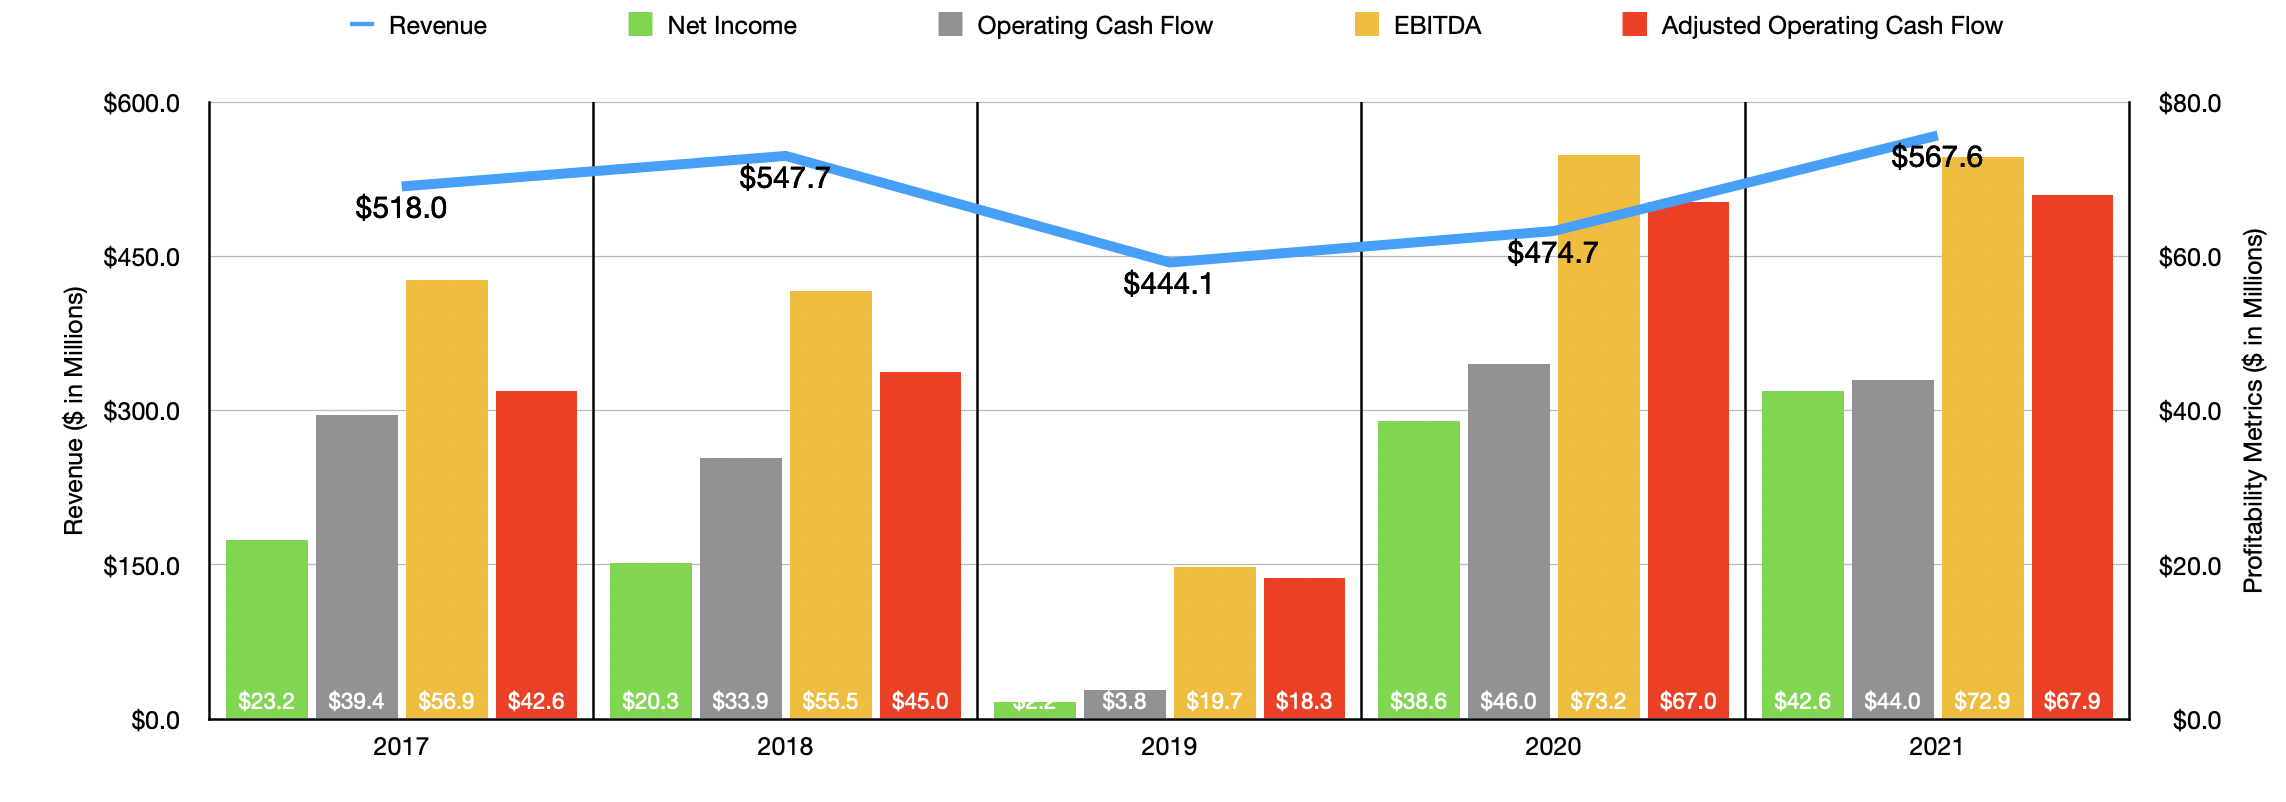
Over the past few years, the financial picture for Lindsay has been a bit volatile. After seeing revenue rise from $518 million in 2017 to $547.7 million in 2018, it plunged to $444.1 million in 2019. Sales recovered some in 2020 before jumping up to $567.6 million last year. This rise in revenue came even as the Infrastructure segment saw revenue plunged by 23% year over year. The Irrigation segment more than made up for this though, rising by 35% from 2020 to 2021. The company attributed a good portion of the decline associated with its Infrastructure segment to the delivery, in 2020, of a large project in the UK that did not repeat this past year. Meanwhile, revenue under the Irrigation segment increased largely as a result of higher irrigation equipment unit sales volume and higher average selling prices. This was true in both the North America and International regions the company keeps track of.
Just like revenue, profitability for the company has also been a bit volatile. Net income fell from $23.2 million in 2017 to $2.2 million in 2019. Then, in 2020, it shot up to $38.6 million before climbing further to $42.6 million last year. Of course, there are other profitability metrics for us to consider. Interestingly, operating cash flow followed a similar trajectory, falling between 2017 and 2019 before rebounding in 2020. But in 2021, it dipped slightly, falling from $46 million to $44 million. If we adjust for changes in working capital, however, the metric would have generally risen over time. Despite a large drop in 2019 to just $18.3 million, the overall trajectory of adjusted operating cash flow has been consistently positive, with the metric ultimately climbing from $42.6 million in 2017 to $67.9 million last year. Meanwhile, EBITDA has followed a trend similar to what operating cash flow did, dropping between 2017 and 2019 before recovering in 2020 and then dipping in 2021.
Author – SEC EDGAR Data
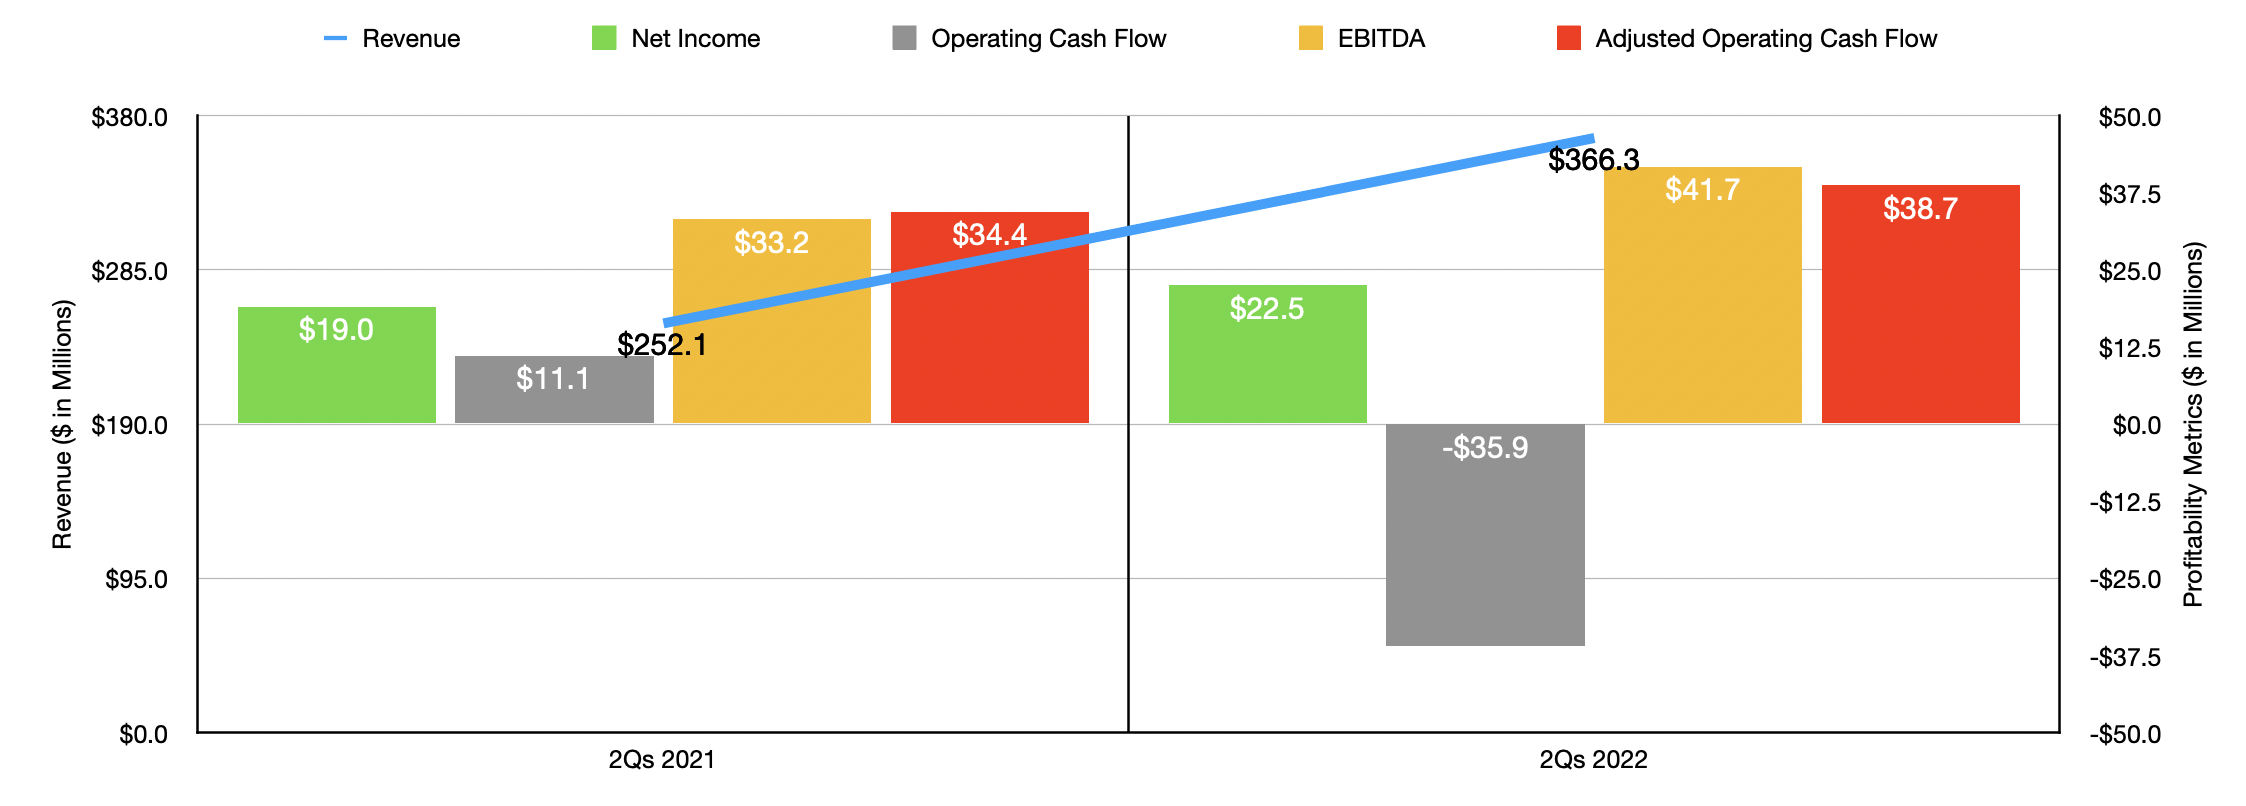
When it comes to the 2022 fiscal year, financial performance for the company has been generally positive. Revenue in the first half of the year totaled $366.3 million. That’s up 45.3% compared to the $252.1 million generated one year earlier. Infrastructure revenue continued to fall, dropping 14% year over year. However, the Irrigation segment experienced a 59% surge in revenue as a result of higher irrigation equipment unit sales volume and higher average selling prices. Management said that increased demand for equipment has been supported by higher agricultural commodity prices and higher farm income. Meanwhile, the higher average selling prices came as a result of higher raw material costs that the company was able to pass through to its customers.
Author – SEC EDGAR Data
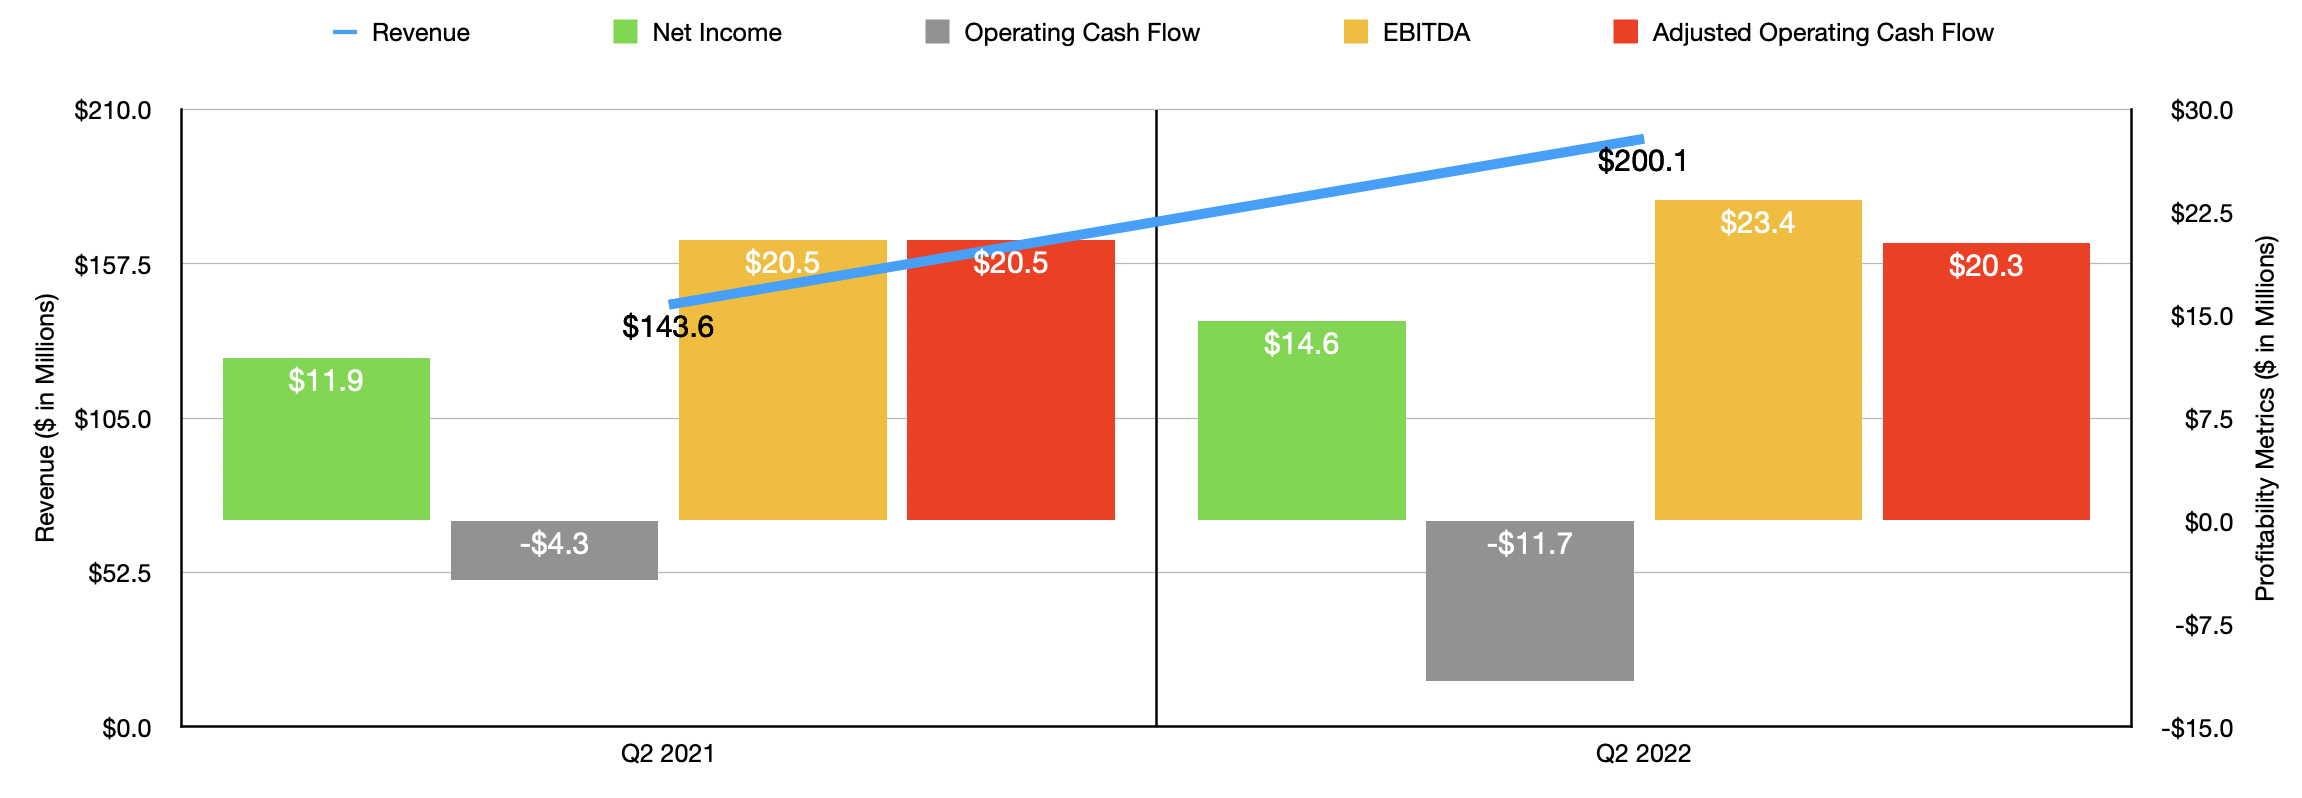
On the profitability side of the equation, results have also been mostly positive. Net income in the first half totaled $22.5 million. That’s up from the $19 million reported just one year earlier. Operating cash flow did worsen, falling from $11.1 million to negative $35.9 million. But if we adjust for changes in working capital, it would have risen from $34.4 million to $38.7 million. Meanwhile, EBITDA also increased, climbing from $33.2 million to $41.7 million. Management has not provided any real guidance for the current fiscal year. But if we analyze results experienced so far this year, we should anticipate net income of $50.4 million, adjusted operating cash flow of $76.4 million, and EBITDA of $91.6 million.
Author – SEC EDGAR Data
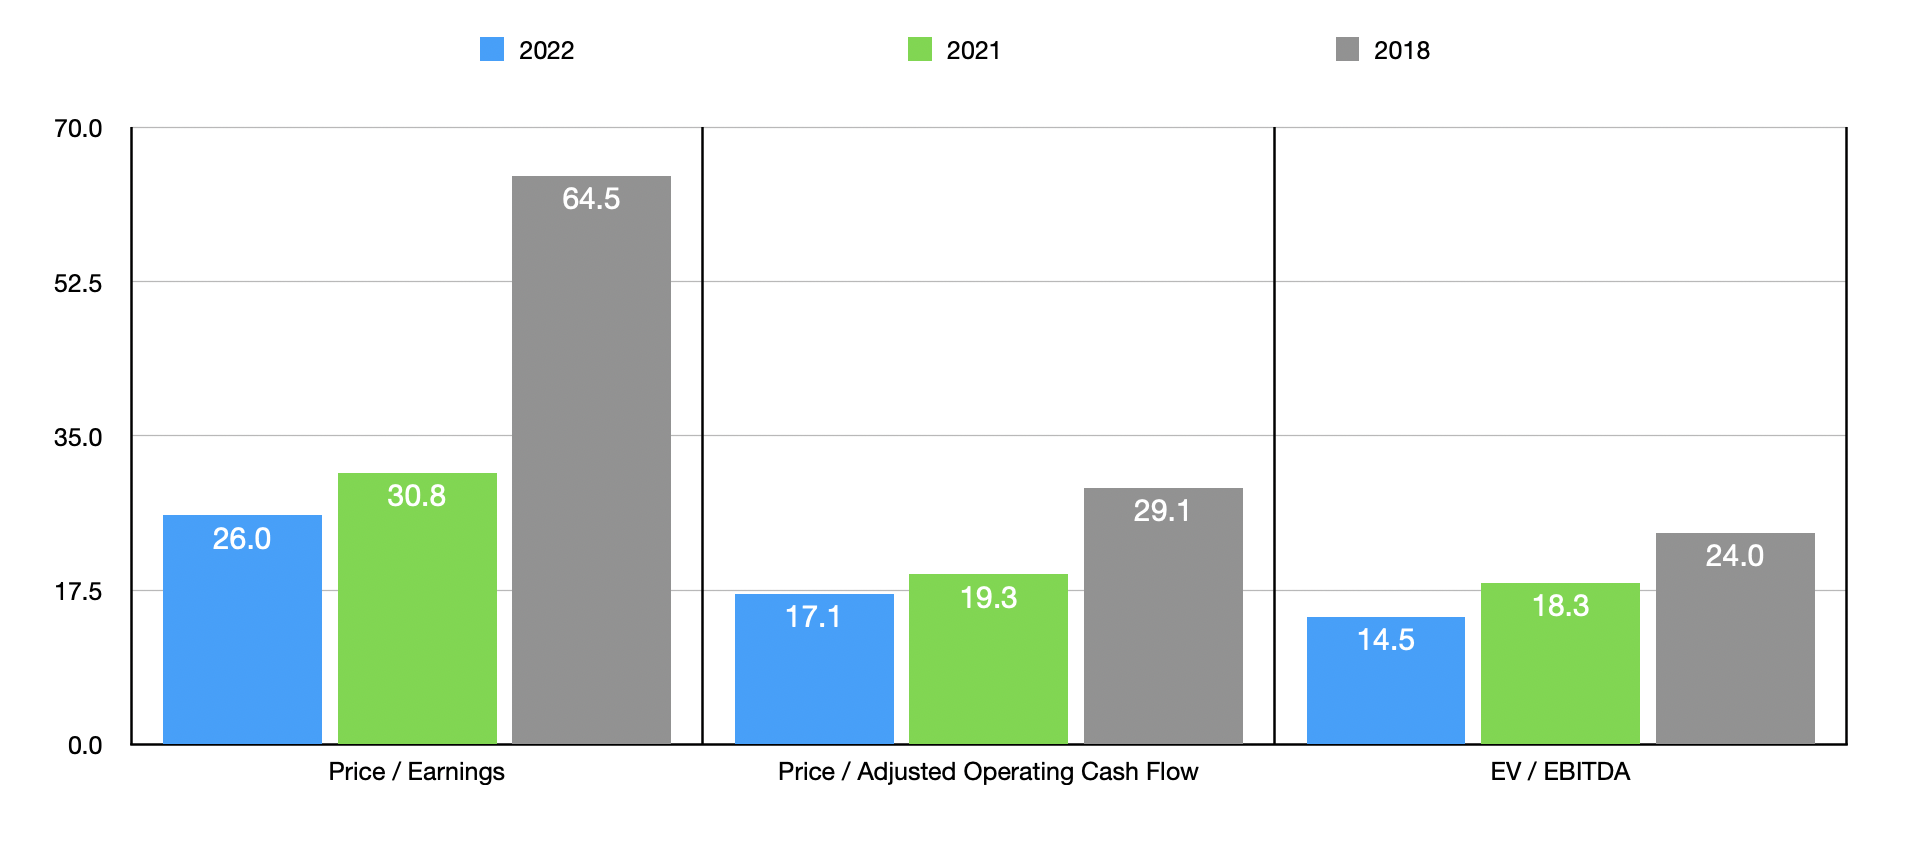
Although this would represent a nice improvement over what the company achieved last year, it does not mean that shares make sense to buy into. Using these 2022 estimates, we can calculate that the company is trading at a price-to-earnings multiple of 26. Its price to adjusted operating cash flow multiple should be 17.1, while its EV to EBITDA multiple should come in at around 14.5. At best, this looks fairly valued to me. If financial performance eventually reverts back to what it was in prior years, however, the company could look a bit pricey. Using 2021 figures, for instance, these multiples would be 30.8, 19.3, and 18.3, respectively. And if we see financial performance drop back to 2018 levels, these multiples would be 64.5, 29.1, and 24, respectively. To put this in perspective, I decided to compare the company to five similar companies. On a price-to-earnings basis, these firms range from a low of 9.1 to a high of 22.5. Compared to our 2021 results, all five companies were cheaper than Lindsay. The same held true when using the EV to EBITDA approach, which resulted in a range of 7.5 to 15.4. The company only looked cheap on a relative basis when looking at the price to operating cash flow multiple. The competitors were in a range of between 6 and 135, with only one of the five cheaper than our prospect.
| Company | Price / Earnings | Price / Operating Cash Flow | EV / EBITDA |
| Lindsay Corp. | 30.8 | 19.3 | 64.5 |
| Titan International (TWI) | 18.4 | 135.0 | 10.3 |
| The Toro Company (TTC) | 22.5 | 28.8 | 15.2 |
| CNH Industrial NV (CNHI) | 10.3 | 6.0 | 11.0 |
| Deere & Co. (DE) | 16.8 | 24.0 | 15.4 |
| AGCO (AGCO) | 9.1 | 20.4 | 7.5 |
Takeaway
Based on the data provided, I do like the business model used by Lindsay. The company will likely continue to grow in the long run and will create additional value for its investors as time progresses. Having said that, I do not think that shares make for a great investment at this time. Considering the broader economic outlook, it is possible that a slowdown or a recession could depress pricing and demand for its products. But even if that does not come to pass, shares don’t look any better than fairly valued at this time. So in the best case, investors are buying into a company that is fairly valued, while in the worst case they are getting something that will become overpriced before too long. Because of that, I have decided to rate the business a soft ‘sell’ at this time.
Be the first to comment