

3D_generator
Just before the New Year, I identified Life Storage Inc. (NYSE:LSI) as one of the 16 REITs likely to outperform in 2022.
According to Hoya Capital Income Builder, Storage REITs in general have slightly outperformed the REIT average, despite the flight to high-yield securities touched off by record inflation.
Hoya Capital Income Builder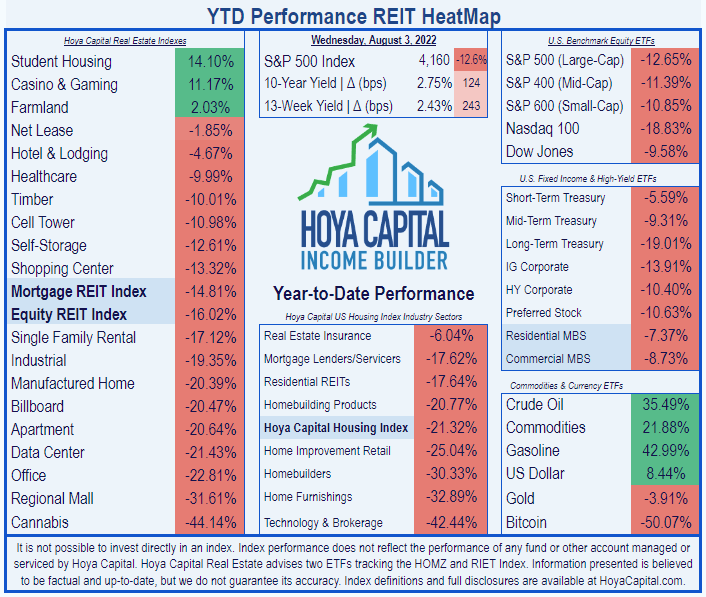
LSI shares have lost (-15.37%) YTD (year to date), and thus have slightly outperformed the overall REIT average, while underperforming the Storage REIT sector.
Seeking Alpha Premium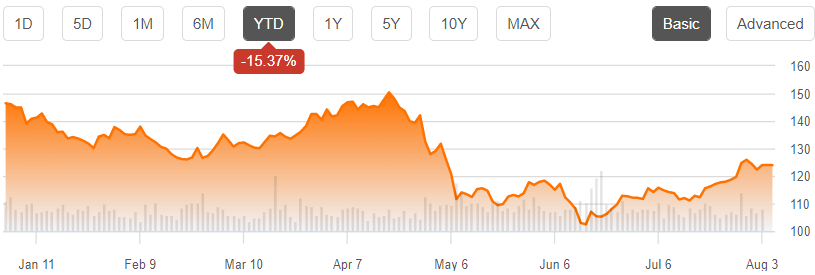
The year is only half over, and I expect LSI shares to do even better in the second half than in the first. Why?
Meet The Company
I did deep dives on LSI in December and again in May, and those articles have plenty of detail about the company itself. For the sake of this article, suffice it to say that the company operates more than 1000 stores in 36 states, concentrated more in the southern half of the U.S.
Company investor presentation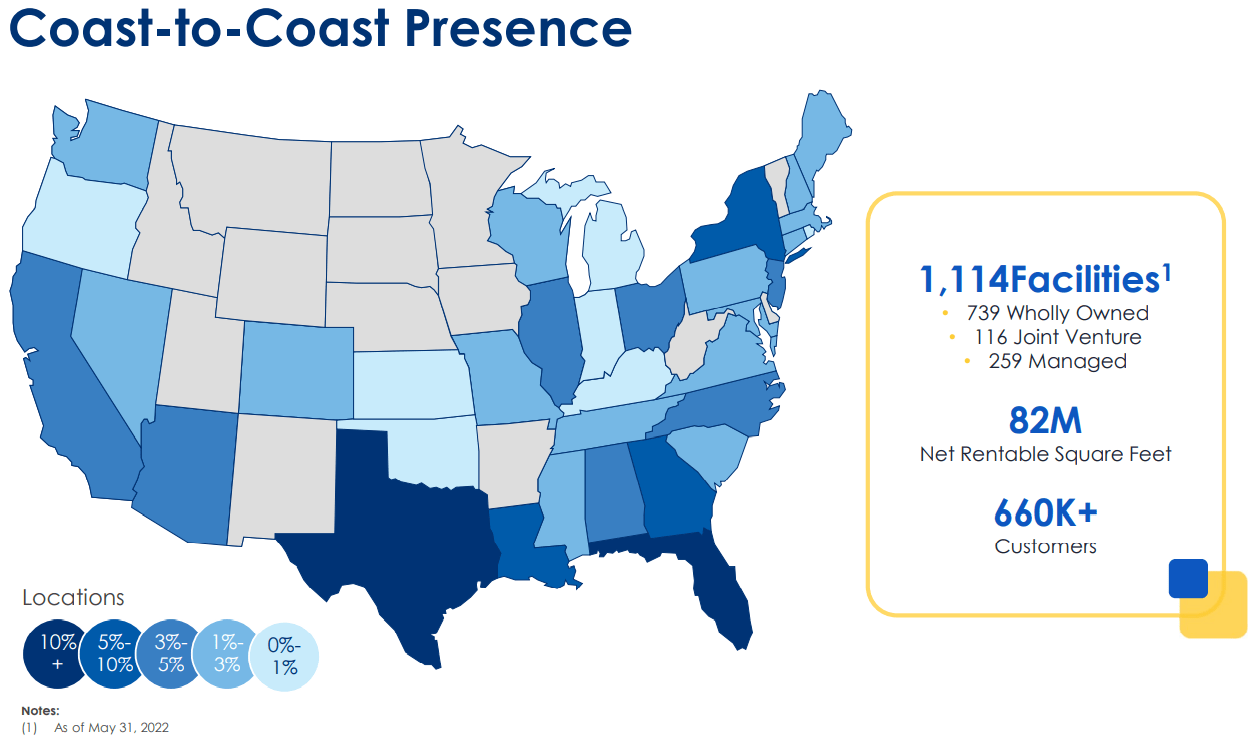
LSI differentiates itself from other Storage REITs by means of two innovations they have pioneered:
- online, touchless self-service rentals (about 35% of all rentals currently) and
- storage for e-commerce (their “Warehouse Anywhere” program)
plus
- extensive use of third-party management (which increases revenue without increasing the debt load, augments the acquisition pipeline by helping identify more profitable off-market opportunities, improves operational decision-making by capturing more customer data, and increases LSI’s brand awareness), and by
- extensive engagement in joint ventures (which generates higher returns due to fee collection in addition to equity, includes all the benefits of third-party management listed above; and lowers the company’s risk in acquiring recently built facilities in the early stages of lease-up).
LSI does not build its own storage facilities, so the pace and cap rate on acquisitions is key to their success.
Quarterly Results Are In
The company just reported Q2 2022 results after the closing bell on August 3, and here is what they show:
- Occupancy rose to 94.0%, up from 92.4% at the beginning of the year.
- Realized rental rates rose a whopping 20.0% YoY (year over year).
- Same-store NOI (net operating income) of $135.7 million, up 25.4% YoY. This included double-digit growth in 32 of its 33 major markets.
- Acquired 13 more stores for a total investment of $262.6 million, with contracts to purchase 7 more for another $137.4 million.
- Added 17 more stores to its third-party management platform, bringing the total to 385.
- Raised full-year FFO guidance, from $6.09 at the midpoint to $6.30.
- Raised same-store NOI guidance 350 basis points, from 13.5% at the midpoint to 17.0%.
- Raised guidance for wholly-owned acquisitions by 12.5%, from $800 million at the midpoint to $900 million.
- Raised guidance for joint venture investments by 33.3%, from $75 million at the midpoint to $100 million.
The company provides no figures for cap rates, but the pace of acquisitions this year is exceeding expectations. Given the fragmented nature of the storage industry, abundant opportunities most likely continue to lie in store.
Growth Metrics
Here are the 3-year growth figures for FFO (funds from operations), TCFO (total cash from operations), and market cap.
| Metric | 2019 | 2020 | 2021 | 2022* | 3-year CAGR |
| FFO (millions) | $266 | $277 | $400 | $531 | — |
| FFO Growth % | — | 4.1 | 44.4 | 32.8 | 25.9% |
| FFO per share | $3.75 | $3.97 | $5.07 | $6.30 | — |
| FFO per share growth % | — | 5.9 | 27.7 | 24.3 | 18.9% |
| TCFO (millions) | $279 | $299 | $434 | $557 | — |
| TCFO Growth % | — | 7.2 | 45.2 | 28.3 | 25.9% |
* Projected, based on H1 2022 figures; Source: TD Ameritrade, CompaniesMarketCap.com, and author calculations
You just don’t see growth numbers like this every day. LSI remains a bona fide FROG (Fast Rate of Growth REIT), with double-digit growth and rock-solid balance sheet.
At $10.5 billion, LSI sits slightly above the market cap sweet spot, which is the second-best place to be. At the start of 2019, market cap was $4.33 billion, so the 3.5-year market cap growth rate for this company is a sizzling 28.8%.
Meanwhile, here is how the stock price has done over the past 3 twelve-month periods, compared to the REIT average as represented by the Vanguard Real Estate ETF (VNQ).
| Metric | 2019 | 2020 | 2021 | 2022 | 3-yr CAGR |
| LSI share price Aug. 2 | $67.07 | $65.42 | $117.80 | $122.33 | — |
| LSI share price Gain % | — | (-2.5) | 80.1 | 3.8 | 22.18% |
| VNQ share price Aug. 2 | $89.32 | $81.39 | $106.06 | $96.90 | — |
| VNQ share price Gain % | — | (-8.9) | 30.3 | (-8.6) | 2.75% |
Source: MarketWatch.com and author calculations
LSI was only slightly affected by the COVID sell-off, thanks in large part to their introduction of touchless self-service rentals. Then the company was one of the leaders of the REIT boom of 2021, returning a phenomenal 80.1%. LSI has distinctly outperformed the VNQ in each of the past three twelve-month periods, and has rewarded investors with an average Gain of 22.18%, compared to just 2.75% for the VNQ. There is every reason to think that outperformance will continue.
Balance Sheet Metrics
Here are the key balance sheet metrics. LSI’s investment-grade balance sheet sports a FROG-worthy 2.15 liquidity ratio, with a debt ratio of just 18% and Debt/EBITDA a strong 5.4.
| Company | Liquidity Ratio | Debt Ratio | Debt/EBITDA | Bond Rating |
| LSI | 2.15 | 18% | 5.4 | BBB |
Source: Hoya Capital Income Builder, TD Ameritrade, and author calculations
As of June 30, 2022, the Company had approximately $32.6 million in cash on hand, and about $197 million available on its line of credit, for a total of $230 million in dry powder for acquisitions. The company also refinanced its bank credit facility that was scheduled to mature on March 10, 2023, increasing from $500 million to $1.25 billion, extending to January 2027.
Dividend Metrics
In July, LSI announced another 8% increase in the annual dividend, bringing the 3-year dividend growth rate to a sizzling 17.4%, more than doubling the Storage REIT average, and almost tripling the overall REIT average. Together with an above-average current Yield of 3.53%, unusual for a Storage REIT, this results in an outstanding Dividend Score of 4.87. LSI just keeps putting larger and larger amounts of cash into investors’ pockets as the years go by. If anything, the dividend is a little too safe, with a grade of B from Seeking Alpha Premium.
| Company | Div. Yield | 3-yr Div. Growth | Div. Score | Payout | Div. Safety |
| LSI | 3.53% | 17.4% | 4.87 | 70% | B |
Source: Hoya Capital Income Builder, TD Ameritrade, Seeking Alpha Premium
Dividend Score projects the Yield three years from now, on shares bought today, assuming the Dividend Growth rate remains unchanged.
Valuation Metrics
Growth this spectacular usually comes at a premium price, but not so with LSI. This year’s sell-off has put the price/FFO at 20.2, almost dead even with the REIT average, as is the 4.5% discount to NAV. This is an attractive entry price point.
| Company | Div. Score | Price/FFO ’22 | Premium to NAV |
| LSI | 4.87 | 20.2 | (-4.5%) |
Source: Hoya Capital Income Builder, TD Ameritrade, and author calculations
What Could Go Wrong?
LSI runs the same risks as any other company that relies on acquisitions for external growth, as those acquisitions don’t always prosper as expected. Changes in interest rates may affect their ability to acquire or finance new properties or redevelop existing sites, or may suppress cap rates.
The REIT storage sector is very competitive, with several strong players, including National Storage Affiliates, especially in the prized Sun Belt markets. Increased competition for deals could also drive down cap rates on new acquisitions.
Self-storage units are relatively easy to build, and industry oversupply could depress rental growth. So far, however, supply does not appear to be catching up.
Investor’s Bottom Line
Double-digit growth in revenue, cash flow, share price, and dividend growth, maintained for 3 straight years, with no sign of slowing down any time soon, all at a price that is more than fair. That’s what LSI offers investors. For long-term investors, this company is as close to a slam dunk as it gets. I rate this company a Strong Buy. In the short run, I would not be surprised if the entire REIT market pulls back significantly before going on to all-time highs this year or next.
Seeking Alpha Premium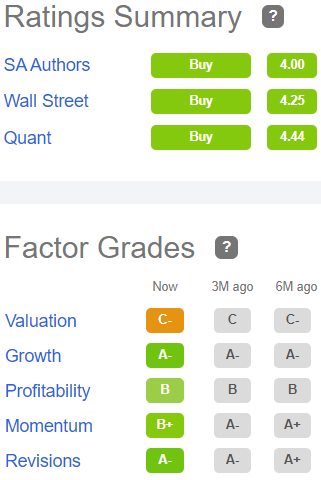
Buy seems to be the consensus of Wall Street analysts, as well as the Seeking Alpha Quant ratings and The Street. TipRanks and is Neutral, and Zack’s says Hold. The company has earned a return of 9.15% on equity and asset growth of 37.09% in the past 12 months.
Be the first to comment