

Nasdaq 100 Forecast:
Nasdaq 100 Price Outlook: Levels to Watch Ahead of Big-Tech Earnings
The Nasdaq 100 has been the best performing index of the three major US baskets and it has reclaimed much of what it had lost in the coronavirus crash as a result. Now, however, the tech-heavy index will have to weather a string of earnings from its most influential components. For only the third time ever, according to Bloomberg, the five largest stocks of the S&P 500 will report their quarterly findings in the same week.
Apple, Amazon, Microsoft, Google and Facebook Lead Stock Rebound
Chart created in TradingView
These five stocks, Facebook, Microsoft, Apple, Amazon and Google, are also the five largest stocks on the Nasdaq 100 and have been a major area of strength for the broader US indices. In total, the five stocks account for roughly 45% of the Nasdaq 100 and each of them – like all other stocks at the moment – has a highly uncertain future. Therefore, earnings season will provide investors valuable insight with which they can use to conclude whether the degree of outperformance witnessed in recent weeks was warranted or entirely unfounded.

Recommended by Peter Hanks
Traits of Successful Traders
As we saw with Netflix last week, stellar results can still fall short of market expectations. Since the economy and stock market are in such an unusual environment, market participants have rightfully displayed apprehension around diving back into equity exposure, barring the tech stocks highlighted. Thus, even if the corporations can deliver a relatively strong showing, market expectations may have dealt the companies a losing hand regardless.
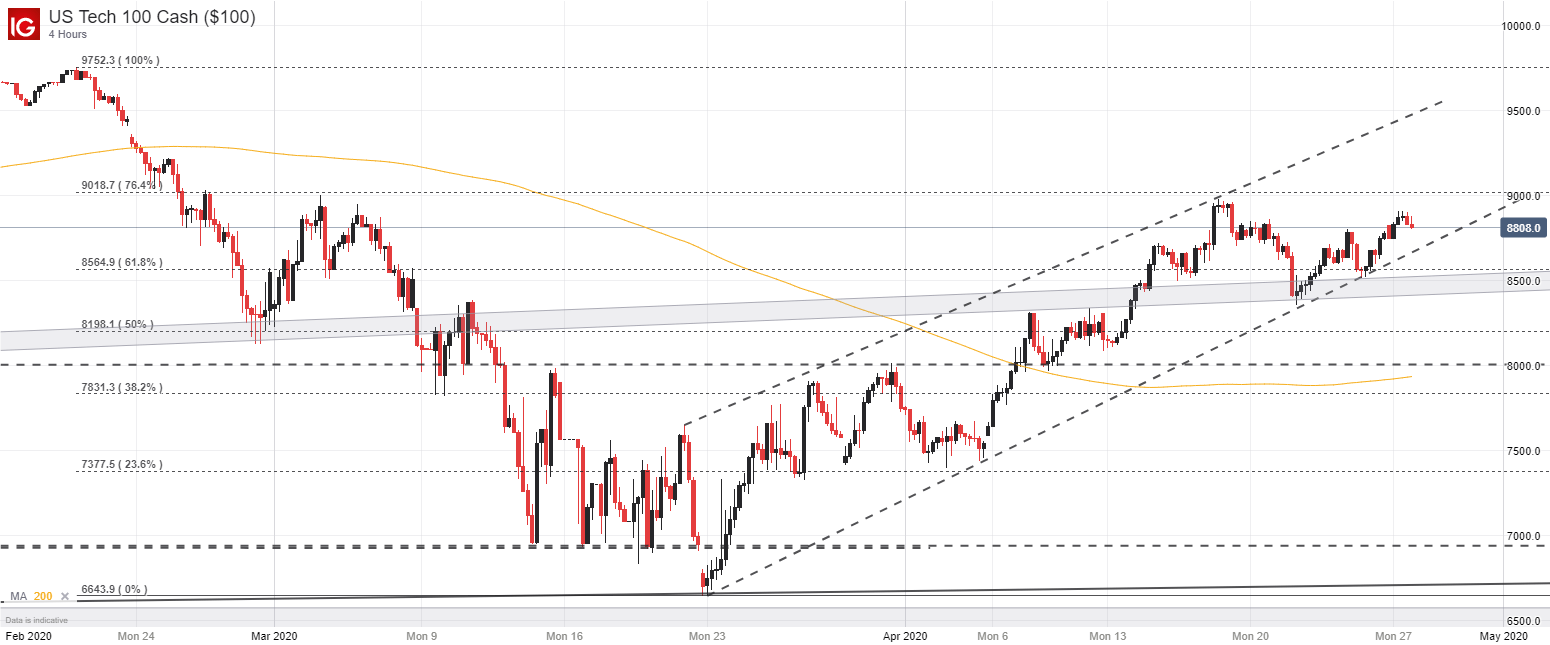
With the Nasdaq teetering on the lower bound of an ascending channel and lofty earnings expectations on the fundamental side, it seems risk is tilted to the downside at this stage. That being said, the Nasdaq 100 may look for support beneath around the 8,565 area where a Fibonacci level intercepts a rising band of support. Together, the technical markers will look to keep the index afloat, while a bearish break beneath could see the Nasdaq probe subsequent support around 8,200 and eventually 8,000.
Nasdaq 100 Price Chart: 4 – Hour Time Frame (February 2020 – April 2020)

On the other hand, a string of strong earnings reports from the largest tech stocks could add the fuel needed to allow the index to surmount nearby resistance at roughly 9,000. The zone stalled a previous attempt higher earlier this month and marks the Nasdaq’s highest level since late February. A move above this point would likely allow for further gains to be established.
Starts in:
Live now:
Apr 29
( 15:04 GMT )

Recommended by Peter Hanks
Weekly Stock Market Outlook
In the meantime, follow @PeterHanksFX on Twitter for updates and analysis as traders prepare for the release of high-profile earnings, which kicks off Tuesday afternoon with Google and is followed by Microsoft and Facebook on Wednesday and Apple and Amazon on Thursday.
–Written by Peter Hanks, Junior Analyst for DailyFX.com
Contact and follow Peter on Twitter @PeterHanksFX
Be the first to comment