


magicmine/iStock via Getty Images
Investment summary
We continue to advocate the buy thesis on LeMaitre Vascular, Inc. (NASDAQ:LMAT) based on compelling long-term value. We are long-term holders of LMAT and were pleased with the company’s most recent set of numbers.
After gyrating within a narrow range from February–June, the stock has caught a bid since the June/July bounce in equities and has retraced at least 50% of its 12-month downside. We estimate LMAT is positioned well to capitalize on favourable trends within the capital budgeting cycle in the health care sector, and will continue unlocking long-term shareholder value. Rate buy at $63.92 valuation.
Exhibit 1. After a consolidation period reaching 52-week lows of $38, LMAT has retraced ~50% of the entire downward leg.
Moreover, long-term trend indicators [shown here via on balance volume] are supportive of additional weight into the upside move. This is important information about the market’s psychology around the stock.
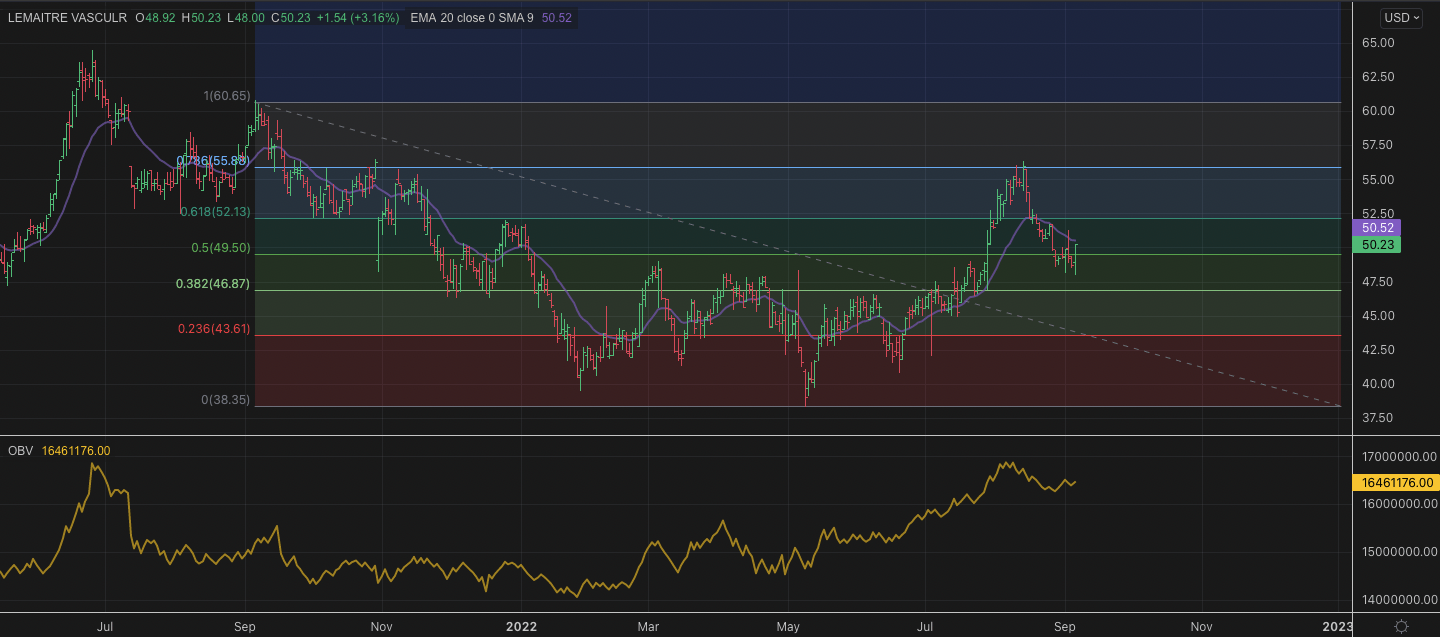
Note: 12-month price action shown in Fibonacci retracement. Shares now look to test $50 after several days in this range. A 100% retracement would see the LMAT share price nudge to approx. $60.50. (Data: HB Insights; Refinitiv Eikon)
Capital allocation key upside driver
Whilst we’ve downgraded equities in our strategic allocation, LMAT has remained a key position within the equity risk budget. It was pleasing to see, therefore, another quarterly double-digit ROIC on net operating profit after tax (“NOPAT”) of $5.63mm. This is down on sequential periods [$6.29mm in Q1 FY21; $8.82mm in Q2 FY21] but we also note higher variable expenditures tied into OPEX secondary to the company’s higher revenue print.
Nevertheless, as seen in Exhibit 2, return on investment trends have remained buoyant on a TTM basis since FY15, and have recovered from the pandemic. Despite a narrowing in both NOPAT and ROIC since FY21, LMAT still printed 9.92% return from its invested capital last quarter.
Exhibit 2. TTM ROIC continues to remain top-heavy whilst NOPAT has tightened up on higher OPEX, yet still above pre-pandemic numbers.
We have here a cash compounder that has secured a 3-year average 12.3% ROIC, whilst the balance sheet remains debt free.
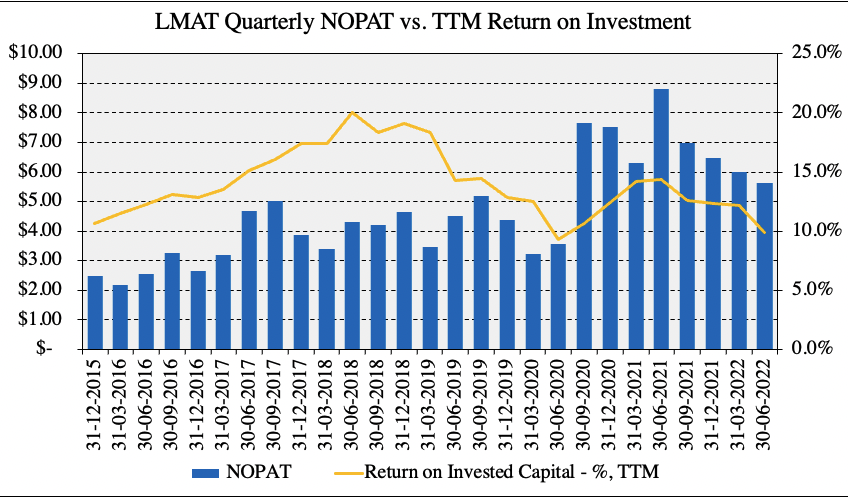
Note: Return on Invested Capital is calculated with R&D investment capitalized from the income statement as intangible onto the balance sheet. We assume a 5-year useful life and straight-line amortization. This results in an increase in quarterly invested capital, but marginal change to ROIC. (Data: HB Insights; LMAT SEC Filings)
LMAT clipped $9.2mm in cash from operations for the quarter as well bringing its cash balance to $75.7mm [+670bps YoY]. This creates an interesting dilemma for the company moving forward. It paid out $2.7mm in dividends during the quarter at $0.13/share [grown for 11 consecutive years], although this is paltry in comparison to what its balance sheet is capable of. Management notes the capital allocation strategy looking ahead is targeted at acquisitions. Per CFO, David Roberts on the Q2 earnings call:
“…we do think valuations are slowly coming down. We saw that PE firm take Natus private for less than 3x sales... our team is out hunting as we always do for these core open vascular products, disposables and implantables with, I don’t know, $10 million or more of revenue ideally in rivalry markets. So while hunting, we have a pipeline, but things have to go correctly for us to pull the trigger.”
As seen in Exhibit 3, the company’s capital budgeting cycle has been well reflected into its market price, and this demonstrates strong fundamental momentum into a weakening economic climate. Acquisitions moving forward would likely add to the company’s $70.8mm in identified intangibles, that are well defined in the latest set of numbers, seen in Exhibit 4.
Exhibit 3. Market cap and Enterprise value have been well tied to the company’s capital budgeting cycle
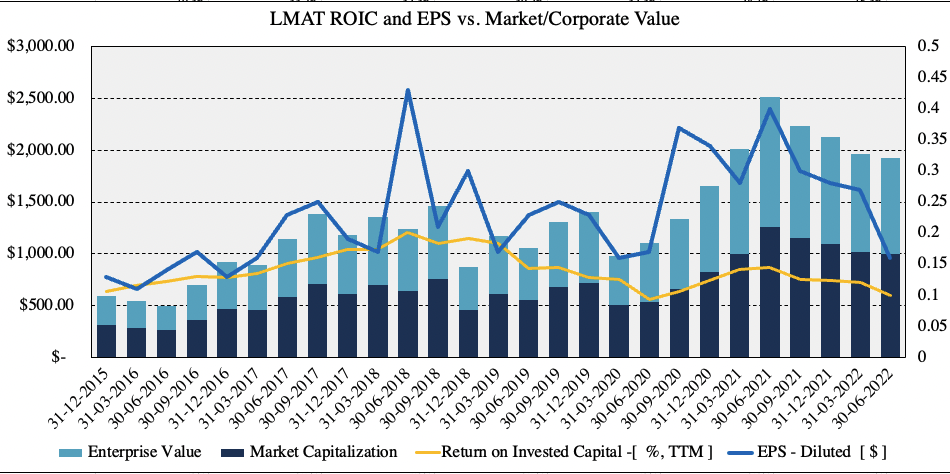
Note: Market cap. and Enterprise Value are reflected as one composite. (Data: HB Insights, LMAT SEC Filings)
Exhibit 4. Identified intangibles clearly defined, sources of valuation transparently displayed. Noted is $21mm amortization expense.
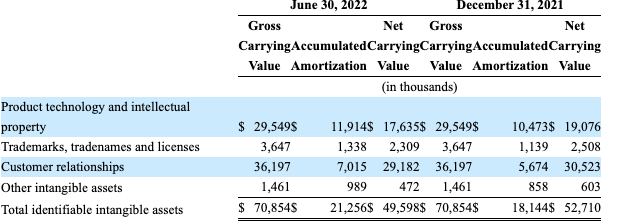
Data: LMAT 10-Q Q2 FY22
Q2 earnings comments – quite satisfactory
LMAT came in with another strong set of numbers with growth across the portfolio. Revenue of $42mm grew 400bps YoY and 8% organically. Underscoring the growth was LMAT’s biologics’ segment, that now represents ~50% of turnover. The allografts and Artegrafts businesses were up 25% and 11% YoY respectively whereas XenoSure came in with a 21% YoY gain. Management also estimate a $6.2mm forex headwind by year’s end.
It also finalized the closure of its St. Etienne factory in France. From this, it transferred the manufacturer of Chevalier valvulotomes to its Burlington facility instead. It intends to move its Wovex and Dialine customers over to its Burlington-produced AlboGraft polyester grafts. There was a more than expected $3.1mm special charge with the closure – but it is estimated to save ~$1mm/year, alas the payback will be in year three.
Moving down the P&L, the sales and marketing expenditure margin came in 300bps higher YoY to 20% of turnover, as it has brought the number of sales reps on its books back to 111 – just one short of before the pandemic, and up from 88 the year prior. Hence, revenue per rep was $378,378, down from $462,159 the year prior. However, we note the leverage the additional reps are likely to create on a forward looking basis.
Meanwhile, FCF of $8.28mm was flat YoY and came into $5.53mm net of dividends. LMAT’s bridge from Gross profit-FCF net of dividends is shown in the Exhibit below.
Exhibit 5.
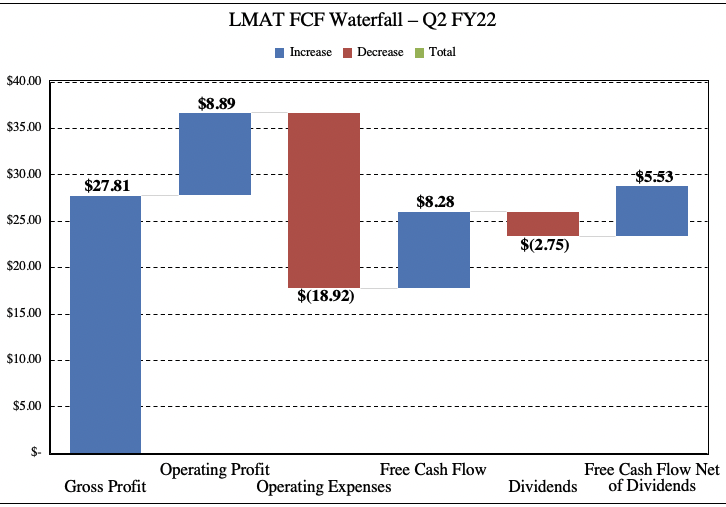
Note: (1). All figures are in $millions. (2). FCF calculated as NOPAT – investments. (3). OPEX inclusive of R&D investment under GAAP accounting. (Data: HB insights, LMAT)
Valuation and conclusion
LMAT now projects Q3 FY22 sales of $39-$41mm, representing a 10% YoY organic growth. Our research team is aligned with this, and forecasts FY22 sales of $163mm, stretching up to $174mm the year after, with FCF of $29mm forecast this year, as seen below.
Exhibit 6. LMAT forward estimates, quarterly and annual: FY22–FY24
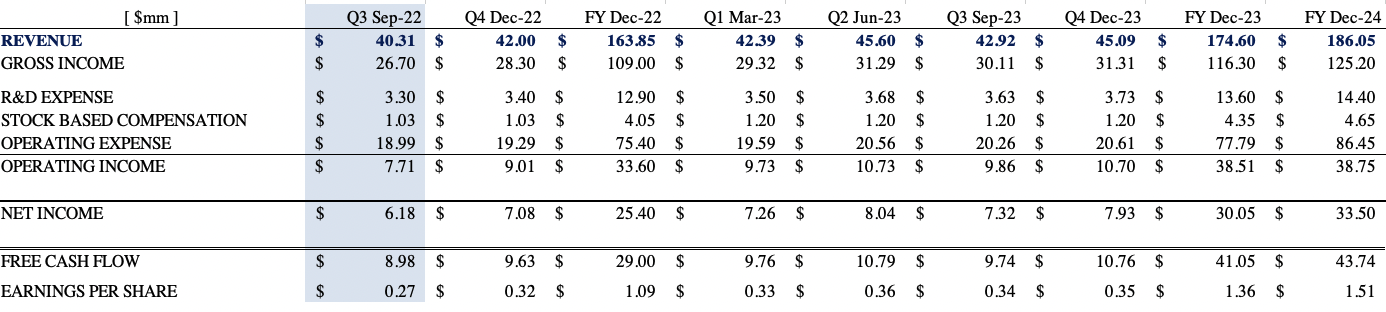
Data: HB Insights estimates
The market consensus also has LMAT priced at 47x forward earnings, well ahead of the sector median’s ~24x, suggesting investors are pricing in an above-market result for the company at the bottom line. Assigning the 47x multiple to our FY23 EPS estimates of $1.36 sets a price target of $63.92, ~27% return potential from the current market price.
With these points in mind we reiterate the buy thesis for LMAT and value the stock at $63.92.
Be the first to comment