

SergeyZavalnyuk
Labrador Iron Ore Royalty Corporation (OTCPK:LIFZF) is a mis-understood company. I have seen recent analysis from analysts who do not understand the cyclical nature of the commodities business and LIORC’s revenue model and touted the stock as a buy earlier in the year based on a backwards looking 15% dividend yield.
I’m not writing this article as direct criticism of those analysts per se, but merely to improve the overall understanding of the resource investing space.
Buying commodity companies on the downswing can be a very painful experience. A high current dividend would not offset the mark to market price loss. I think investors are best served waiting until the global economy stabilizes, especially the property market in China, as China consumes over 50% of global iron ore.
Company Background
Labrador Iron Ore Royalty Company (“LIORC”) is a bit of an oddity. It owns a 15.1% equity stake in Iron Ore Company of Canada (“IOC”), and receives a 7% gross overriding royalty and a 10 cent per ton commission on all iron ore products produced and sold by IOC. LIORC trades on the Toronto Stock Exchange under the ticker (“LIF”), and has much better liquidity there.
IOC is one of the largest iron ore pellet and concentrate producers in North America and is a major player in the seaborne pellet trade. Rio Tinto PLC (RIO), one of the world’s largest iron ore producers, owns a 58.7% majority share of IOC and is the operator, while Mitsubishi Corporation (OTCPK:MSBHF) owns 26.2% and LIORC owns 15.1%.
IOC was incorporated in 1949 and began shipping iron ore out of the Sept-Iles port in 1954. In 1958, IOC began work on the Carol Lake project, near Labrador City, on mining leases held by the predecessor of LIORC. Ore from the Labrador City mine began shipping in 1962 and the mine has been in operation for over 60 years. Investors interested in learning more about IOC and its mining operations are encouraged to follow the link at the beginning of this paragraph.
IOC’s concentrating plant has a nominal capacity to produce 23 million tons of iron ore concentrate per year. Actual production and sales are less than that and are dependent on ore quality and market conditions. In 2021, IOC sold 17.0 million tons (10.0 million pellets and 7.0 million concentrates), down 8.6% YoY from 2020 (Figure 1).
Figure 1 – IOC Historical Sales Tonnage (LIORC investor presentation)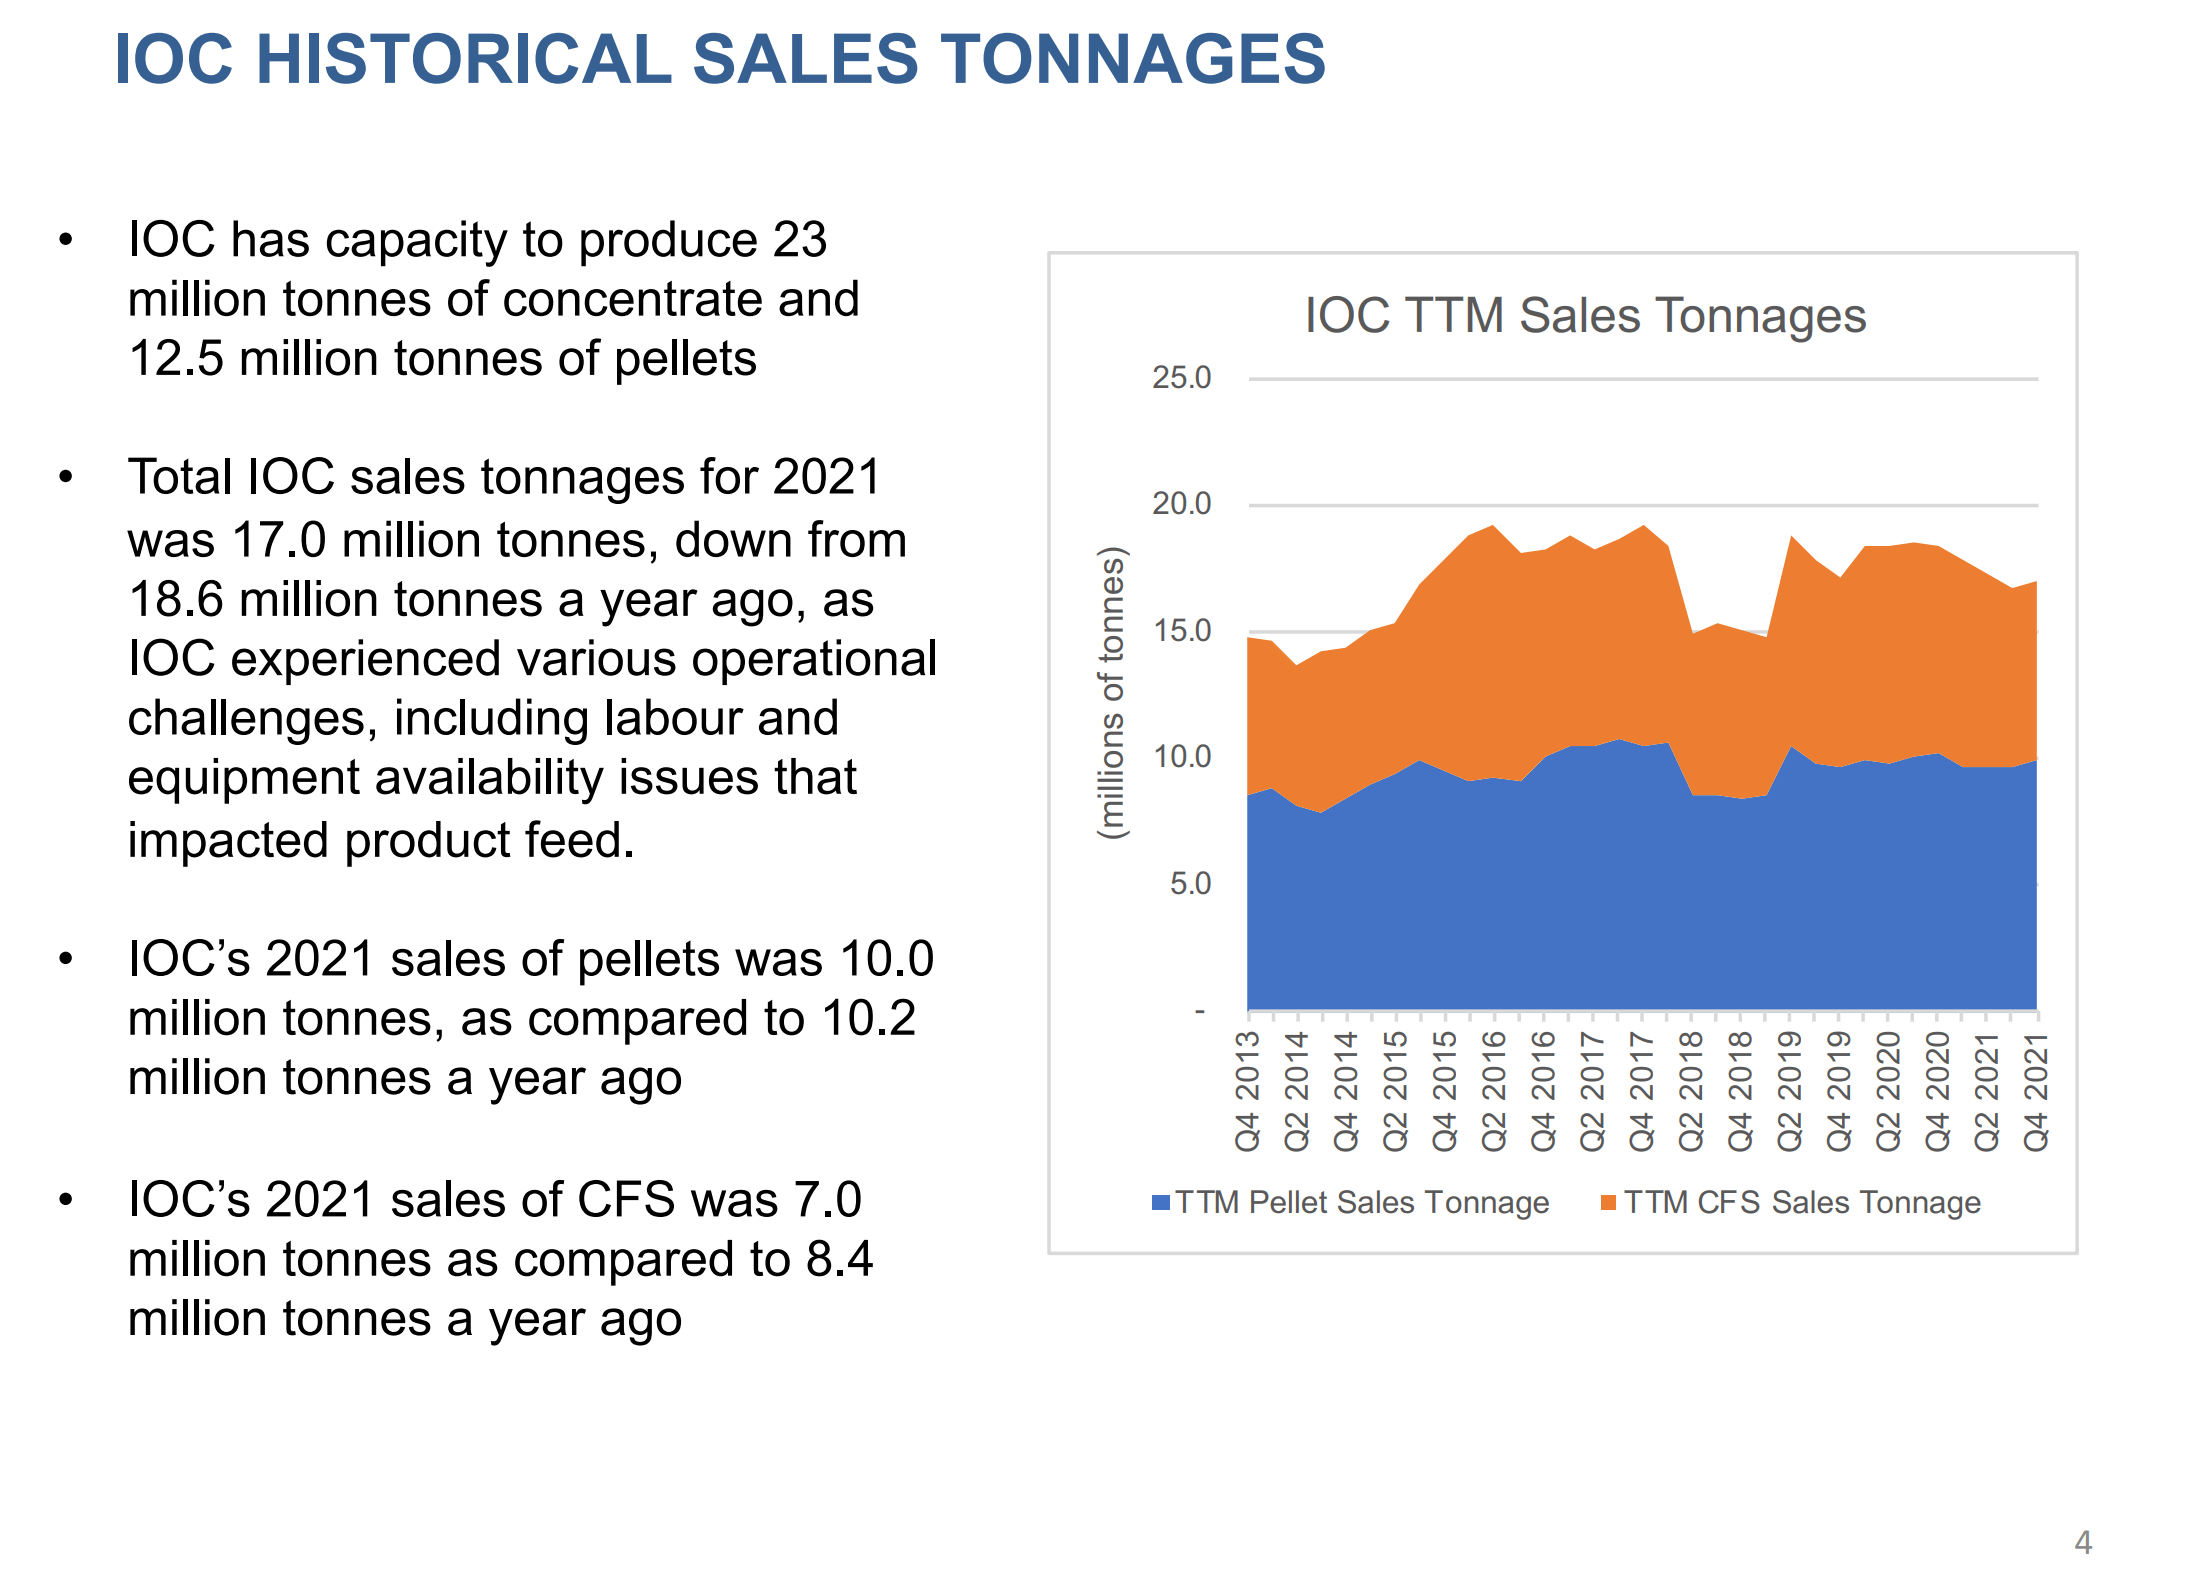
Although IOC has been in operation for 60+ years, it still has a lot of ore reserves. As of December 31, 2021, IOC has estimated reserves of 1.1 billion tons of iron ore that can be processed into approximately 0.5 billion tons of saleable product (concentrator plant takes 39% ore and ‘concentrate’ them into 62% or 65% Fe pellets or concentrate). At current processing rates, there are more than 20 years of ore reserves. In addition, IOC has 1.7 billion tons of resources that can be converted into reserves in the future.
Figure 2 – IOC’s mineral reserves (LIORC investor presentation)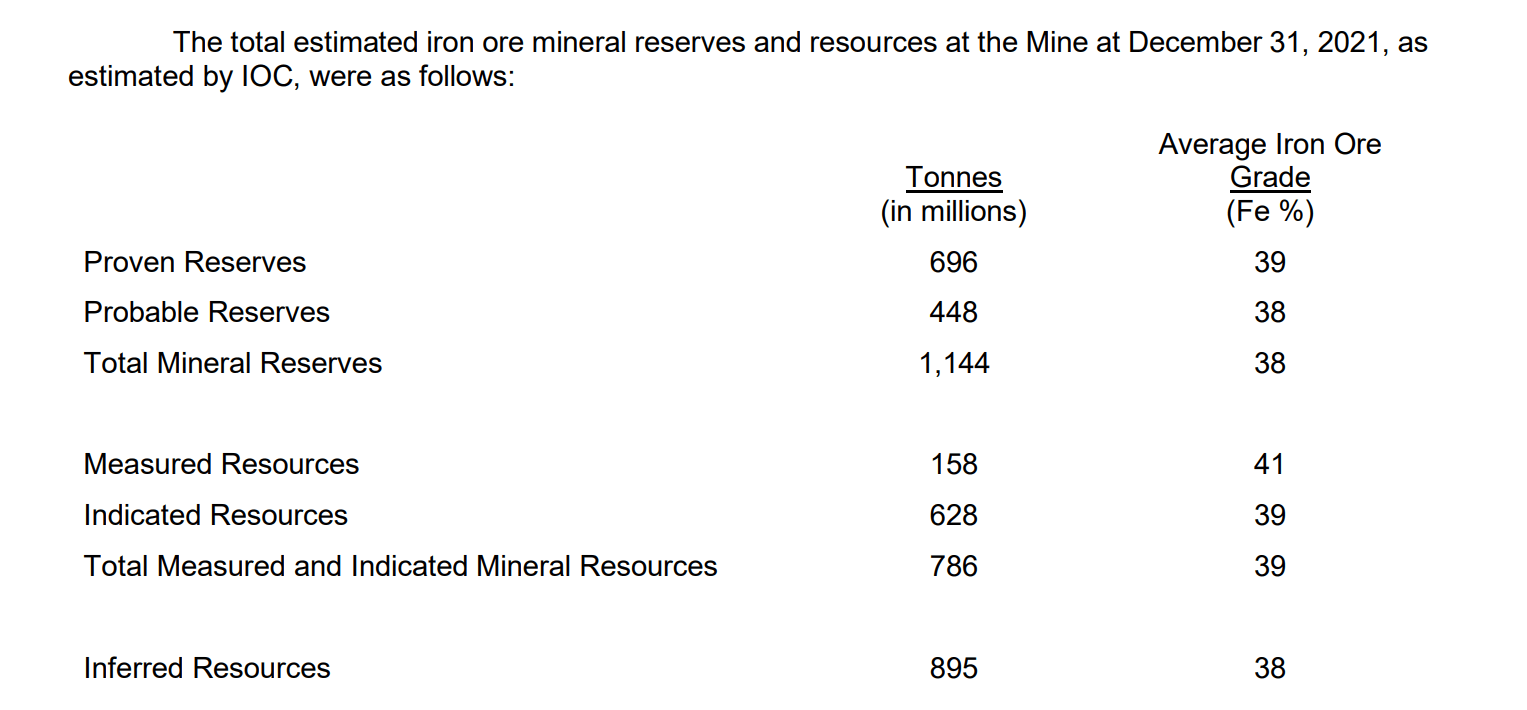
LIORC’s Revenue Model
LIORC earns revenues and cash flows in one of three ways: IOC Royalty, IOC Commissions, and IOC Equity (proportionate share of IOC earnings and dividends paid by IOC to its stockholders).
LIORC’s IOC Commission revenue is miniscule, totaling a nominal C$1.7 million and C$1.8 million in 2021 and 2020 respectively. Hence I will ignore it for my analysis below.
Royalty Revenue Driven By Iron Ore Prices
As mentioned previously, LIORC earns a 7% gross overriding royalty on all sales of iron ore products produced by IOC. From this royalty income, a tax of 20% is payable to the Government of Newfoundland and Labrador. As the royalty income is based on sales, it is not dependent on the profitability of IOC. Instead, it fluctuates with sales volumes and the price of iron ore. When realized iron ore prices are high, for example in 2021, IOC had realized iron ore prices of US$185 / ton, the royalty revenue to LIORC is commensurately high, at C$278 million. However, in a more moderate price environment, for example in 2020, realized iron ore prices for IOC were US$117 / ton, royalty income was more moderate, at C$200 million.
Figure 3 shows a 10-year price chart of iron ore prices. Notice that 2021 had one of the highest iron ore prices ever, driven by a perfect storm of a surge in Chinese steel production and COVID-19 supply disruptions, particularly in Brazil. Fast forward to 2022, we are now witnessing a collapse in the Chinese real estate market and a slowing global economy, which has brought iron ore prices tumbling back to earth near US$100 / ton.
Figure 3 – Iron ore prices surged in 2021 (Tradingview.com)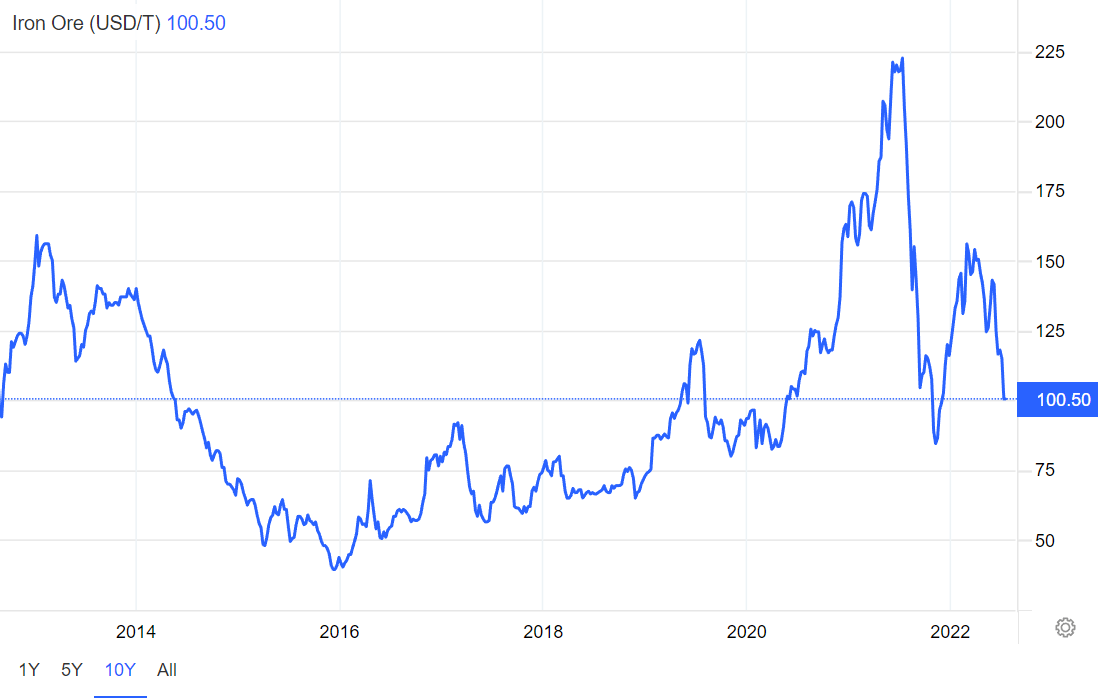
This has caused LIORC’s royalty revenue to likewise decrease, with Q1/2022 royalty revenue falling 18% YoY from C$65 million to C$54 million. Given continued weakness in the Chinese property market (China consumes roughly half of the world’s iron ore, see Figure 4), iron ore prices will likely continue to weaken in the coming quarters, which does not bode well for royalty income. For context, in 2018 when IOC had realized iron price of $US$93 / ton, LIORC recorded C$129 million in royalty revenue.
Figure 4 – China is the gorilla in iron ore consumption (LIORC investor presentation)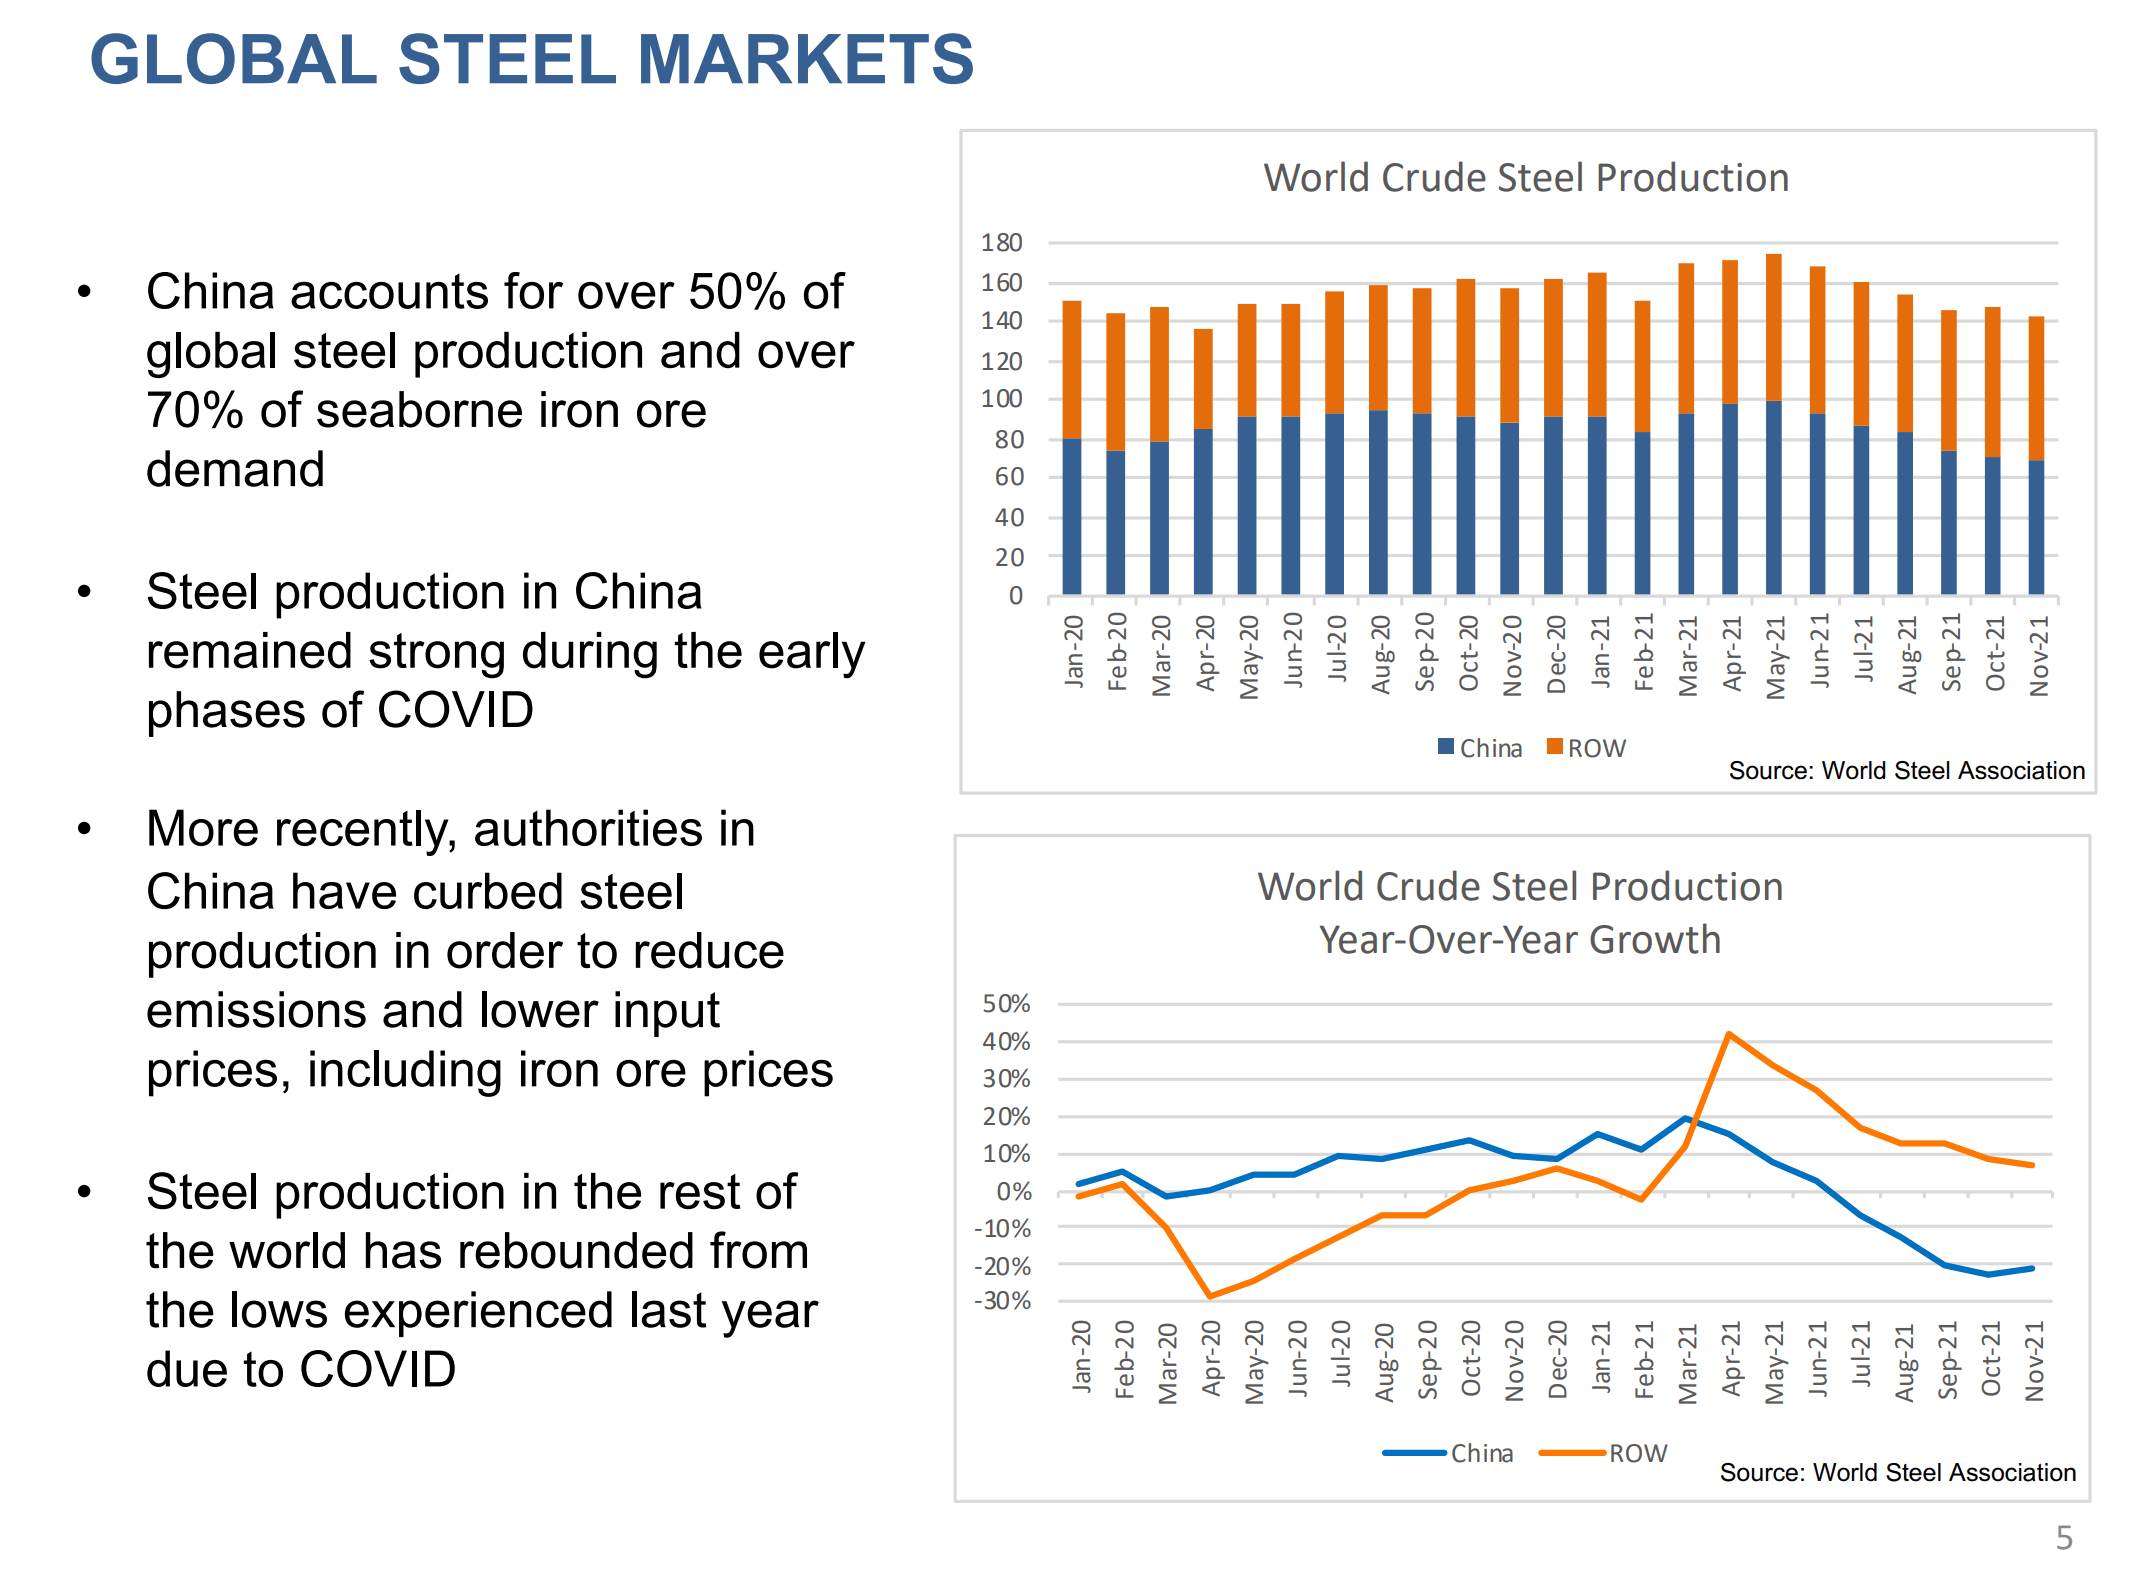
Pellet Premium Could Help On The Margin
What could help LIORC in terms of realized price is a continuation of a premium for iron ore pellets. Basically, iron ore in pellet form has less impurities, which gives steel mills using them a lower carbon footprint. As the world has focused on ESG and decarbonization, high iron content pellets have increasingly commanded a premium to concentrates, with premiums running as high as US$60 a ton in 2021. However, this premium has recently tumbled, as the global economy has slowed and steel mills are more focused on their own profitability (Figure 5).
Figure 5 – Pellet premiums have tumbled (S&P Global Commodity Insights)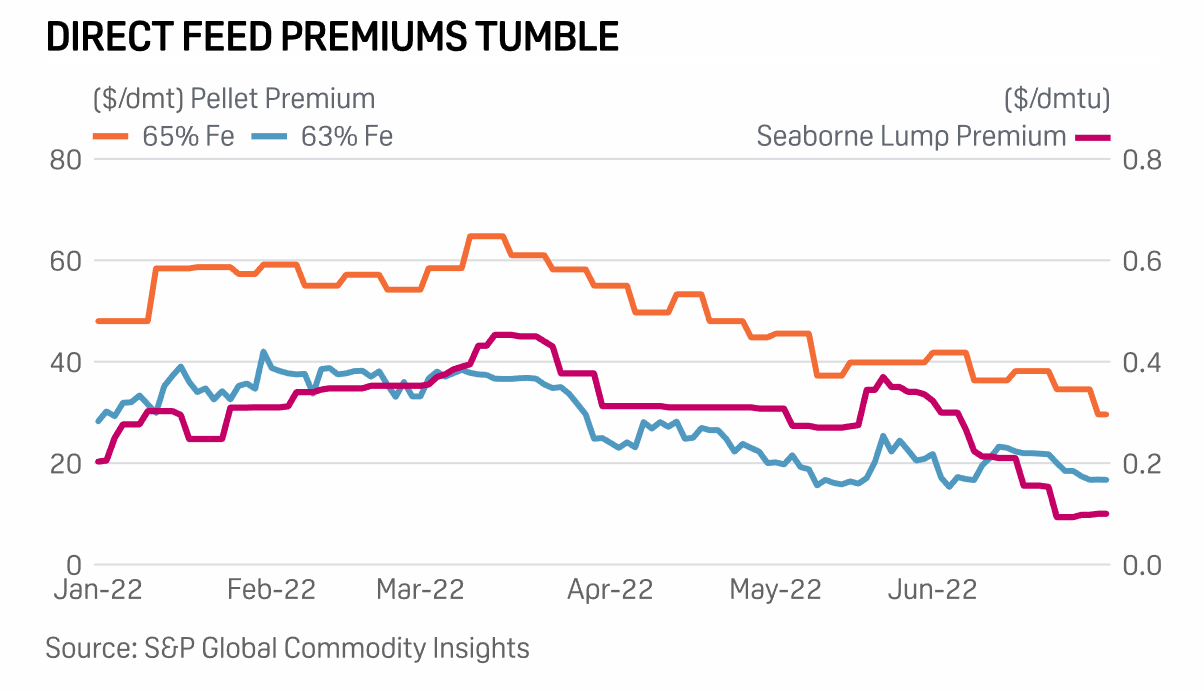
IOC Profitability Drives Dividend To LIORC
The other big driver of LIORC’s earnings and dividend is its 15.1% proportionate share of IOC earnings and cash flows. In 2021, with skyrocketing iron ore prices, IOC generated C$1.96 billion in operating cash flow and paid C$1.5 billion in dividends to stockholders (LIORC received C$228 million). This was a big change from 2020, when IOC generated C$837 million in operating cash flows and paid C$573 million in dividends (LIORC received C$87 million). Figure 6 has selected financial figures from IOC and Figure 7 shows financial highlights of LIORC.
Figure 6 – IOC financials (LIORC 2021 annual report) Figure 7 – LIORC financial highlights (LIORC 2021 annual report)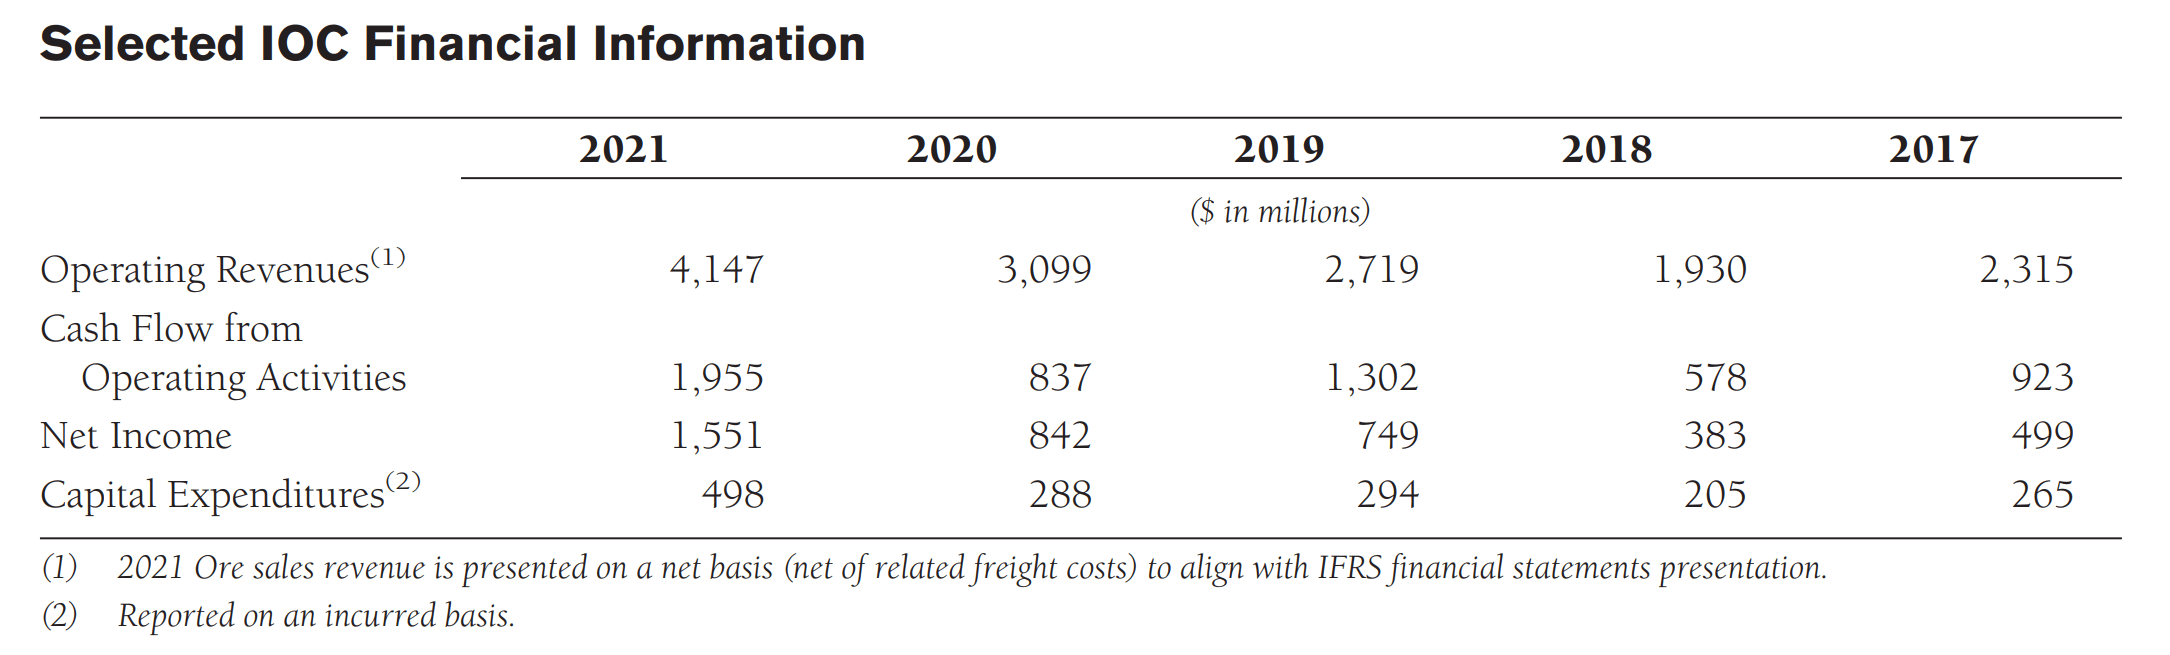
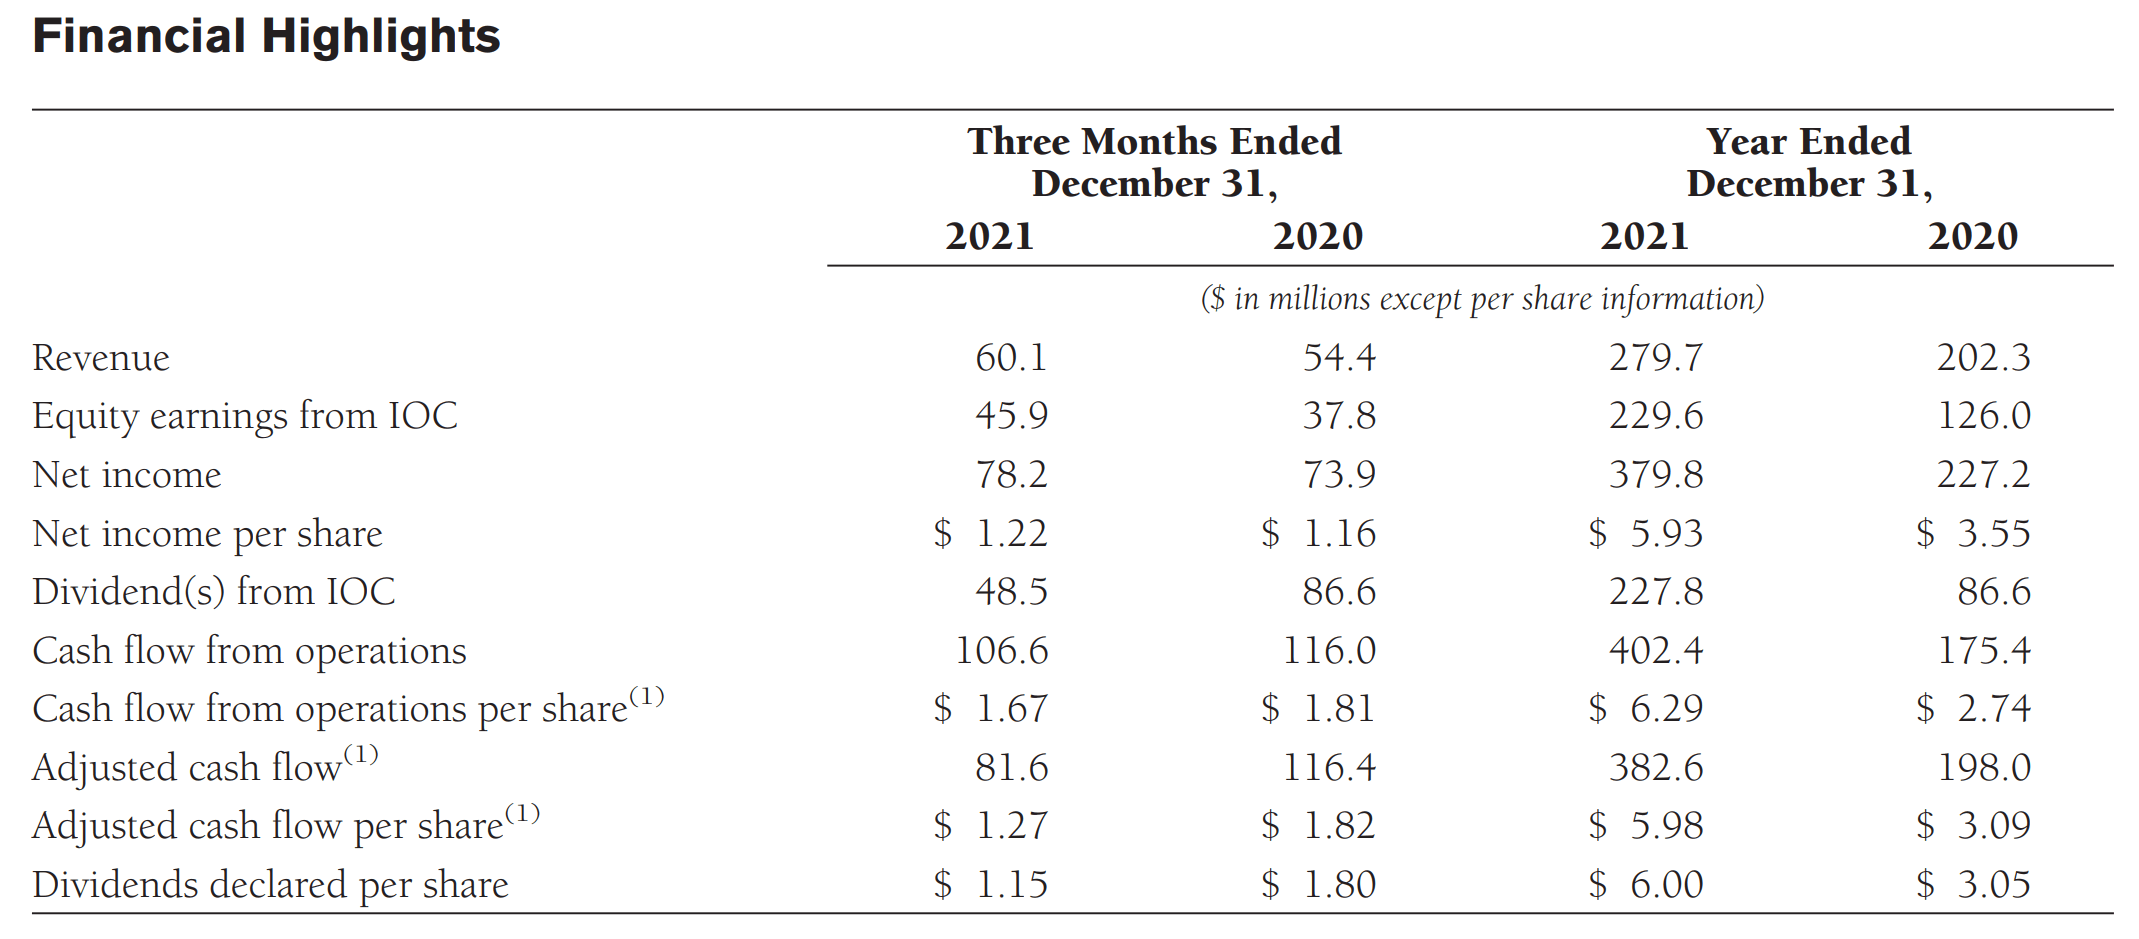
As we can see, the iron ore price surge had a larger YoY impact on LIORC’s IOC Equity earnings and dividends than royalty revenues. This is because equity earnings and dividends are a function of profitability. Combing through LIORC’s annual information form (“AIF”, all Canadian companies report additional information in their AIF, which can be found on SEDAR), we find details on IOC’s cash costs. This is summarized in Figure 7.
Figure 7 – IOC COGS (LIORC 2021 AIF)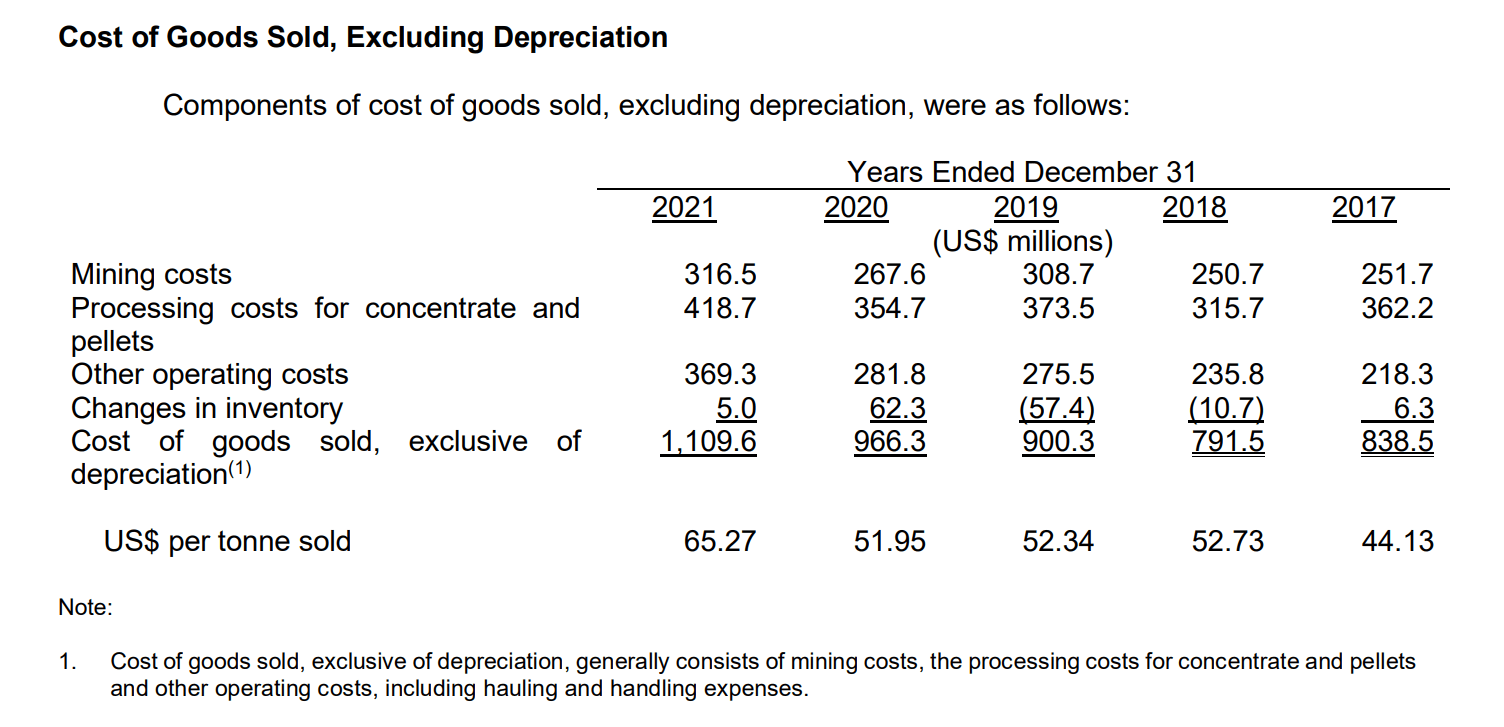
From the figure, we can see that IOC’s mining and processing costs have increased from US$44 / ton in 2017 to US$65 / ton in 2021. In general, higher mining volumes lead to lower costs (as fixed costs are spread over more volume). In 2017, IOC produced 20.1 million tons of iron ore, versus 17.9 million tons in 2021. 2021’s throughput was negatively impacted by COVID-19 which affected labour and equipment availability, as well as logistics issues. Another factor that affected 2021 costs was a March fire at the Sept-Ile port facility, which forced the company to use mobile conveyors to transport ore, reducing efficiency and adding to costs.
On a go-forward basis, 2021 costs of US$65 / ton are probably too high and I would expect COGS to be closer to US$52-55 / ton. However, with lower iron ore prices, we are probably looking at IOC Equity earnings and cash flows closer to 2019 levels, with the caveat that capex is estimated to be C$600 million for 2022 instead of C$294 million as reported in 2019, as a catch up for expenditures delayed due to COVID-19 (please refer to the Outlook section in the annual report).
Putting It Together
Once we are able to pull apart and put back together LIORC’s sources of revenues and cash flows, then we can begin to think about potential dividend for 2022 and beyond.
Assuming iron ore prices stay in the $90-100 range for the rest of the year, my expectation is for LIORC royalty revenues to be roughly at 2019 levels of C$140 million, net of royalty taxes to the government. This should provide C$1.50 in royalty cash flows per LIORC share.
For equity earnings and dividends, we highlighted 2019 levels with adjustment for higher capex may be appropriate. From Figure 8 below, we see that in general, IOC’s capital expenditures and dividends paid are roughly equal to cash flows from operations. From 2017 to 2021, IOC generated US$4.4 billion in operating cash flows, spent US$1.2 billion in capex, and paid US$3 billion in dividends.
Figure 8 – IOC Cash Flow data (LIORC 2021 AIF)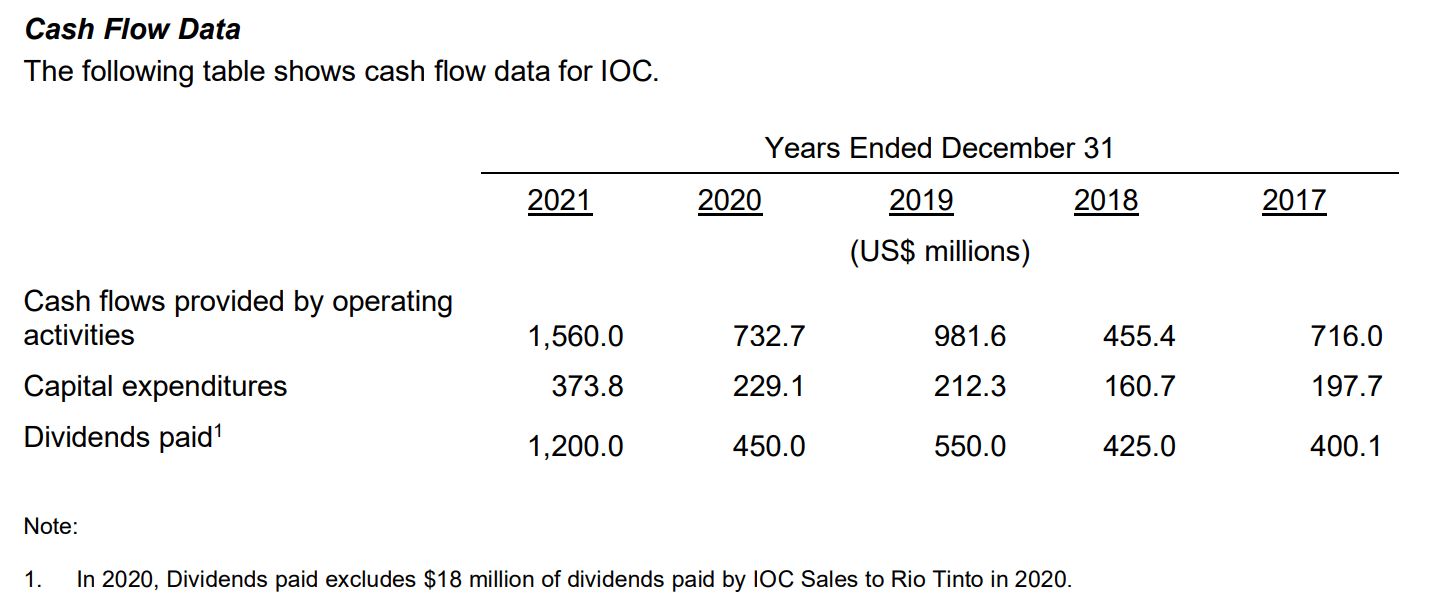
Using this information, if we assume 2022 cash flows will be similar to 2019 at US$1 billion (or C$1.3 billion), we come up with an estimated C$700 million that can be distributed as dividends after capital expenditures. LIORC’s 15.1% share could be approximately C$100 million, or C$1.50 per LIORC share.
In total then, my best guess for 2022 distributable cash flows from LIORC is approximately C$3.00 per share, or a 50% decrease from 2021’s C$6.00 per share.
So far in 2022, LIORC has declared $1.40 in dividends ($0.50 in March and $0.90 in June), so my estimate above appears to be in the right ballpark.
Valuation
At a current price of C$26.67, LIORC is trading at a dividend yield of 11.5% based on my estimate, or 10.5%, annualizing the H1/2022 payment of $1.40. This is certainly a very high dividend yield, compared to the S&P 500’s dividend yield of 1.7%.
The challenge to analysing LIORC purely on the dividend yield is that the global economy is still slowing, with many signs that a recession is highly probable. So investing in a cyclical commodity company may not be the best idea at the moment. Or in other words, there are significant downside to our C$3.00 estimated dividend for 2022.
Risks To Labrador Iron Ore
We had mentioned this briefly, but the biggest risk to investing in LIORC is the global economy (China in particular), and the iron ore price. In 2015/2016, when China last faced a growth challenge, iron ore prices plunged to sub $50 per ton. It is not inconceivable that in a global recession, iron ore prices can once again fall to those levels.
At US$50 iron ore price, IOC will not be profitable, and LIORC will only receive royalty revenues. At an estimated 20 million tons of production, royalty revenues could fall to C$91 million or C$0.80 per share in cash flows.
For reference, LIORC’s 2015 royalty revenue was C$100 million and it had C$0.88 / share in distributable cash flows. In January 2016, LIORC was trading at sub C$4 (Figure 9).
Technically, Labrador’s stock chart has broken down from a large top and is testing support at C$25. At the moment, there is still no signs of a deceleration in the downside momentum.
Figure 9 – LIORC has broken down from a large top (Author created with price chart from stockcharts.com)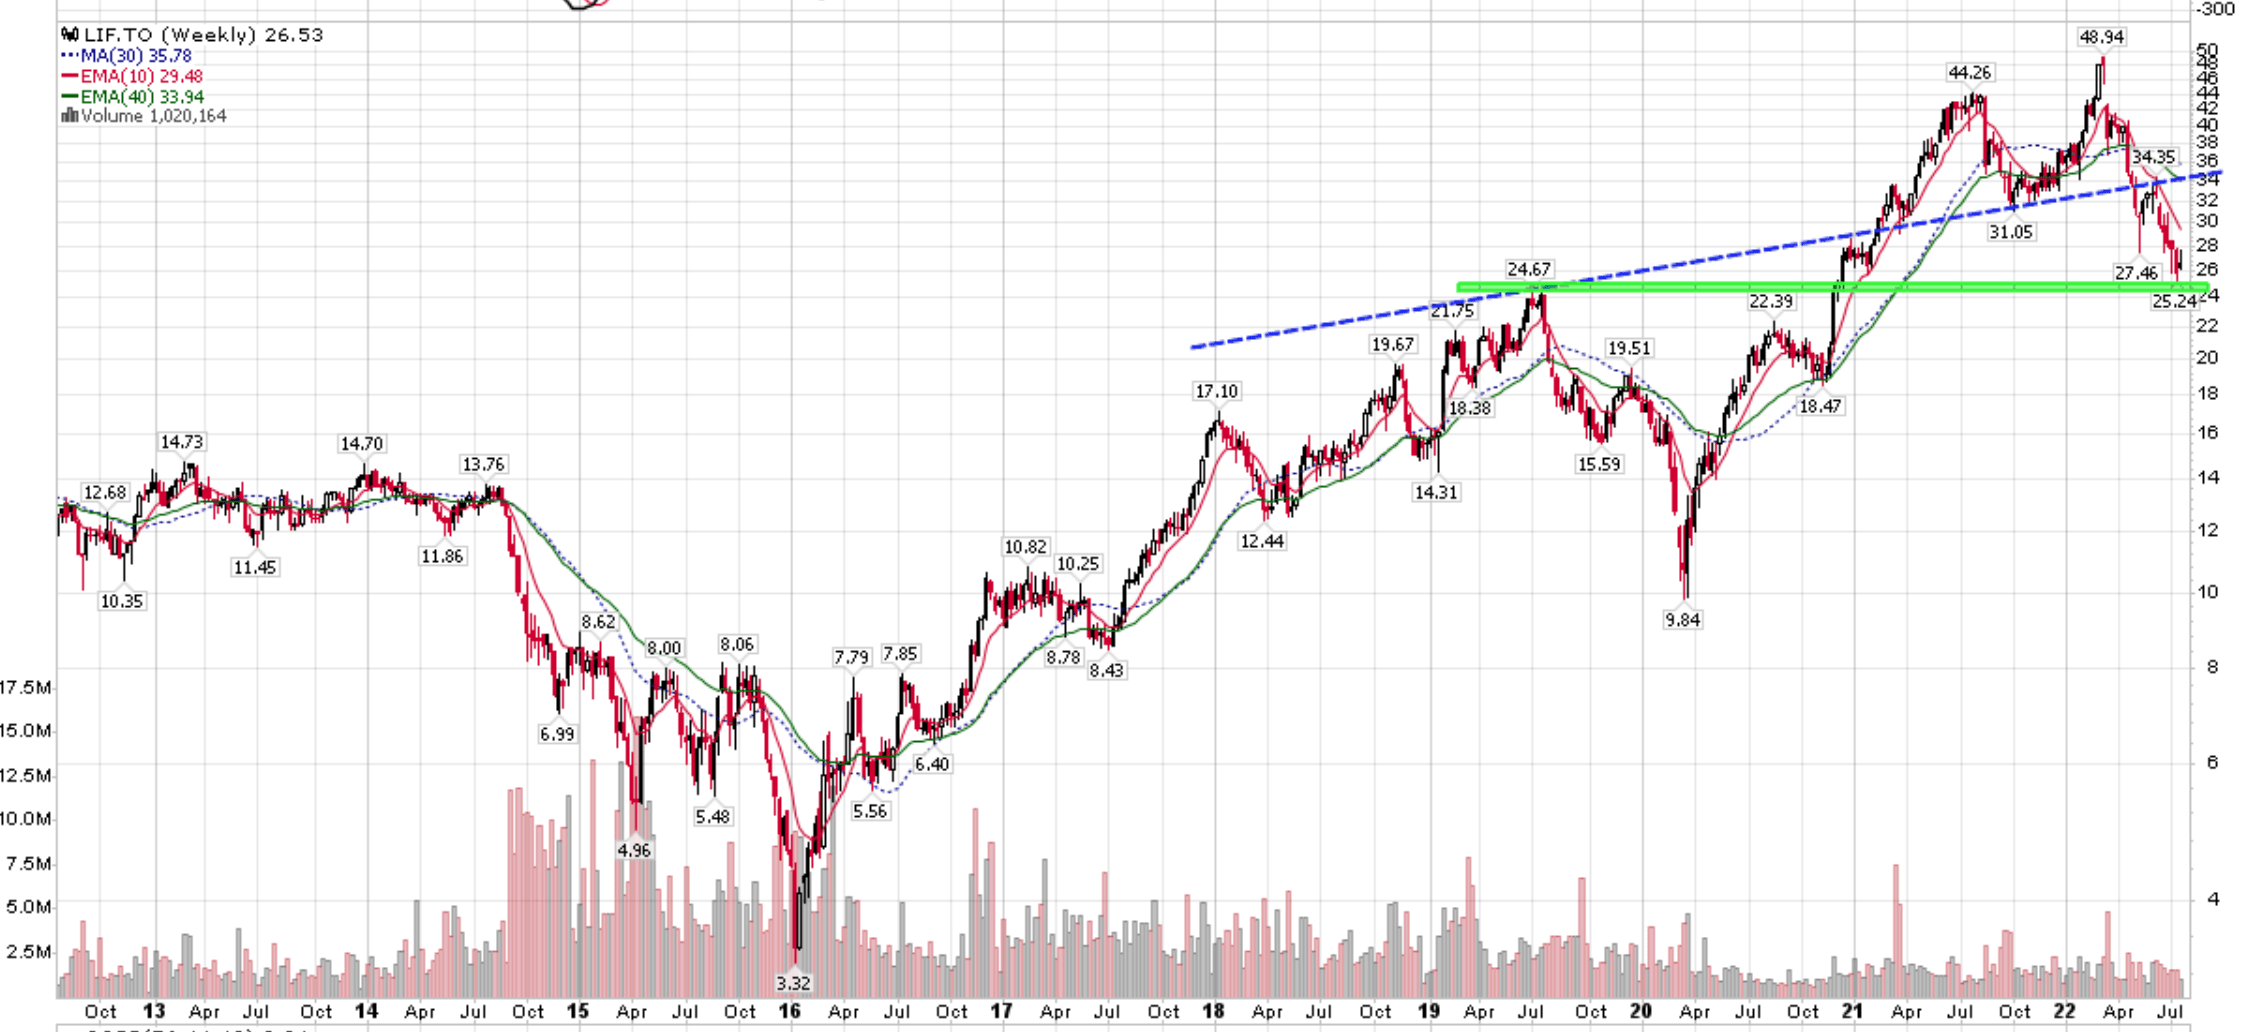
Conclusion
In conclusion, while Labrador Iron Ore Royalty Corporation’s current dividend yield of 10%+ may seem attractive to yield hungry investors, it is in the midst of a downward revision cycle driven by weaker economic growth and iron ore prices. I would recommend investors stay on the sidelines on LIORC, as dividend income may not offset the mark-to-market price loss.
Be the first to comment