

xavierarnau/E+ via Getty Images
iShares MSCI Saudi Arabia ETF (NYSEARCA:KSA) is an exchange-traded fund that provides investors with direct exposure to Saudi Arabian equities. The fund managed $982 million as of November 18, 2022, with an expense ratio of 0.74%, which is quite expensive. The fund seeks to track the performance of its chosen benchmark index, the MSCI Saudi Arabia IMI 25/50 Index.
Net fund flows into KSA have been modestly positive at about $41 million over the past year, although this includes roughly six months of positive flows, and the most recent six months seeing negative flows.
ETFDB.com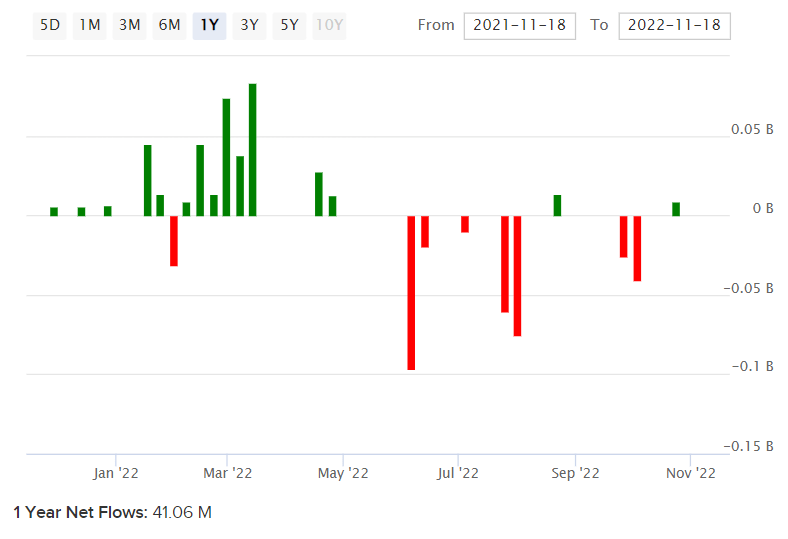
All considered, KSA’s performance has been strong this year, with a year-to-date price move of -3.82% at the time of writing, versus the S&P 500 U.S. equity index’s move of -17.62% (both on a price/level-only basis). Out-performance has been driven by Saudi Arabia’s large exposure to energy; energy prices have surged this year. Having said that, oil prices are now well off their highs set in the first half of this year (with some of the highest average crude prices in June 2022). It was in June 2022 that I last covered KSA with a bullish bias, driven by underlying earnings power and valuation.
The adverse move to energy prices since June earlier this year (see the price of U.S. crude prices below, for example) has sent positively correlated stocks downward. KSA is correlated positively to energy prices given Saudi Arabia’s exposure to oil markets.
TradingView.com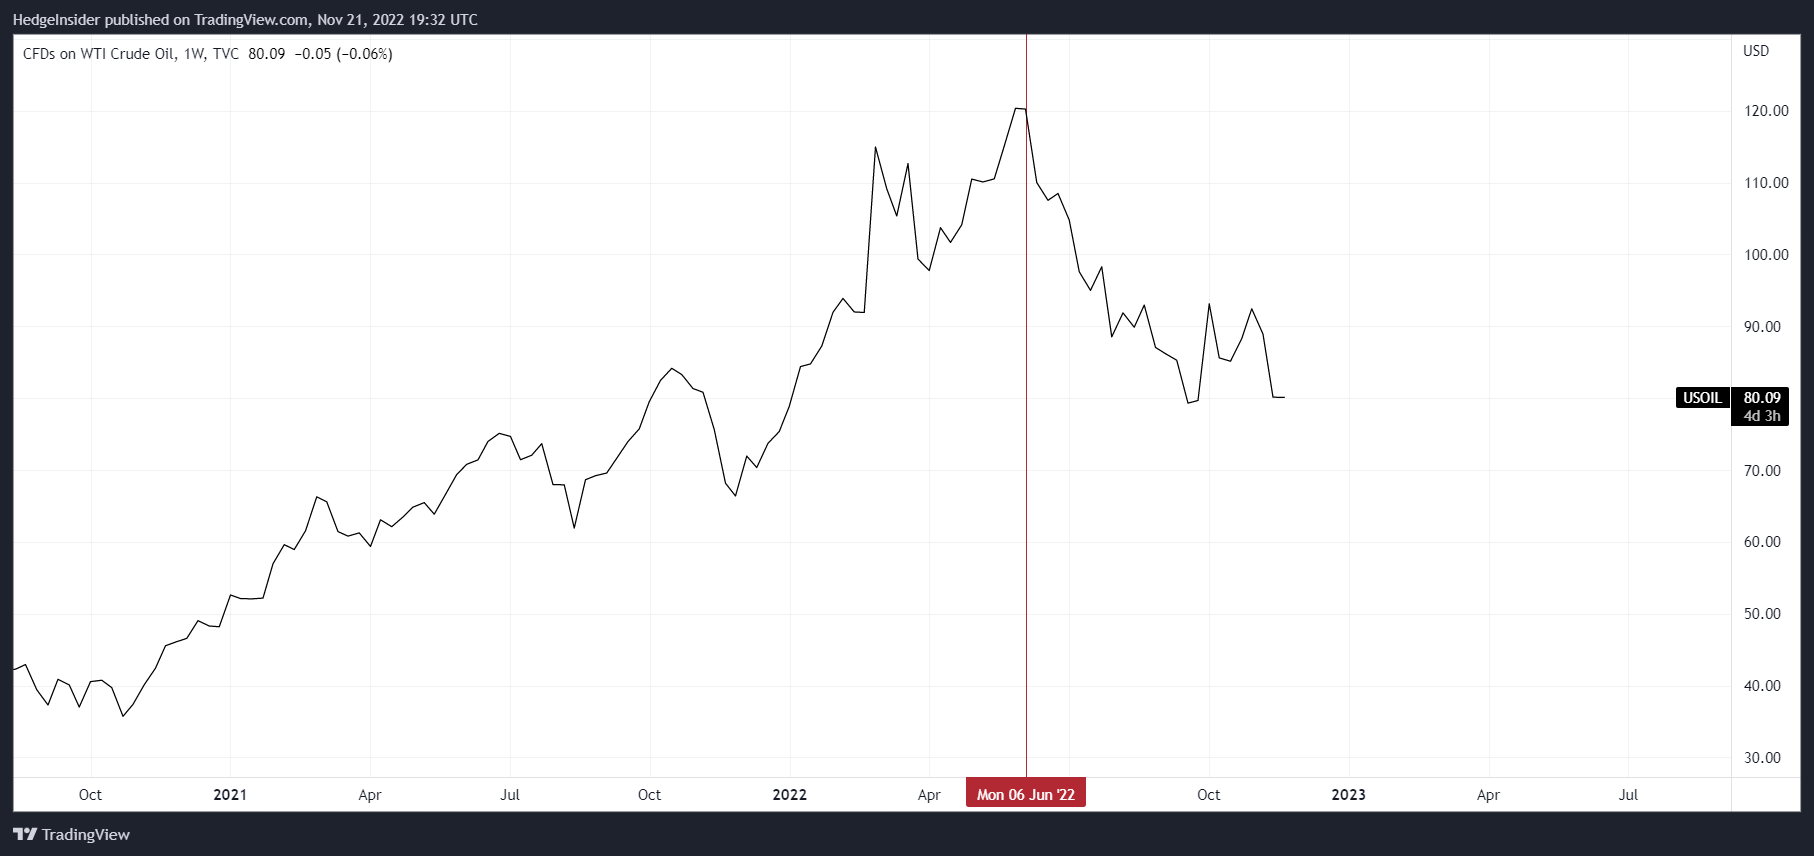
Oil represents about 80% of Saudi Arabia’s total exports. Saudi Arabia benefited from higher average energy prices in 2021 as well, helping to support the country’s current account that year. The chart below illustrates the country’s current account to GDP.
TradingEconomics.com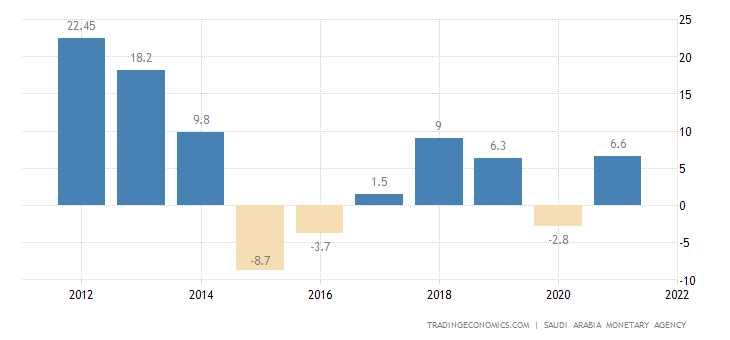
It is probable that the current account will improve further in 2022, judging by large current account surpluses in Q1 and Q2 2022. This would in theory support the local currency, the Saudi riyal, however the riyal is pegged to the U.S. dollar at circa 3.75 riyal to the dollar. Therefore, you could argue the riyal will remain undervalued. The “problem” is that given exports of oil are not likely to pick up simply because the riyal is fundamentally cheaper, KSA shareholders are unlikely to benefit to any significant degree.
The benefit on the other hand is that FX risk is low-to-minimal, and that one can base their assessment of KSA based on actual underlying earnings power. I will construct a basic model, but first it is worth understanding a fair cost of equity for investing in Saudi Arabia. The local 10-year yield is in the region of 4.85%. That is the “risk-free rate”. We can then add in an equity risk premium of 4.2-5.5%, and add an appropriate country risk premium; Professor Damodaran suggests 70 basis points. So, that would take our cost of equity to about 9.75-11.05%; we would want an IRR on par with this level.
Using the fund’s benchmark index’s most recent factsheet (as of October 31, 2022), I know that KSA’s likely trailing and forward price/earnings ratios are 17.89x and 15.02x, respectively. The portfolio’s price/book ratio was 2.43x per the same source, and the dividend yield was 2.54%. These figures imply a forward return on equity of 16.18%, and a dividend distribution rate of 45.44%.
Of course, as each successive business cycle rolls on, and as commodity prices fluctuate, it is likely that KSA’s underlying return on equity will smooth out over time. Morningstar’s consensus analyst estimate for three- to five-year earnings growth (for KSA’s portfolio) is currently 5.47%. Interestingly, after a forward one-year implied earnings growth rate of almost 20% (per MSCI data), KSA’s portfolio is therefore implicitly expected to not see any material earnings growth at all over the next few years. I am comfortable with using that assumption, especially for its simplicity, and also because the net multi-year (smoothed) result is a similar projection I have made for KSA in the past. The net result is a less favorable IRR, however, because of elevated risk-free rates and a lower earnings multiple.
Author’s Calculations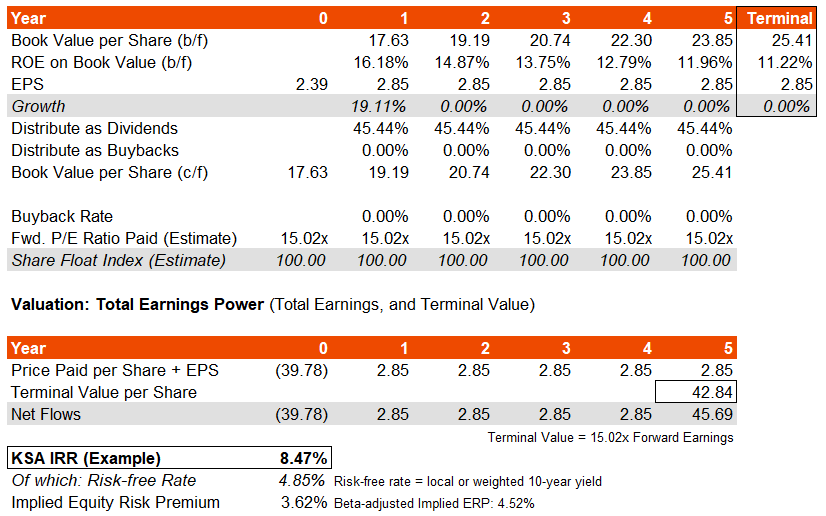
The IRR is calculated on the basis of the share price paid today for KSA shares, and taking into account the timing and extent of earnings over the next few years, plus an exit value in line with the prevailing earnings multiple of 15.02x (as of October 31, 2022).
KSA’s IRR might be in the region of 8.47%, with an implied equity risk premium of some 3.62%. This is low, and suggests over-valuation. However, I would have two points in response to this. Firstly, Saudi core inflation is a little over 2% in the long run (see chart below), in spite of cyclical volatility. Secondly, as a result of modest long-term inflation, the long-term risk-free rate is unlikely to be more than about 2-3%, as positive real interest rates (risk-free rates, less inflation) would be too restrictive to hold forever.
TradingEconomics.com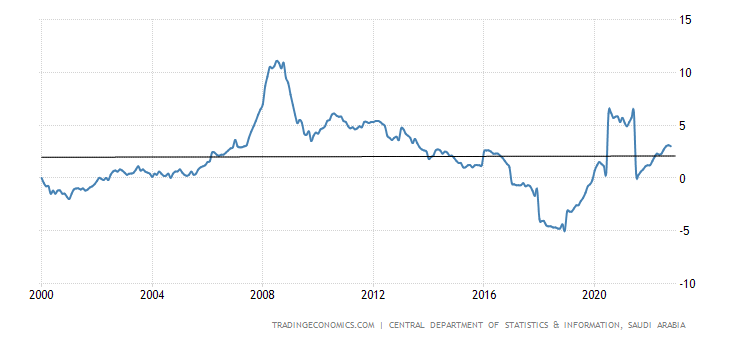
Therefore, one could argue that the long-term risk-free rate of 3% might be more acceptable and realistic. Additionally, a long-term equity risk premium of 4.20% plus a country risk premium of 0.70% seems achievable. That would give us a long-term cost of equity of as little as 7.9%. We could also subtract a long-term 2% core inflation rate, and 0% real earnings growth. The net-of-growth (in this, simply 2% long-term inflation) would provide us a real cost of equity of 5.9%. Inverting this would imply a forward earnings multiple of 16.95x. If I give KSA the benefit of the doubt that this is achieved by year 6 in my projection, the IRR improves to 10.65%, with a notional underlying equity risk premium of 7.65% (much higher). This still assumes 0% earnings growth after a year-one bounce.
Bear in mind that the global business cycle is currently contractionary, with most countries either in recession or approaching a recessionary phase (see chart below, as of Q4 2022).
Fidelity.com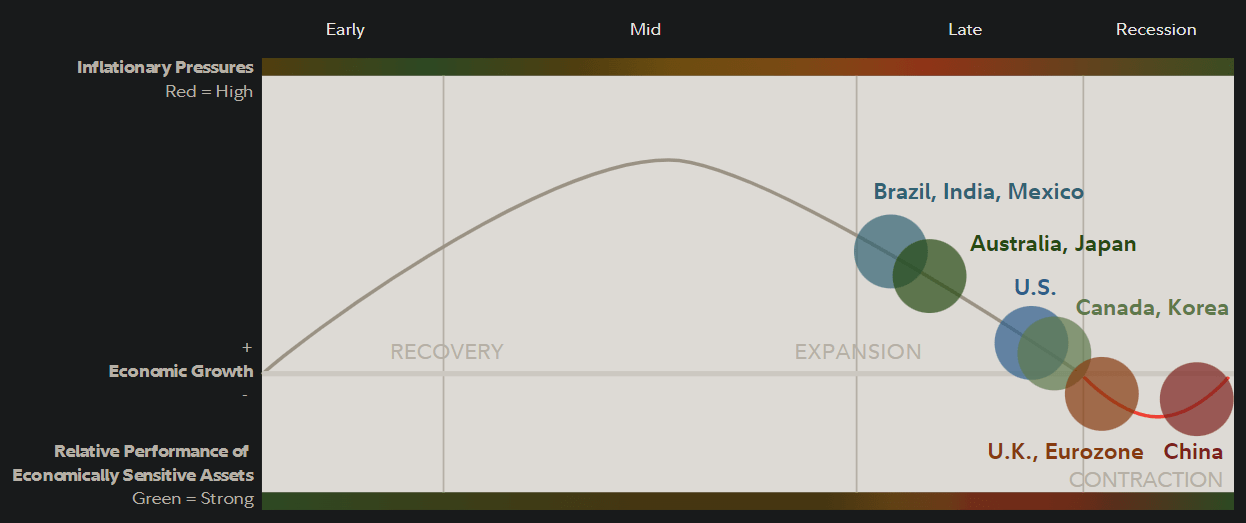
A pick-up in the real economy, perhaps late 2023 (or from 2024) could lend to stronger commodity prices (once again) or at least stable commodity prices but higher energy export volumes (driven by new demand into the next business cycle). This should ultimately be constructive for Saudi stocks, and may also help to drive the valuation higher (just as the earnings multiple for KSA seems to have contracted into the later/recessionary phases of the present cycle).
I would therefore hold my prior view intact, that KSA will likely perform reasonably well over the coming years. However, I am no longer as optimistic in the fund’s long-run trajectory. This is because I have some more abstract concerns with respect to the world’s long-term energy transition away from increasingly expensive and perhaps also geopolitically fraught energy sources. This could hurt the long-term valuation multiple of KSA, especially over a multi-year forward basis. The uncertainty is simply too great to make optimistic forecasts about potential earnings multiple expansion. I think that there are better opportunities elsewhere; opportunities with a similar (or better) implied IRR, and with lower risk.
Be the first to comment