

Petmal/iStock via Getty Images
Since the start of invasion in Ukraine, the price of European Union Allowance (EUA), which is traded on the largest carbon market globally, has fallen from the peak price of €96 to €55 within a week. Such dramatic price fall seems to be driven by several factors, including speculative trades with profit-taking by financial firms, companies cashing out on EUA to fund margin calls and provide liquidity for volatile energy commodities such as gas, and the prospect of Russian investors potentially leaving the EU carbon market.
Front-year EUA price (Bloomberg NEF)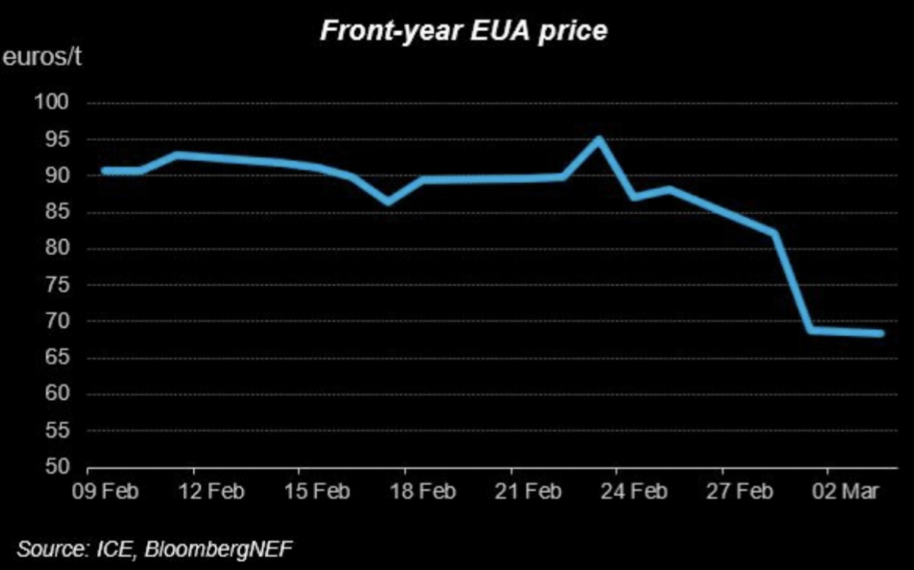
However, those factors are not driven by the fundamentals of carbon market, but rather around short-sighted negative sentiments. In fact, the fundamentals of EU carbon market are signaling a bullish case with short term factors such as the European energy crunch, and long-term ‘supply squeeze’ mechanism that is expected to be strengthen through the EU Fit for 55 package. Hence, the recent fall in KraneShares Global Carbon Strategy ETF (NYSEARCA:KRBN) poses a great buying opportunity to capture the potential upside due to changes in supply-demand dynamics. Investors who do not wish to speculate on commodity prices should also take into account of using KRBN as a hedge against their carbon-intensive holdings, as carbon price may start to become much more costly from here.
What is KRBN?
So what exactly is KRBN, and what does it have to do with the EU carbon market? In short, KRBN is one of the top ETF that is benchmarked to the IHS Markit’s Global Carbon index with the coverage of the most-traded cap-and-trade or mandatory carbon credit futures contract, including the European Union Allowance (EUA), California Carbon Allowance (CCA), UK Allowance (UKA) etc.
Carbon allowance futures breakdown (Statista)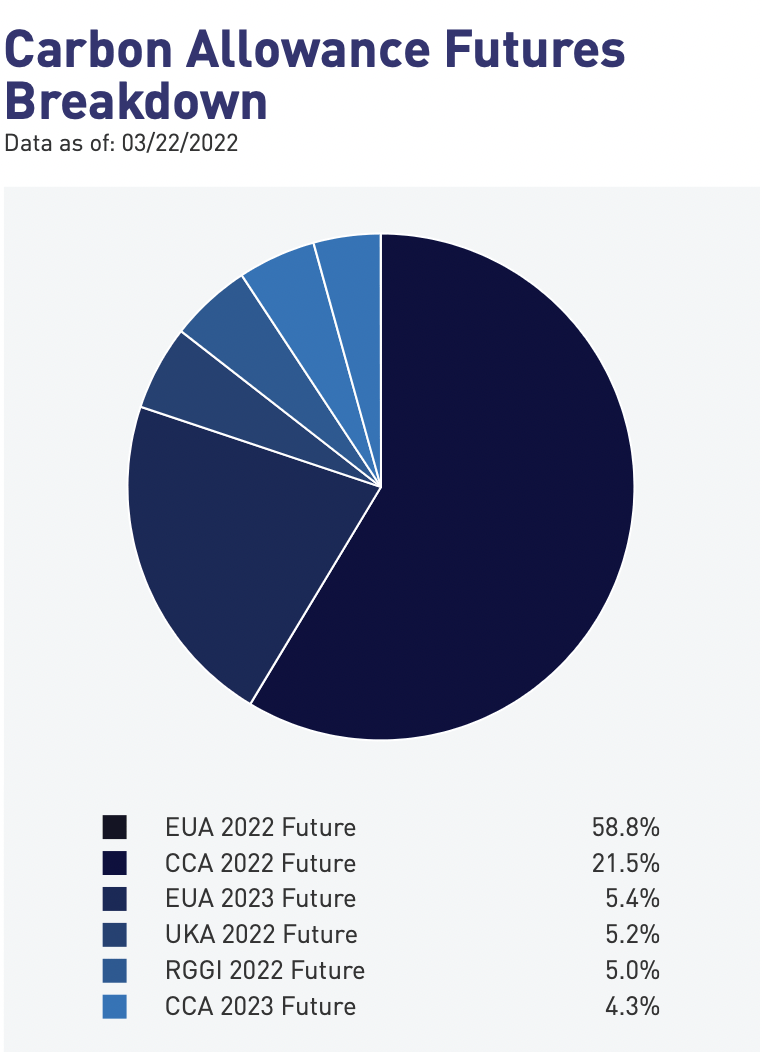
As the oldest and most established carbon market, the European Union Emissions Trading System ((EU ETS)) is also the most valuable major ETS in the world. This also explains the huge composition of EUA Futures (64.2% in total) within the KRBN carbon allowance futures holdings.
Total value of major ETS (Refinitiv )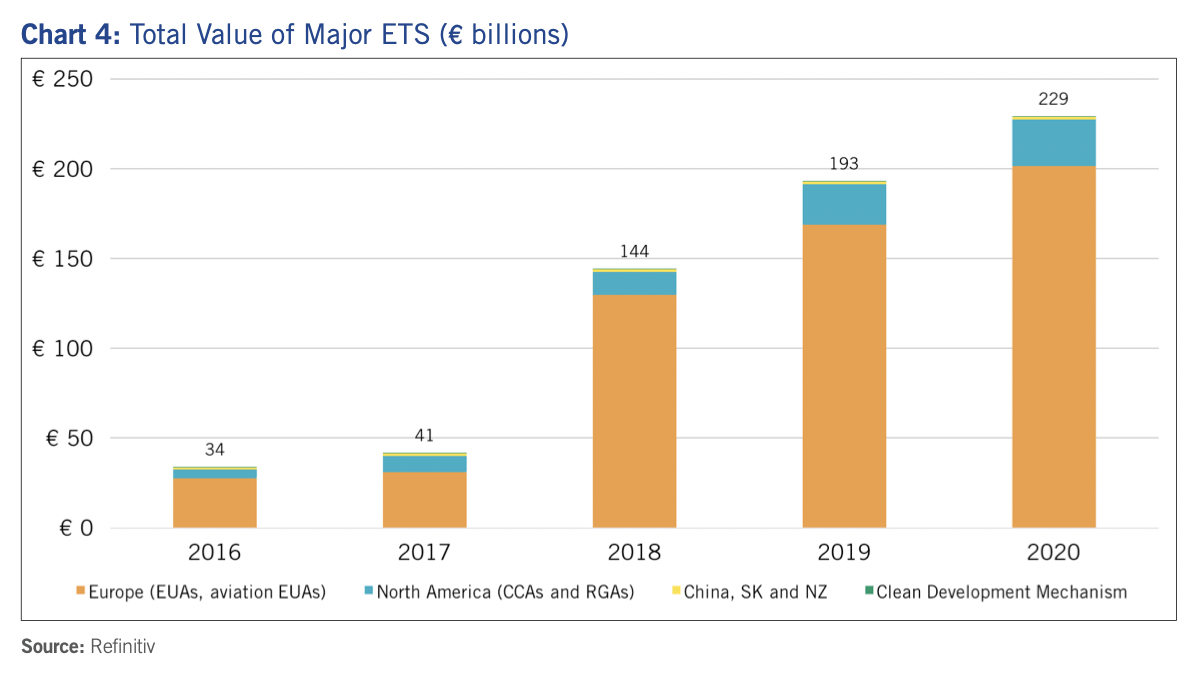
Throughout 2021, the EUA Futures performed the best as compared to its peers in terms of normalised returns, with KRBN mostly tracking its trajectory. Hence, we will focus on the EUA in the following analysis due to its dominant influence over the performance of KRBN. As the most advanced ETS, changes in the EU carbon market mechanism will also fundamentally affect other ETS.
Carbon allowances futures performance comparison (Bloomberg)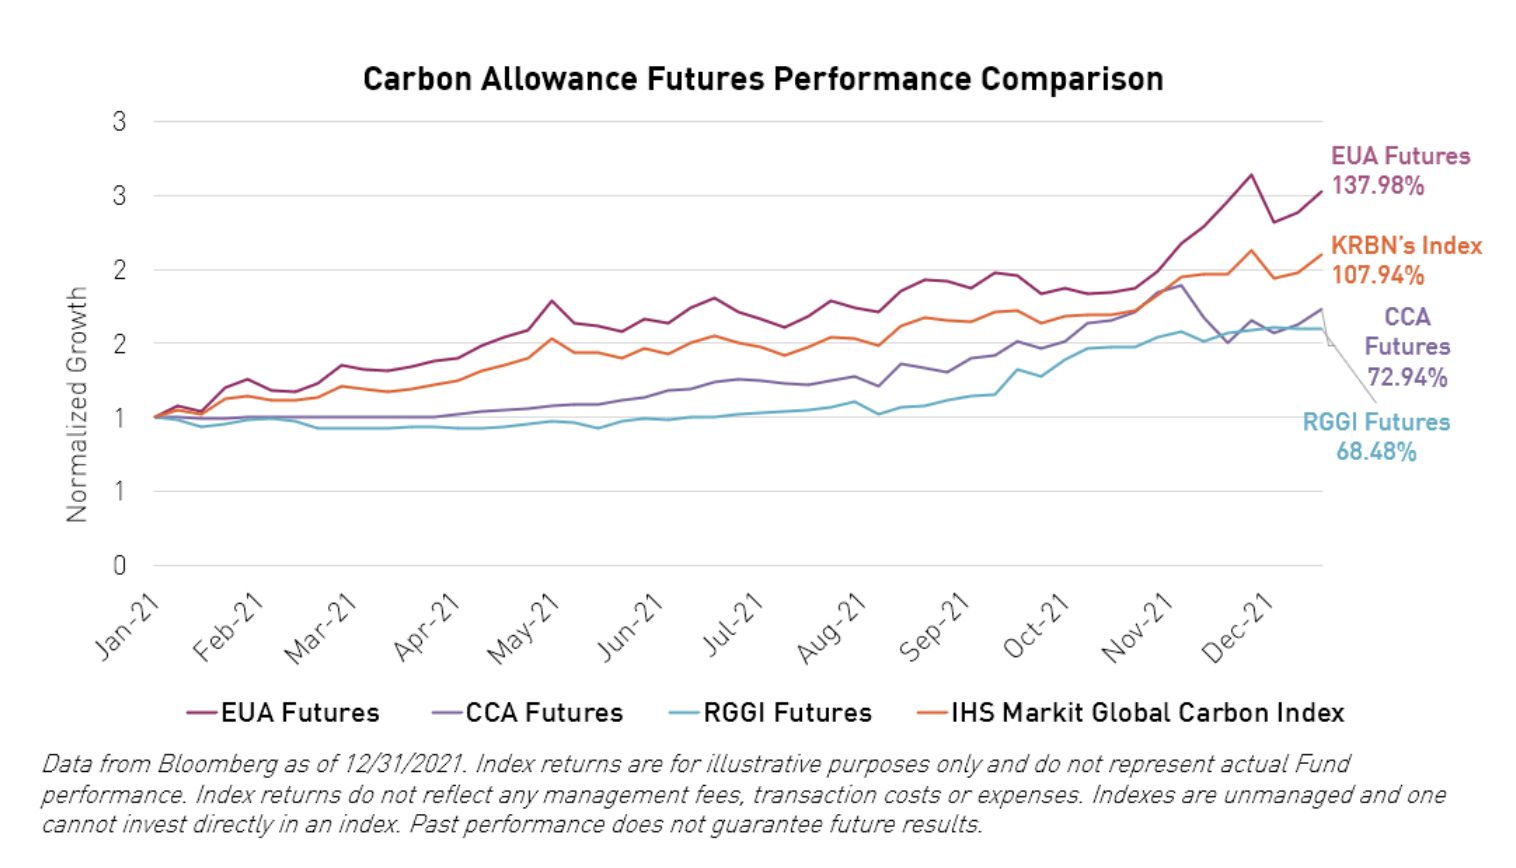
Besides, it is worth noting that the EU ETS account for around 41% of the EU’s total emissions, with the sectoral coverage of aviation, fuel combustion, stationary and industrial installations as of now. This would provide context to better comprehend the changes in market fundamentals that will be discussed later.
Emissions by sector (European Union)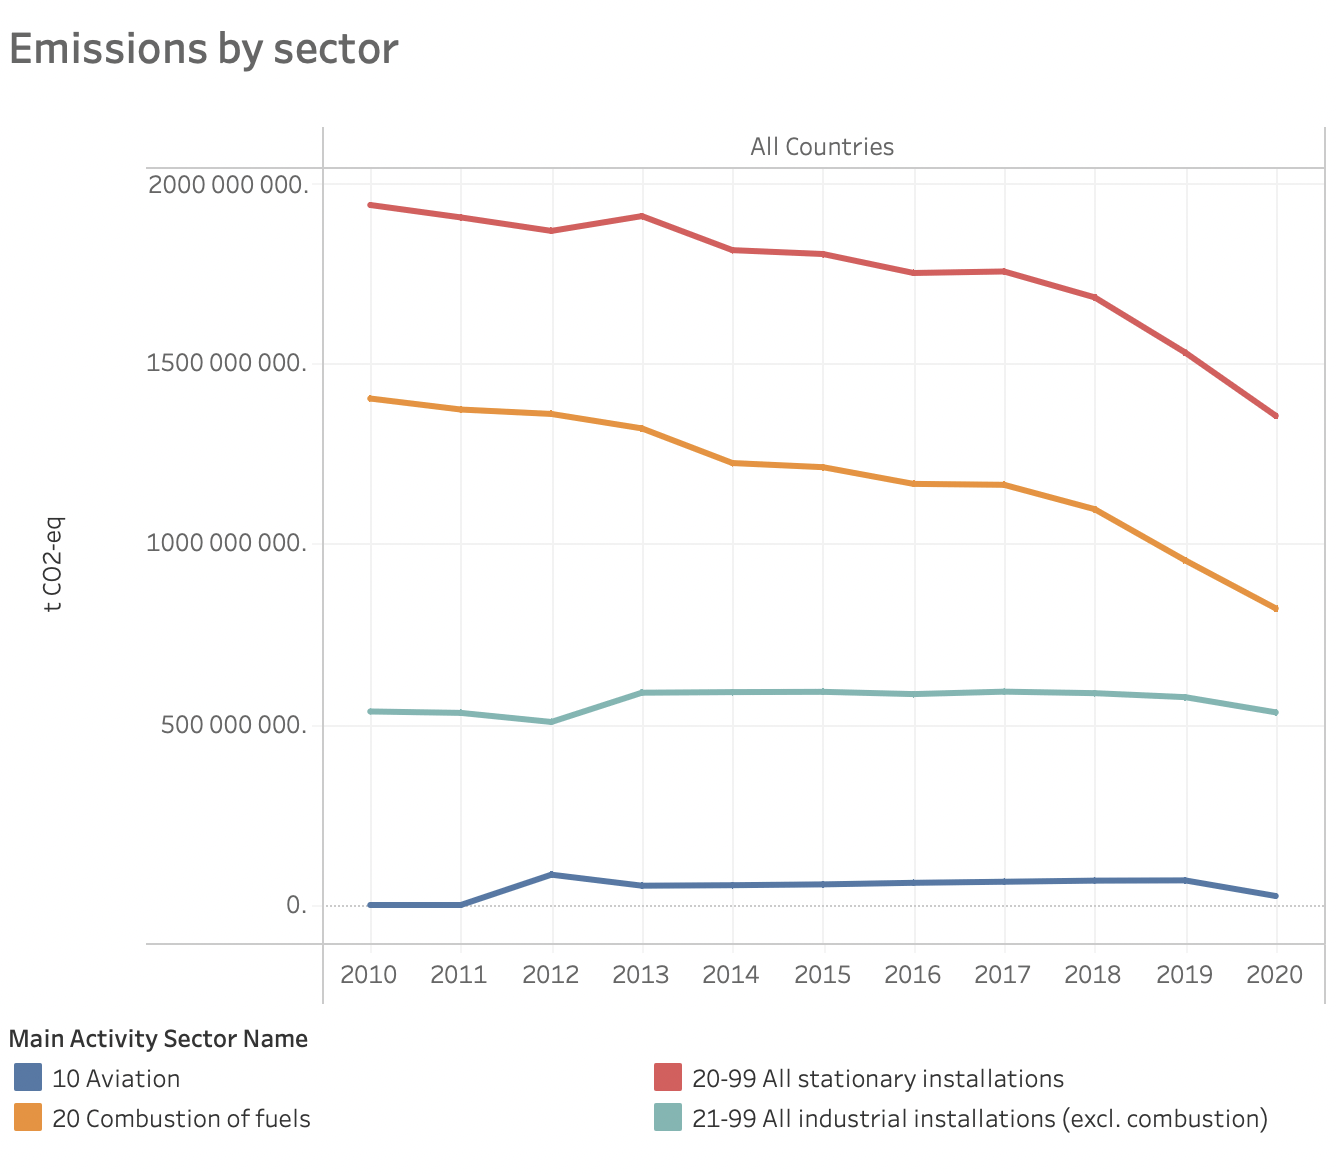
It’s all about supply & demand
The market fundamental of the carbon market is simply governed by the supply and demand just like many other commodities. Although it may be intuitive to perceive that carbon price should have significant relationship with oil or other green commodities, this does not seem to be the case. KRBN has negligible correlations with the futures of WTI Crude Oil (CL1), and that of green commodities such as copper (HG1), cobalt (LMCODY) and lithium (LNH2).
Correlation matrix (Author, Bloomberg)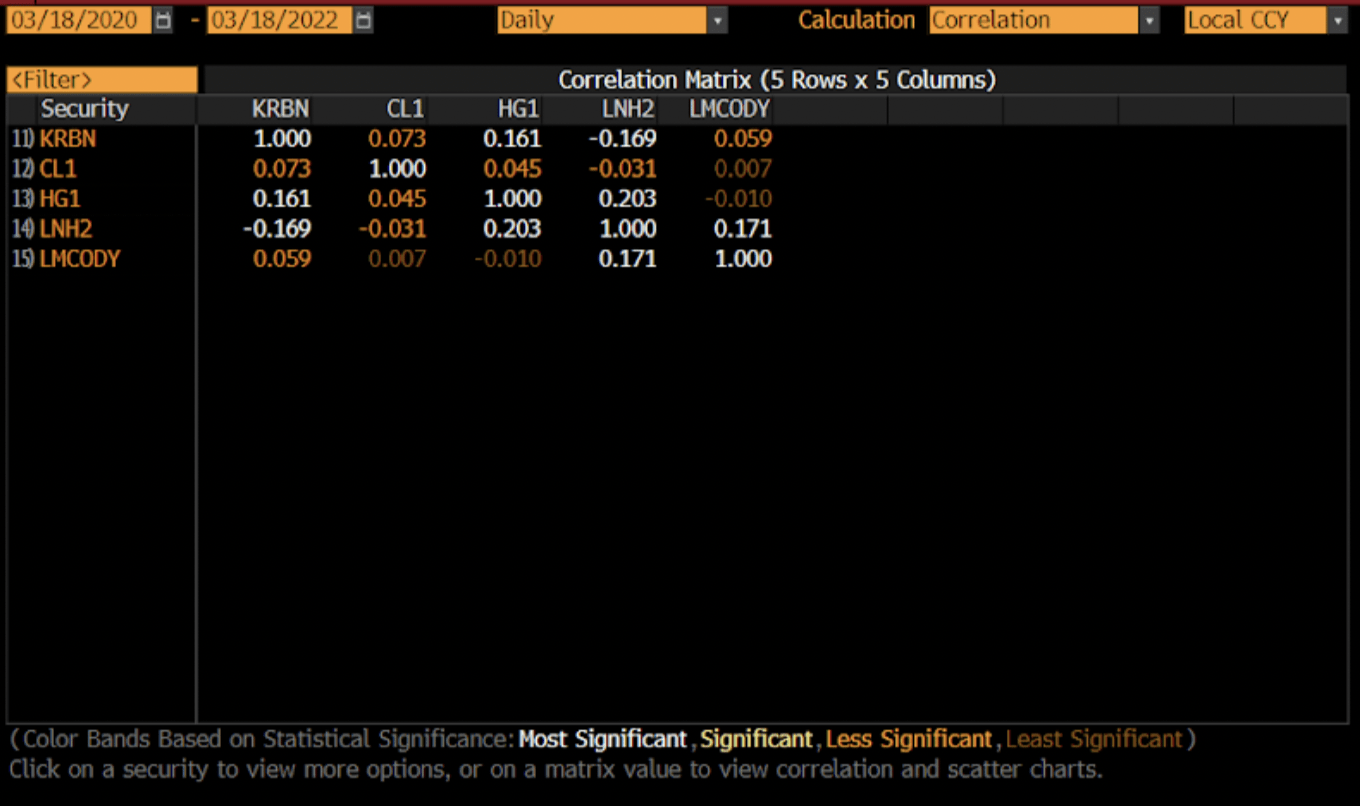
Hence, the EU ETS carbon price, which can be the proxy of KRBN price, can mainly be driven by the following supply-demand dynamics, with factors such as the linear reduction rate for carbon allowances, market stability reserve intake rate, carbon demand driven by verified activities and futures hedges.
EU ETS supply-demand dynamics (Author)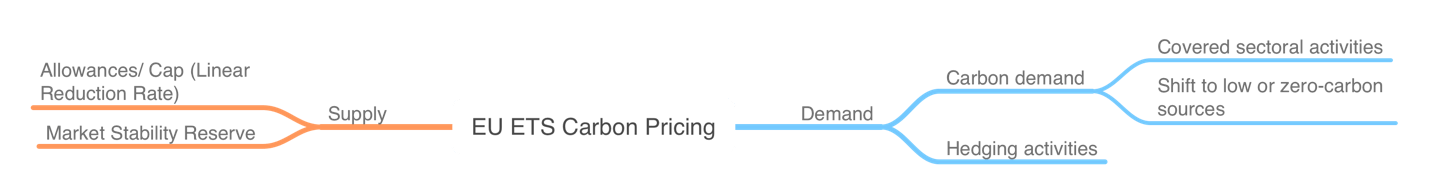
The recent introduction of EU Commission’s ‘Fit for 55’ package is expected to bring huge changes to the existing supply-demand dynamics, if the proposal goes through the voting stage in June 2022. So, what is the ‘Fit for 55’ package all about? It aims to guarantee that EU emission trading is aligned with its own goal of reducing greenhouse gas emissions in the region by 55% in 2030. In order to achieve such target, it has proposed to exert additional pressure to its supply mechanism by reducing the number of carbon allowances from a linear reduction rate of 2.2% to 4.2% and strengthen the market stability reserve with buffer intake at the injection rate of 24%. On the demand side, it targets to expand the existing sectoral scope to include maritime activities, introduce the Carbon Border Adjustment Mechanism (CBAM), and propose phaseout for free allocation in the selected sectors.
Timeline of EU ETS ‘Fit for 55’ (Bloomberg)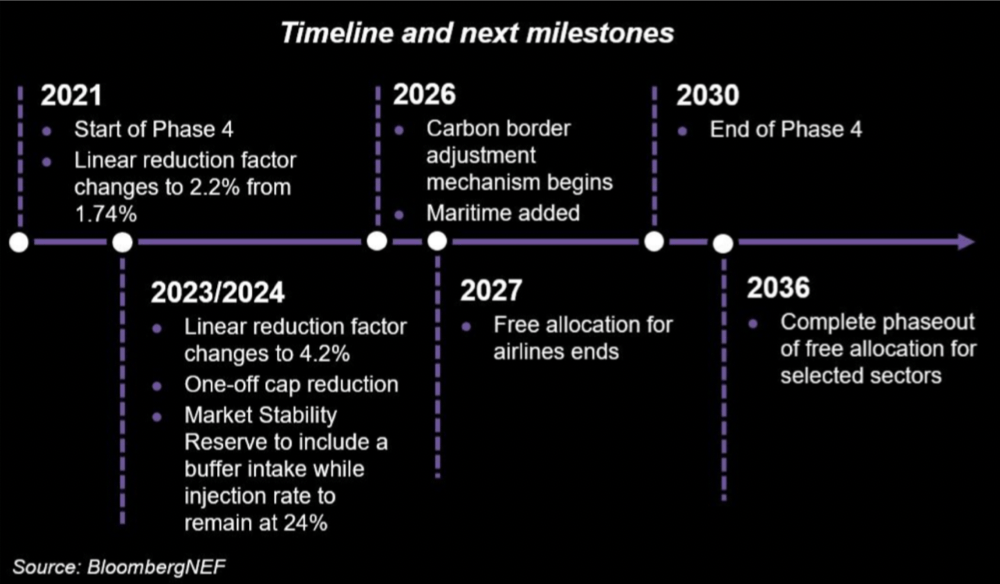
Long-term supply squeeze
Firstly, the aggressive linear reduction rate (LRR) of 4.2% to eliminate allowances by 2040 may be just too ambitious and leave a significant supply-demand gap that is challenging to be filled. According to the current EU ETS emission estimates, the ETS emission will largely deviate from the number of carbon allowances starting from year 2023 (with consideration of a one-time drop of 117 million carbon allowances at that year).
Hence, there is no way that the supply of carbon allowances is going to be sufficient over the next 20 years especially with the introduction of new LRR, unless the EU ETS emission declines at a greater rate that matches the carbon allowances linear reduction factor rate of 4.2%. Even without such change, the emission levels are expected to surpass the supply of allowances at the end of this decade. Therefore, this supply mechanism is undoubtedly presenting a long-term bullish case for KRBN.
EU ETS Emissions and Allowance Estimate (Author and European Union)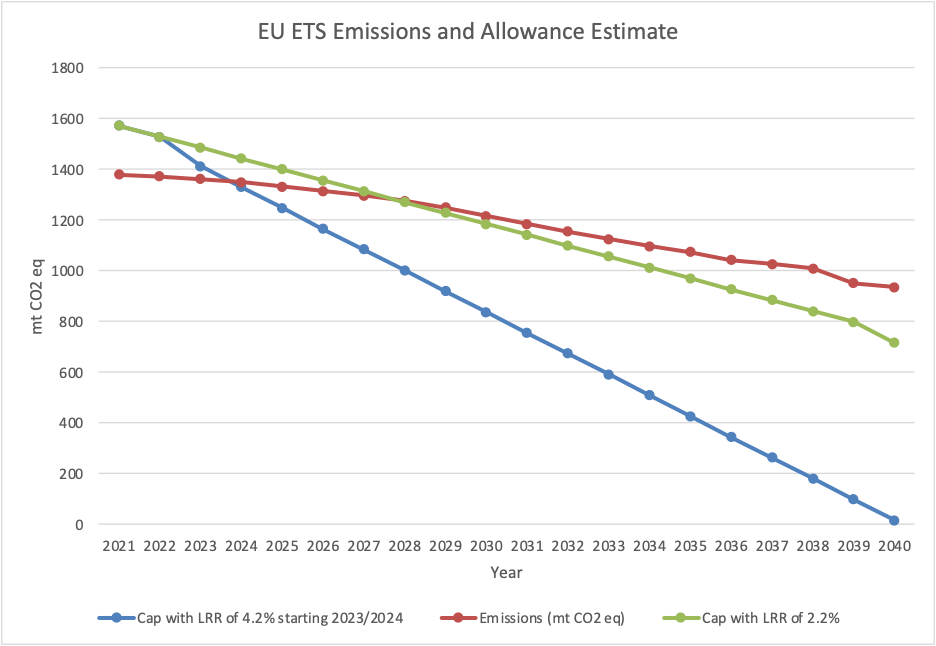
Besides, the EU parliament has voted to strengthen another aspect of the supply control mechanism known as the Market Stability Reserve (MSR) by extending its annual intake rate at 24% until at least 2030. The mechanism will be activated whenever the total number of allowances in circulation (TNAC) surpasses 833 million by withdrawing 24% of TNAC and injecting it into MSR. However, the allowances will be put back in circulation when TNAC drops below 400 million. The use of this mechanism ensures healthy supply-demand dynamics for the ETS, while acting like a ‘resistance line’ for KRBN as carbon price cannot drop drastically due to huge oversupply. This is another long-term bullish case for its KRBN that protects downside and keeps volatility in check.
Market Stability Reserve mechanism (Bloomberg)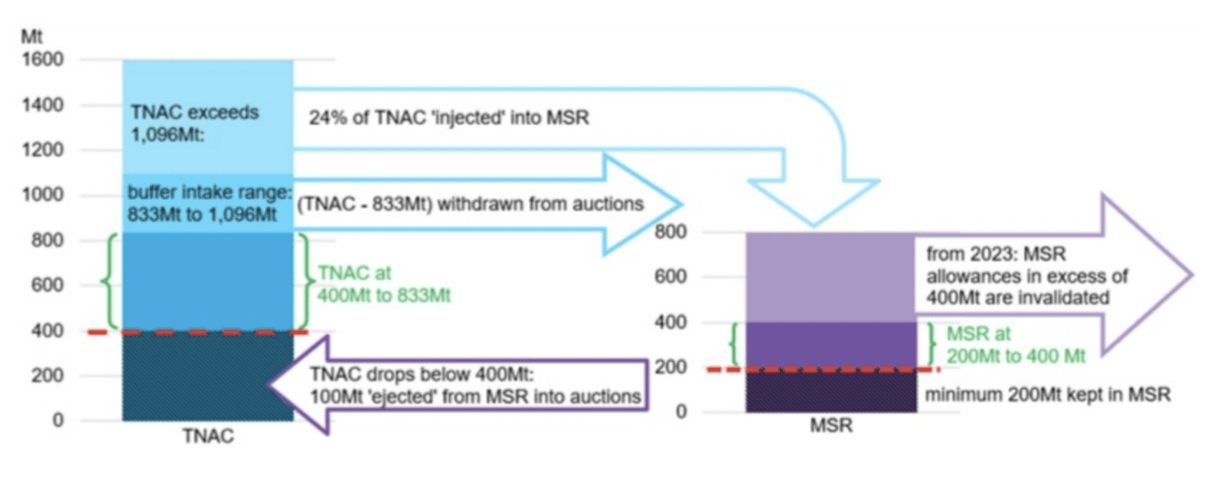
Possible short-term carbon intensity surge
Meanwhile, the EU ETS carbon demand may surge due to energy crunch triggered by the ongoing Ukraine war. European countries within the EU ETS such as Germany and Italy have heavy reliance on Russian gas. To improve energy security with efforts to divert from Russian energy sources, European countries are acting to import LNG from other sources and considering carbon-intensive moves such as reactivating coal power plants and other fossil fuel operations.
Russian gas dependency (Statista)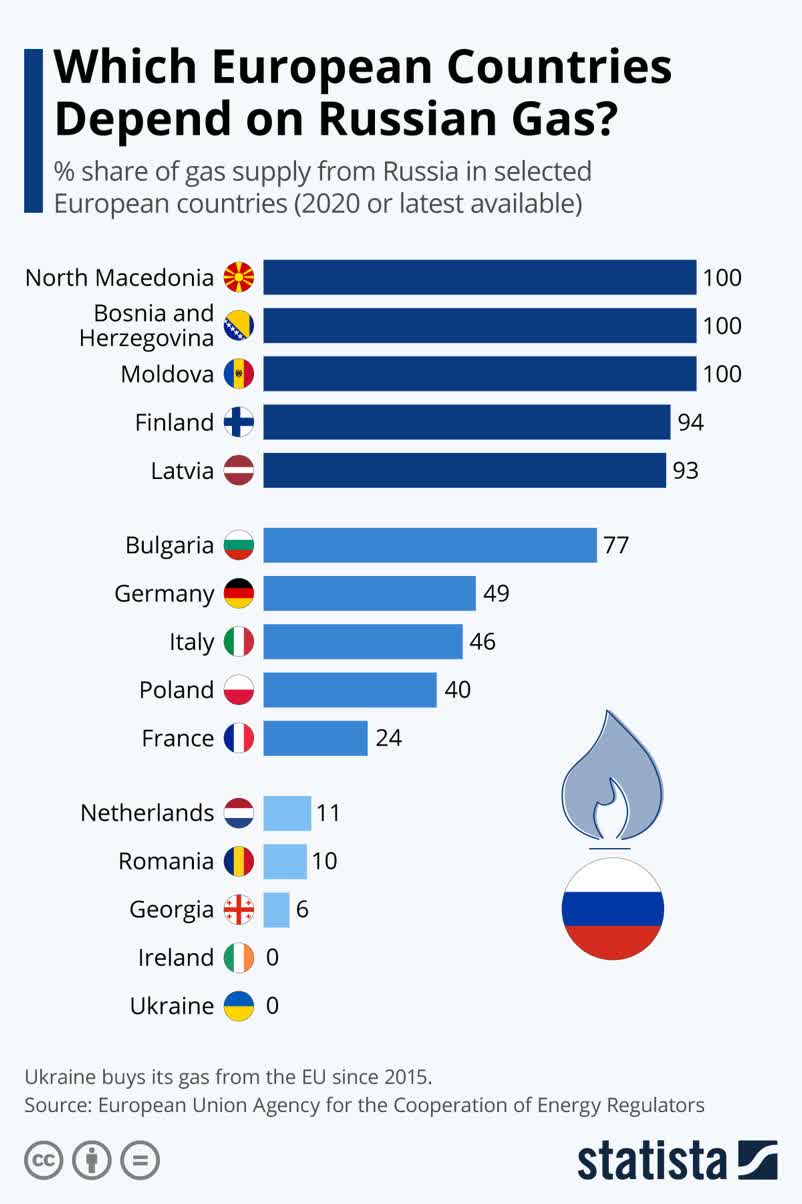
Since 2013, the number of freely allocated allowances for fuel combustion has already been reduced drastically, and it’s far lower than the verified emissions from such activity. The efforts to improve energy security will increase fuel combustion activities at least over the short-term, hence putting greater carbon pricing pressure if the number of allowances for such use is not increasing.
Fuel combustion emission and allowances (European Union)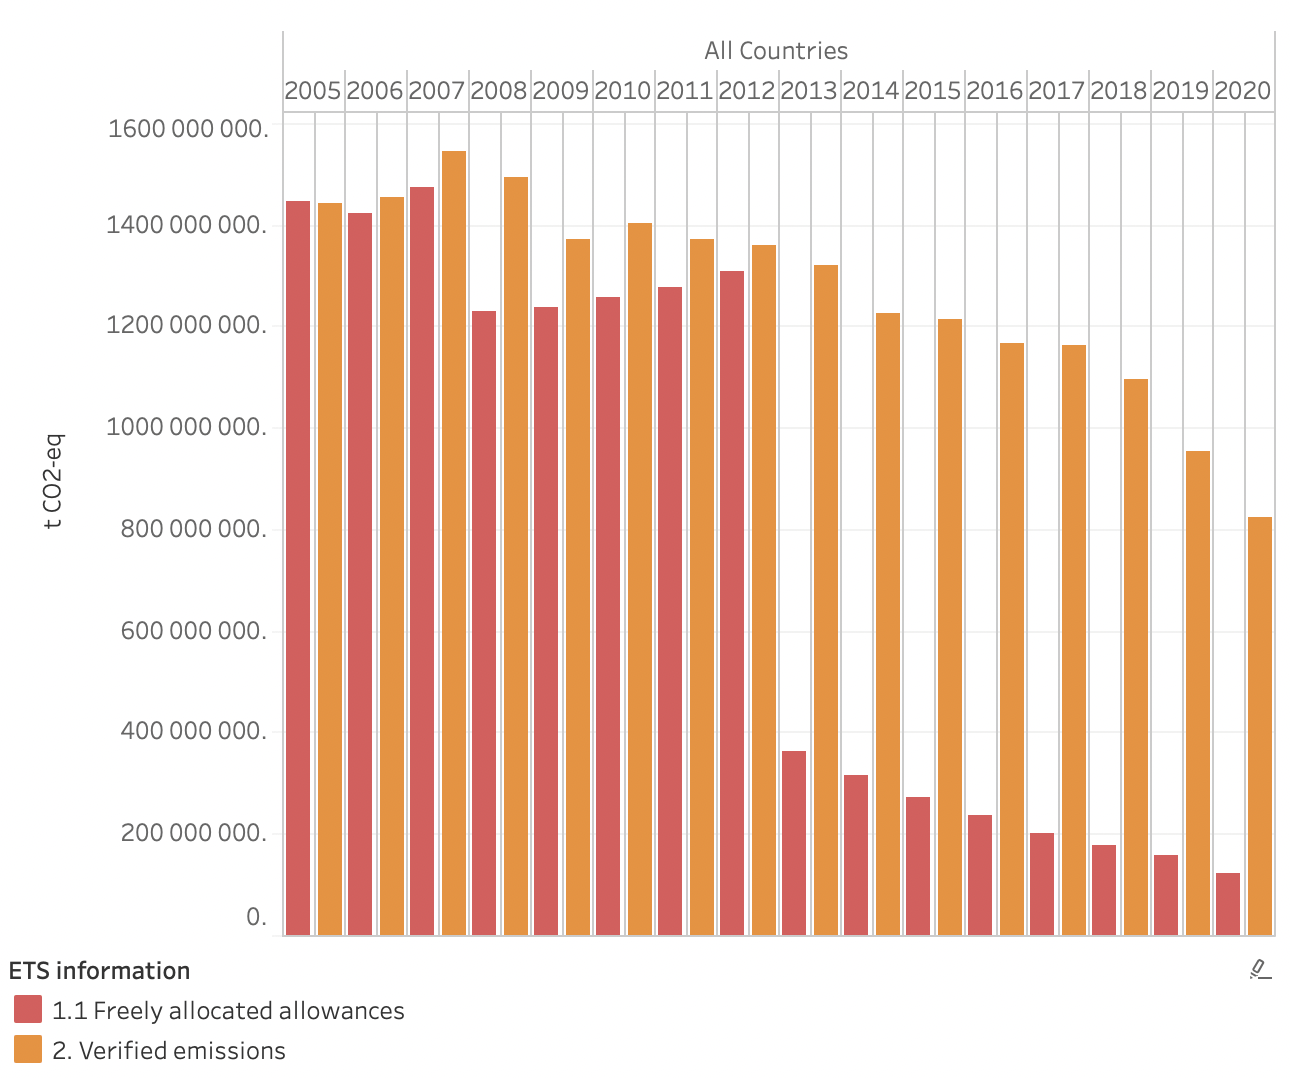
On the other hand, the growth of renewables has not been sufficient in the EU. From 2004 to 2020, the share of energy from renewable source only grows at 5.3% CAGR to 22.1%. With such rate, the share of renewables source will only reach 62% in the EU, which does not match its ambitious mechanism to get rid of carbon allowances by 2040, especially without the presence of nuclear energy. Under existing circumstance, the KRBN and carbon price in general will only go higher as there is no choice but to be more carbon-intensive to support EU’s energy need without sacrificing energy security.
EU renewable energy mix (Author, European Union)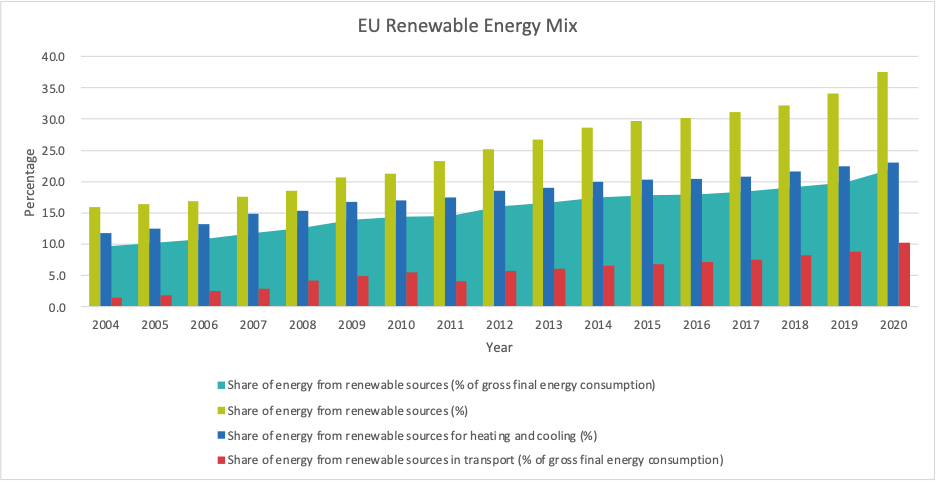
With the impact of COVID-19 easing throughout Europe, aviation activities are expected to rise back to pre-pandemic levels. At the end of 2021, the average number of flights within Europe has doubled from late 2020.
Traffic evolution across Europe 2019-2021 (Euro control)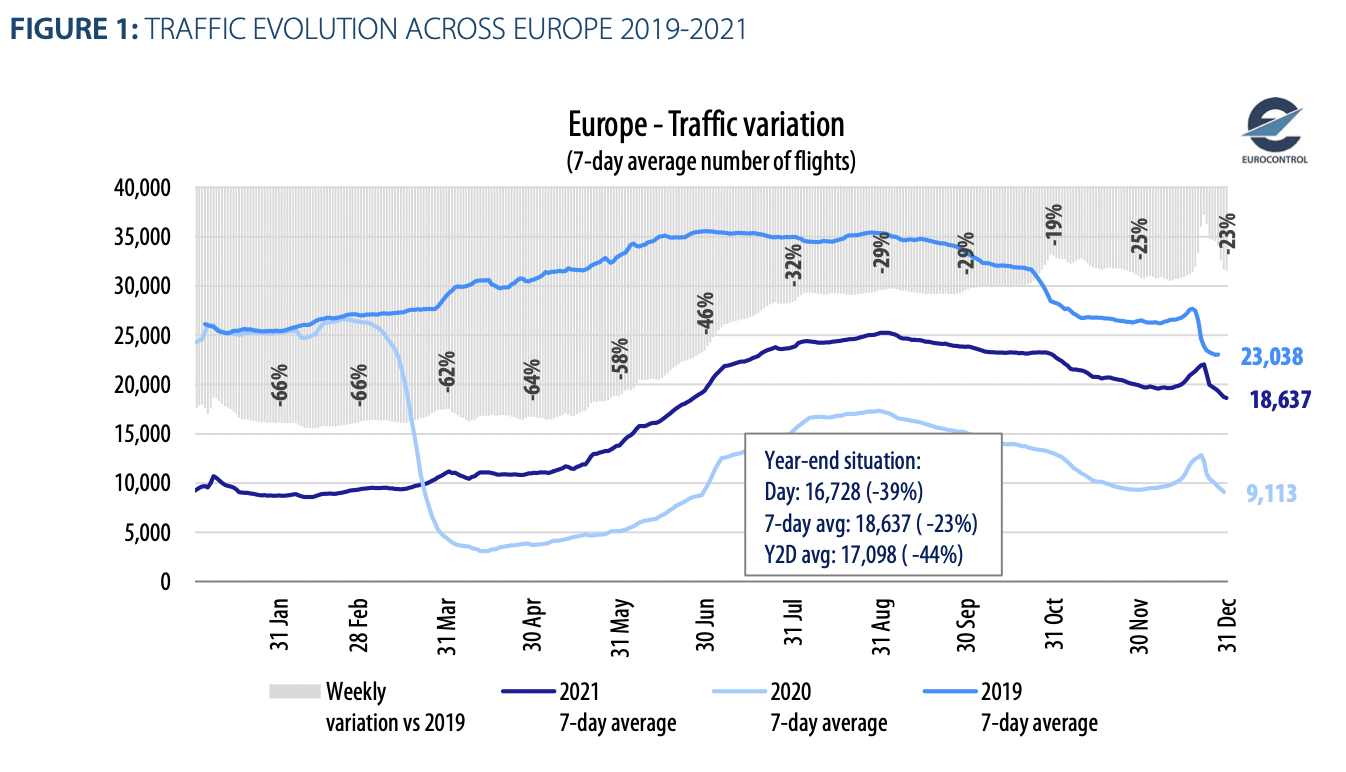
With the EU proposal to keep the total number of aviation allowance at current levels and then to reduce allowances annually under the new linear reduction factor, this will be another source of potential upside for KRBN when emissions rise and allowances remain and reduce from current levels.
Aviation emissions and allowances (European Union)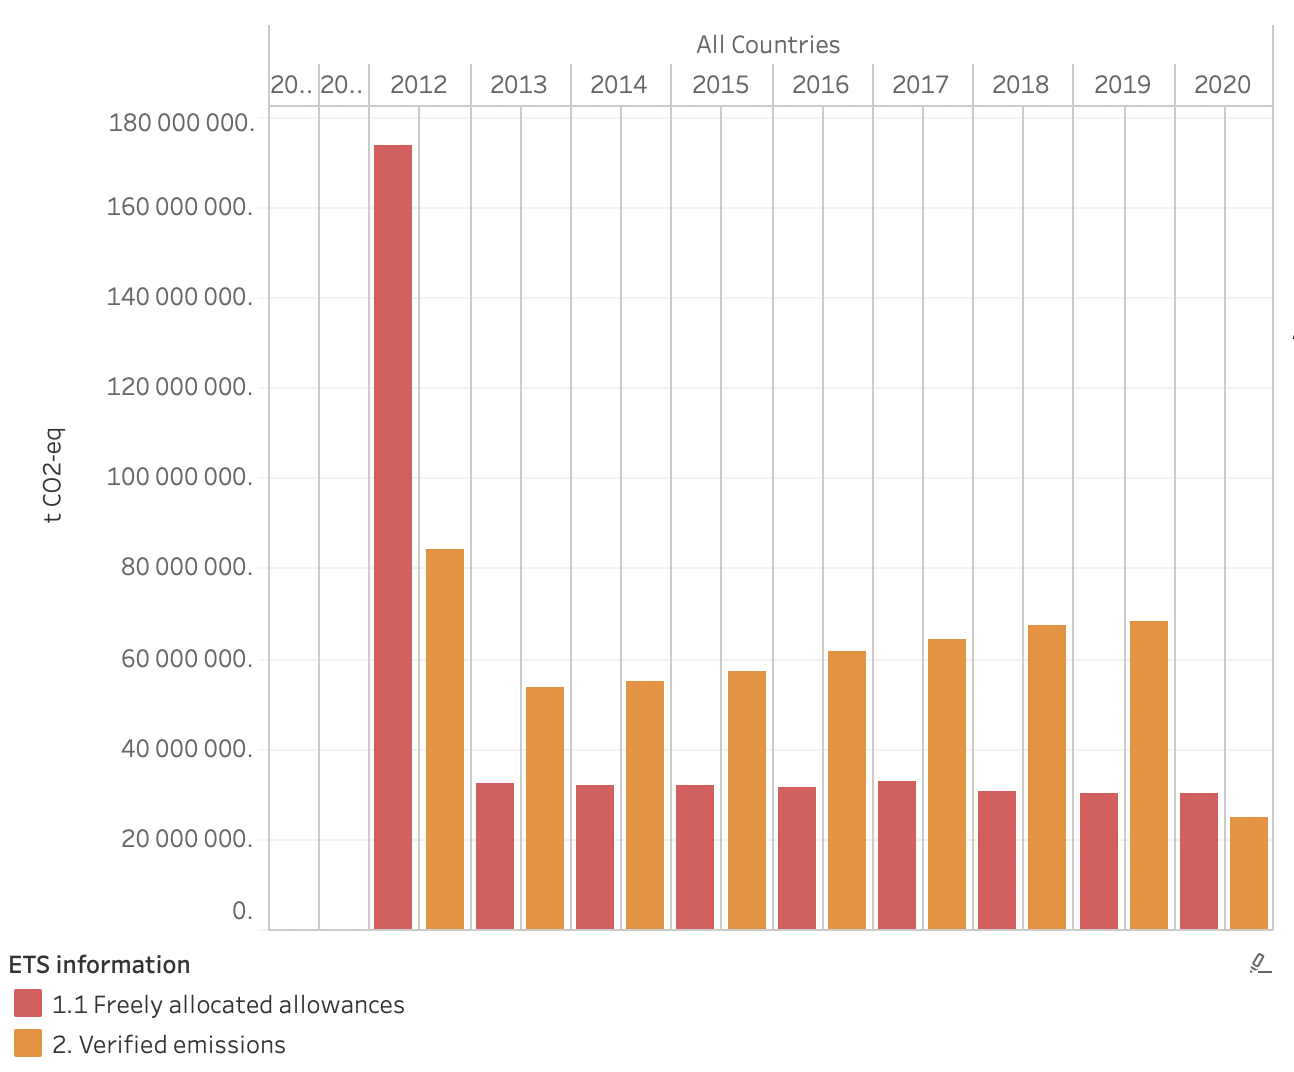
To watch: Scope Expansion
There are also two other important parts of the package, which is worth noting, which are the inclusion of maritime sector into the EU ETS and the introduction of CBAM. The inclusion of maritime sector is expected to cover CO2 emissions from all ships above 5000 gross tonnages. As the maritime sector contributes to 2.5% of the world’s total CO2 emissions, such proposal will bring significant increase in allowances’ demand.
Meanwhile, the introduction of Carbon Border Adjustment Mechanism (CBAM) will be even more impactful as it also aims to put a price on carbon from imports. This will especially increase the demand from the energy intensive industries in manufacturing and electricity generation which have been known to be the main source of carbon leakage. However, these changes will only be material around 2026, hence it is still early to make calls on their impacts on KRBN.
In short
From the supply-demand dynamics described above, it is an obvious bullish case for KRBN with limiting supply and expanding demand. However, there is no underlying ‘valuation’ for the commodity, and its price movement will undoubtedly be heavily influenced by the changes in rules within each ETS. Hence, this could be an interesting ‘buy’ for investors (or should I call speculators) with huge risk appetite, or else investors could learn from carbon price movements and underlying carbon market mechanism to identify and justify investment opportunities in relevant companies.
Be the first to comment