

MicroStockHub
Introduction
This will be my first article covering semiconductor equipment maker KLA Corp (NASDAQ:KLAC), after receiving some reader requests on my Micron (MU) and Advanced Micro Devices (AMD) articles to cover it. Both MU and AMD eventually got cheap enough for me to buy after I shared those buy prices, so I’m now long both of them. Semiconductor equipment stocks have held up a little better compared to their previous historical patterns, but I expect that if we have a recession in 2023, which I think is likely, we should expect stocks like Lam Research (LRCX) and KLAC to follow suit and follow other semiconductor industry stocks downward.
KLAC’s Historical Earnings Cyclicality
The first thing I check for every stock I analyze is to see what its historical earnings cyclicality looks like. The reason I do this is because I want to know if this is a stock that fits the profile of a stock I would consider investing in, and I also want to know which strategy and techniques are the most appropriate to analyze the stock in question.
FAST Graphs
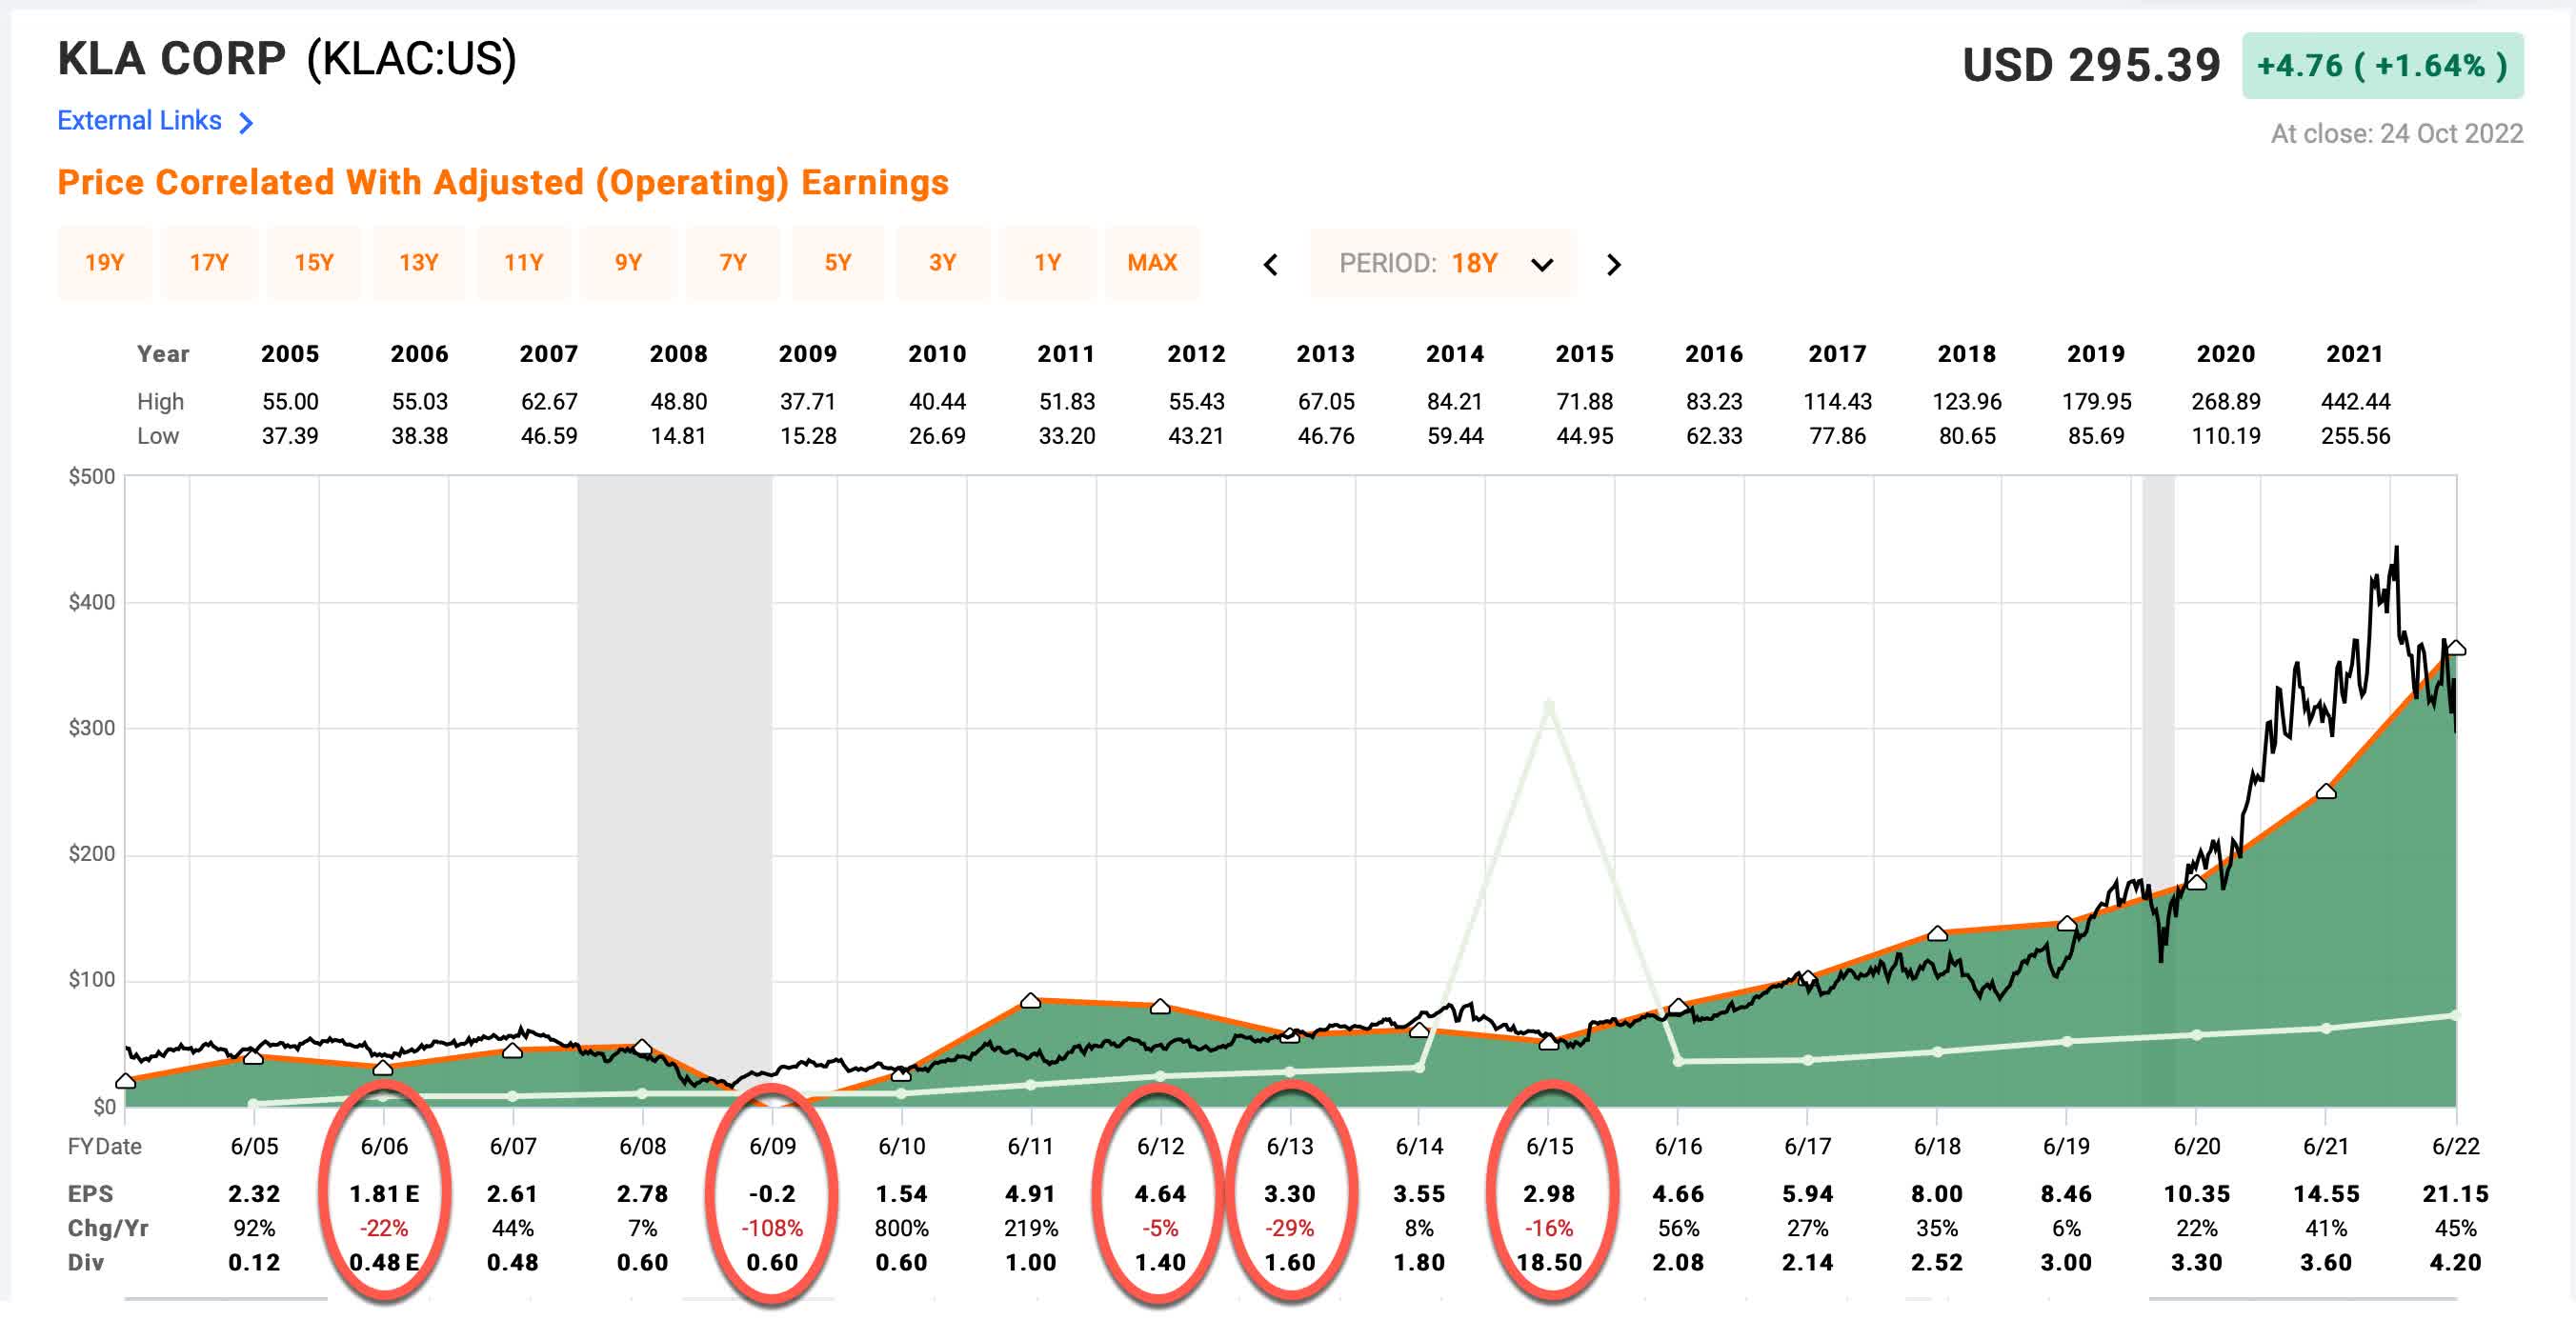
The main thing I’m looking for in the graph above is whether EPS has historically fallen more than -50% during downcycles. If it has, then I treat KLAC as a deeply cyclical business and use a special analysis that is designed for those types of businesses. KLAC has had five years since 2005 with negative EPS growth. Most of those declines I would describe as moderately cyclical, falling around -20% to -30% off their highs. However, during the 2009 recession, which was the last real recession we had in the US, EPS went fully negative, falling -108%. Both the stock price and earnings did, however, fully recover from that decline in a timely manner. This implies that KLA Corp is a deeply cyclical, yet high-quality business. These make for very good purchase targets during recessions when the downcycles are particularly deep.
Because KLAC is a very deep cyclical stock, using earnings is not a good way to value the stock. In fact, often when P/Es are low, it is the worst time to buy a stock like KLAC because that usually happens right after a peak, just before earnings collapse. For example, KLAC had a P/E of 15 in January 2008, which isn’t particularly expensive, but the stock went on to fall more than -60% over the next year or so. For that reason, when it comes to businesses with deeply cyclical earnings, I rely on historical price cyclicality to help guide me when it comes to the prices I am willing to buy. Also, because these stocks can be extremely volatile, each position I take is only weighted approximately 1% of my portfolio.
What I will examine in this article is at what price KLAC stock will be cheap enough to buy so that investors have a high probability of producing above-average returns over the medium term of 2-5 years.
KLAC Historical Price Cyclicality
Next, I’m going to examine KLAC’s historical price cyclicality in order to help guide a potential purchase price of the stock. While patterns don’t offer a perfect map to the future, they at least offer pretty good guideposts that have a high probability of producing good medium-term returns over the course of 2-5 years.
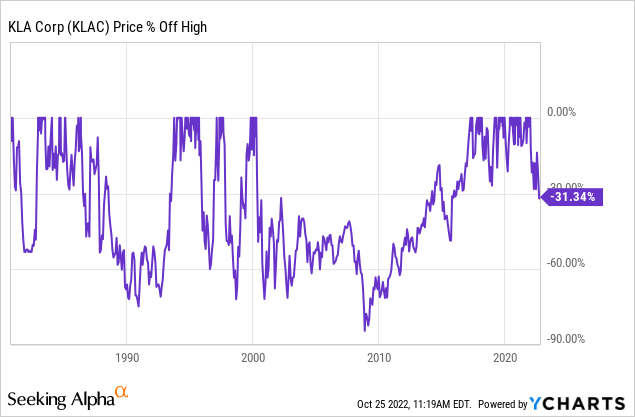
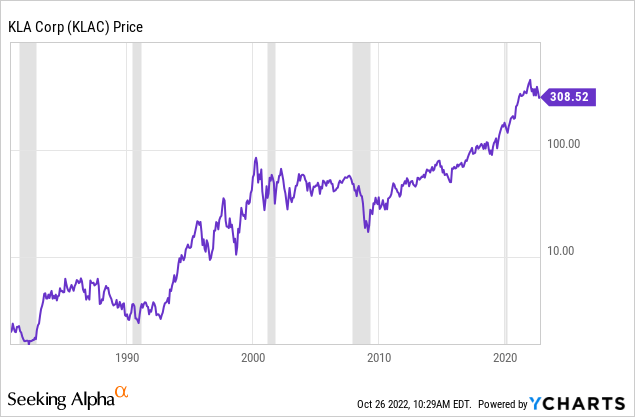
Above we can see that historically, the price has been very deeply cyclical, typically falling about -75% off its highs before recovering in a timely manner. The one exception from that pattern is the year 2000 bubble, which took about 16 years to recover from. Even though our recent upcycle was very big, I think that we are still in much more of a secular growth trend for the industry since 2015 or so, and the price wasn’t quite as crazy high in 2021 as it was in 2000, so I’m going to post another drawdown chart starting in 2003 so we can see the more recent post-2000-bubble drawdowns.
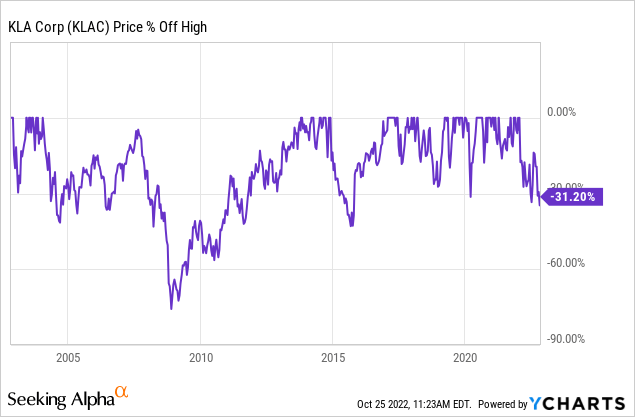
When we do this we see a similar -75% drawdown in 2009 that KLAC experienced during the vast majority of downcycles (other than the year 2000). And then we also have an example of the 2015 downcycle which occurred outside of a wider economic recession in which the stock price fell about -45% off its highs at the time. I think these two drawdowns should give a rough approximation of what to expect with the stock, depending on our view of the microenvironment in 2023.
My investing approach for deep cyclicals attempts to find historical patterns and then assume they will roughly repeat. However, I do check several things in order to see if there are obvious signs that this cycle really might be different this time and not repeat. I call these checks “impairment tests” and usually they take the form of questions. In the next section, I will run through this list of tests with KLAC stock.
Impairment Tests
Are revenues this cyclical peak higher than the last one?
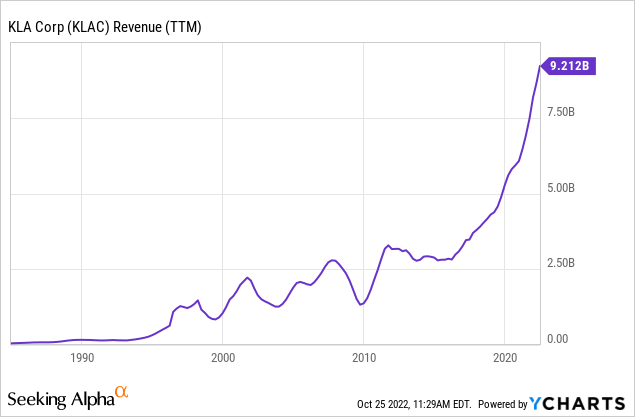
No matter how we slice it, revenues are much higher than any previous peak, so this looks very good.
Could the business have a hidden fatal flaw?
Since, by definition, the fatal flaw in the business model is “hidden” and cannot be easily seen, my test for this is whether the cyclical business in question has experienced two full business cycles because, typically, recessions are where the flaws are exposed, and sometimes businesses can get lucky and avoid trouble in one recession but have the flaw eventually catch up to them during the next. KLAC has found a way to survive for a very long time even when the business was fundamentally weaker, so I’m not really concerned about this.
Is there a clear and disruptive threat to its core business?
If there is, it isn’t showing up yet in the numbers I typically watch, or the activity I watch like M&A that would imply there is a clear and imminent threat to the business. One might think US/China relations could be a threat, but I think there are too many unknowns to make the threat “clear” or to quantify it well.
Has KLAC stock experienced a recent super-cycle?
Generally speaking, I think the wider market could certainly have experienced a 2000-like super-cyclical peak at the end of 2021. This can cause a problem for a strategy like mine that measures declines from peak prices because if the peak prices are ridiculously high, then a stock might fall -70% or more off its highs and still not exactly be a good value.
I don’t have a clear way to identify super-cycles. It’s kind of an “I’ll know it when I see it” sort of thing. But my quick way to check is to look at a log-scale version of a long-term historical price chart. Super-cycles tend to show up pretty well on these charts without giving as many false positives as a normal long-term price chart might.
If we compare KLAC’s log-chart of the past three years to the period 1998-2000 (which we know was a bubble), I don’t think what we have experienced recently is on par with the year 2000 bubble, however, I do think we have experienced a very big upcycle, which usually implies a bigger than normal downcycle. Historically, almost all of KLAC’s recession downcycles have produced drawdowns around -75% off the peak, but the difference with the 2000 bubble is that the recovery took much longer. Because I don’t think we are coming off as big of a bubble this time around, I think the expected recovery period will be about five years on my base case, with a worst-case more like 10 years. As long as investors buy the stock cheap enough, it could still make a good investment even after coming off a very big cycle.
Is management corrupt or incompetent?
Management seems fine to me.
How is the company’s debt-to-equity compared to previous cycles?
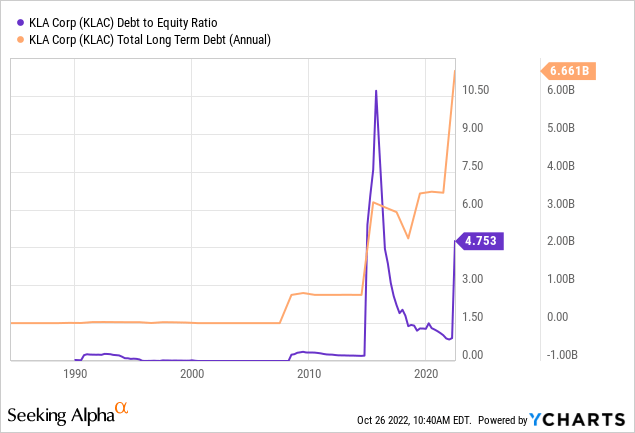
When I started writing this article, I actually hadn’t examined KLAC’s debt levels, and I am a little surprised by what I found. The reason I check debt-to-equity is because underpinning my strategy is the assumption that downcycles will be roughly similar to those of the past. Basically, I’m betting that history will repeat itself. If a company has similar debt ratios as they have had historically, or if debt-to-equity is less than 1.0, I don’t let debt concern me too much. But if debt levels are significantly higher than they have been historically, or debt-to-equity is significantly higher than 1.0, then debt can become a drag on potential stock price recovery. At current levels, I would not buy KLAC stock. However, they have shown in the past that they can pay down debt and decrease their debt to equity pretty quickly as they did in 2017 and 2018. So I will continue to monitor this and see where it stands if the price ever falls to the levels I would like to see. As it stands now, I would avoid the stock even if I got my price.
Has the price dropped enough to produce alpha in the past?
There are two different types of drawdowns KLAC has experienced in the past, the type that occurs during recessions and bear markets when the price drops -75% off its high, and those that fall more like -45% off its high that does not occur during significant recessions. My macro view is that the US goes into a recession in early 2023, so I think KLAC stock can potentially fall -75% off its highs. As long as my impairment tests check out okay at the time, I would be willing to add a 1% weighted portfolio if the stock trades -70% off its high. Currently, the stock is only -30% off its high, so it would have to fall a lot more to attract me as a buyer, but I will backtest how it would have performed if a person bought after a -70% drawdown during the 2008/9 recession and held until the stock price recovered its old highs in order to see what our returns would have been.
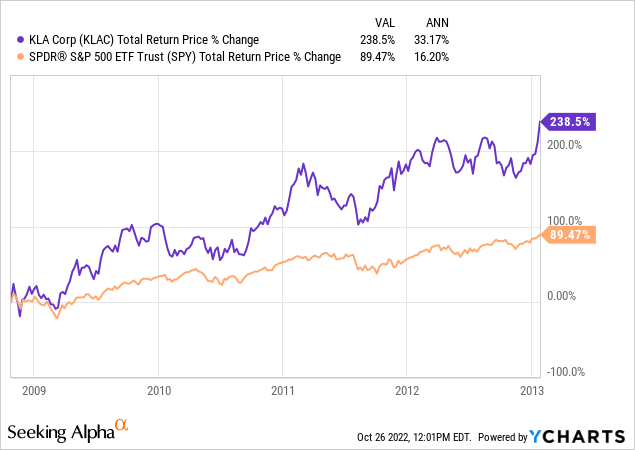
KLAC would have triggered a “Buy” on 10/24/08 when it was -70% off its 2007 highs, and it would have taken around 4.75 years to recover those 2007 highs on 1/24/13. The annualized returns would have been over +30% per year, more than double the returns of the S&P 500. So, this really checks all the boxes in terms of a timely recovery and in terms of producing alpha relative to the S&P 500 index. But, we have to buy it at the right price in order to get these sorts of returns.
Conclusion
My approach to deep cyclical stocks is simple, but also very strict. I require extremely cheap prices and a strong history of a timely recovery. Right now, KLAC’s debt and stock price are too high for me to buy because I aim for returns that have a high probability to outperform the market. But if over the next 12 months the stock price comes down along with the debt load I would be willing to buy the stock at -70% off its highs at a price of $137.14.
It’s difficult to say whether it gets that low or not during a recession. I think if we had a full recession in 2023, I would put the odds at 50/50 I get a chance to buy at my desired price. Semiconductor equipment stocks have been holding up very well since 2009 and I do believe they are still in a secular uptrend. That could buoy prices, even in a recession. But we also haven’t experienced a “real” recession since 2009, either, and usually, recessions do not treat this stock well. Even if it doesn’t fall to buyable levels for me, I’m sure I’ll find plenty of opportunities in the wider semiconductor space.
Be the first to comment