

Oat_Phawat
Part I – Introduction
Toronto-based Kinross Gold Corp. (NYSE: NYSE:KGC) released its third quarter 2022 results on November 9, 2022.
Note: I have followed KGC quarterly since 2015. This new article is a quarterly update of my article published on August 1, 2022.
1 – 3Q22 Result Snapshot
For the third quarter of 2022, revenues were $856.5 million, with a net income of $40.3 million or $0.05 per diluted share. The company now expects to produce about 2 Moz in 2022.
KGC 3Q22 highlights (KGC Presentation)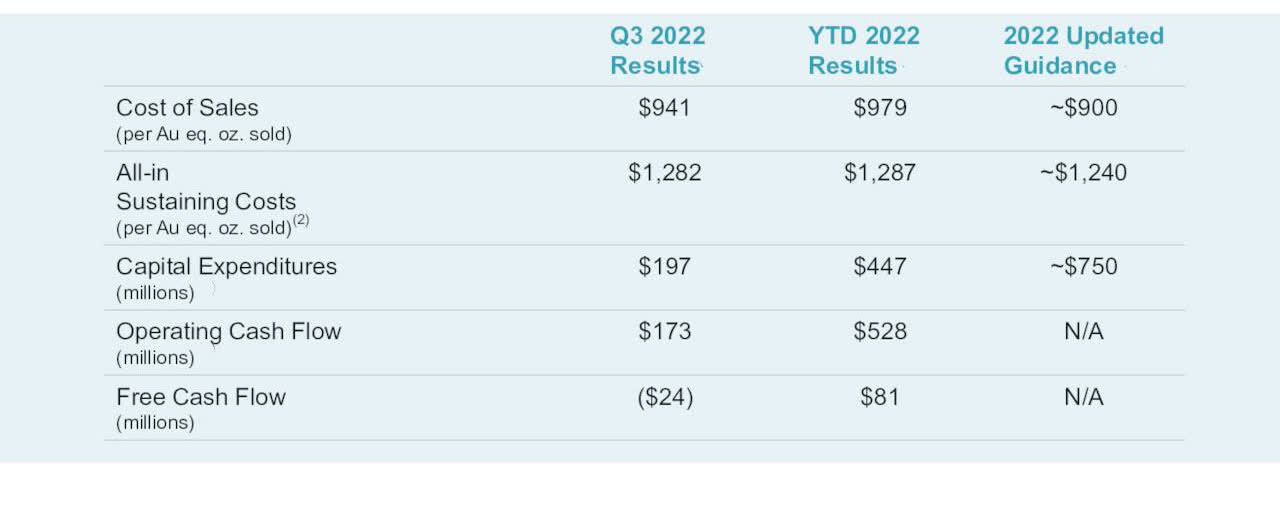
Important Reminder: On June 16, 2022, Kinross Gold completed the sale of 100% of its Russian assets to the Highland Gold Mining group of companies for total cash consideration of $340 million. The Company received $300 million in US dollars in its corporate account and will receive a deferred payment of $40 million after a year of closing.
Also, Kinross agreed with Asante Gold Corporation to sell the Company’s 90% interest in the Chirano mine in Ghana for total consideration of $225 million in cash and shares on April 25, 2022. The Chirano sale was completed on August 10, 2022.
One positive is that Kinross Gold is now an Americas-focused gold miner with only one African asset left, the Tasiast mine in Mauritania. Production is expected to be above 2 Moz per year from 2022 to 2025.
KGC Investment case Presentation (KGC Presentation)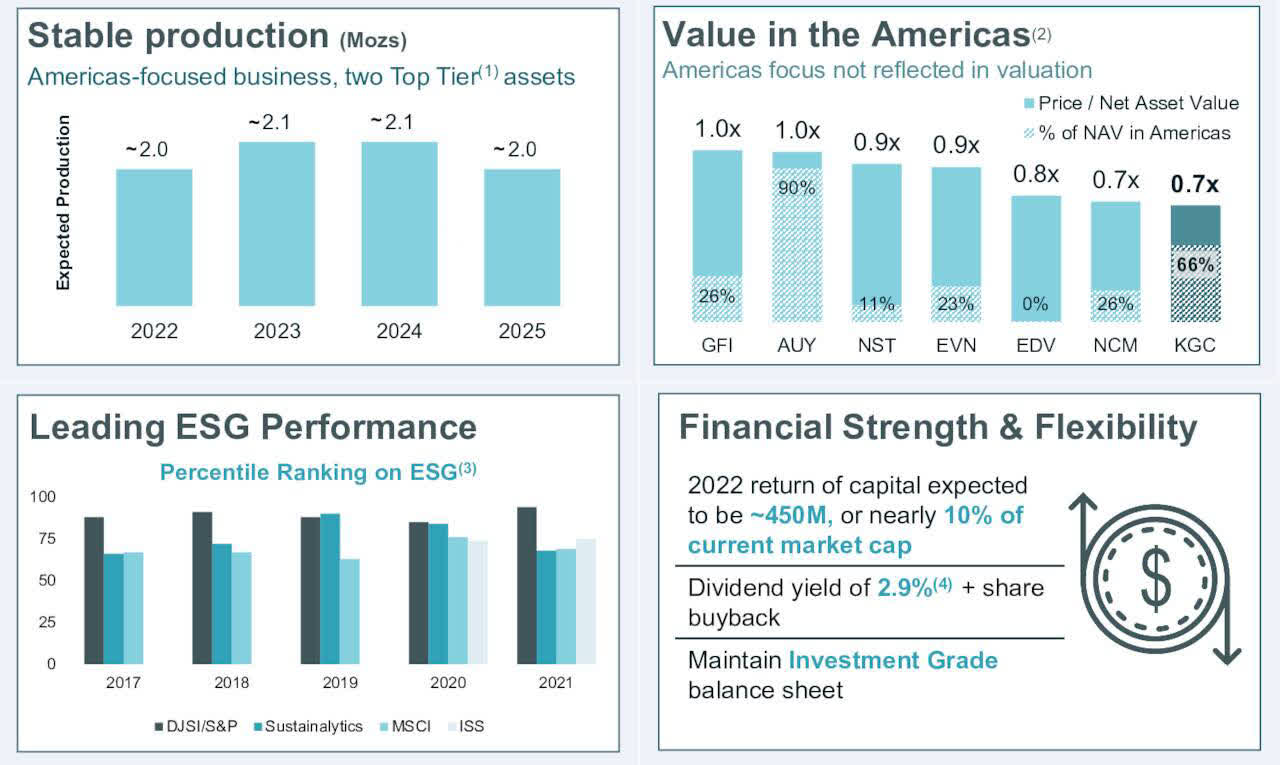
2022 gold equivalent production has been revised down and is expected to be 2 Moz.
KGC Assets Map (KGC Presentation)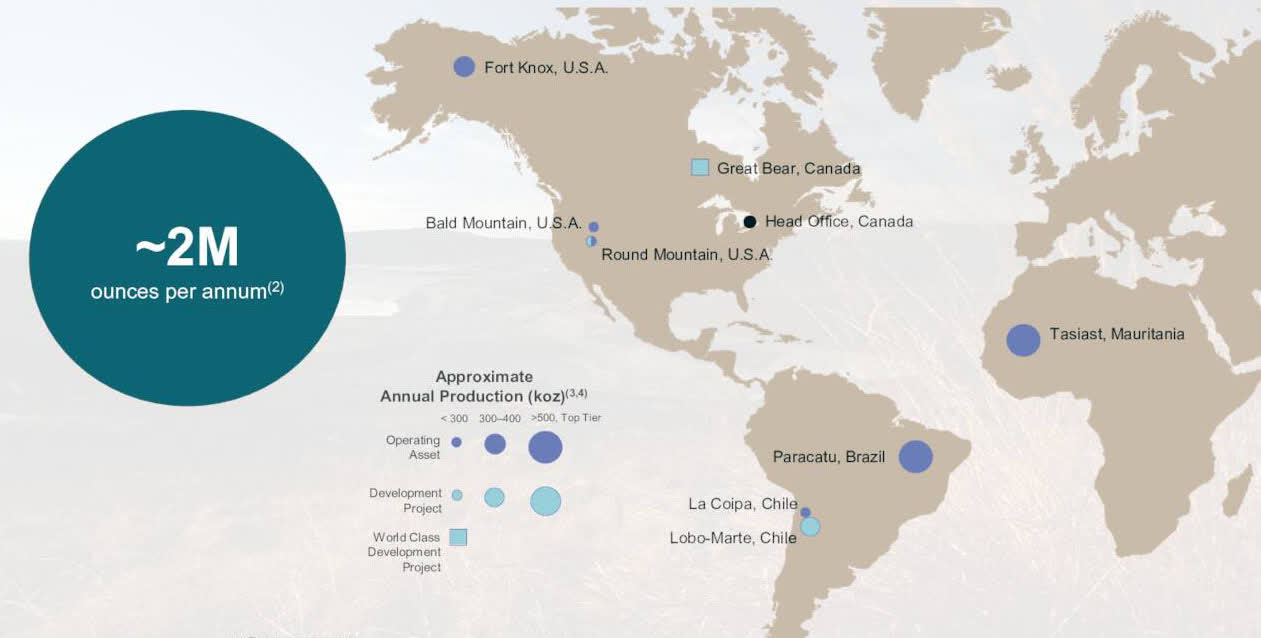
The Company expects its 2022 production to be approximately 2 million Au eq. Oz., mainly due to the slower-than-expected ramp-up at La Coipa and the challenges associated with commissioning the Tasiast 24k project.
J. Paul Rollinson, President, and CEO, said in the conference call:
With respect to our third quarter performance, our operations continue to make strong progress with production up 17% and costs down 8% compared to the second quarter. Similar to prior years, our plans again this year called for increase in production throughout the year, which we are seeing.
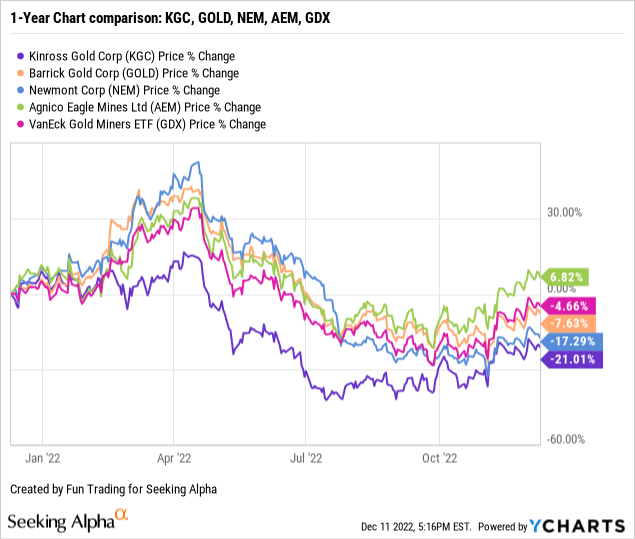
2 – Stock Performance
Kinross has underperformed the VanEck Vectors Gold Miners ETF (GDX), Barrick Gold (GOLD), Newmont Corp. (NEM), and Agnico Eagle (AEM) on a one-year basis, mainly due to the technical issue at the Tasiast mine and the fire sale of its assets in Russia. KGC is now down 21% on a one-year basis.
Part II – Kinross Gold – Financials History 3Q22 – The Raw Numbers
| Kinross Gold | 3Q21 | 4Q21 | 1Q22 | 2Q22 | 3Q22 |
| Total Revenues in $ Million | 582.4 | 1,744.7 | 768.0 | 821.5 | 856.5 |
| Net Income in $ Million | -44.9 | -2.70 | -523.8 | -40.3 | 64.9 |
| EBITDA $ Million | 151.3 | 654.4 | 275.7 | 241.0 | 301.4 |
| EPS Diluted in $/share | -0.04 | -0.01 | -0.41 | -0.03 | 0.05 |
| Operating Cash Flow in $ Million | 269.9 | 197.3 | 196.6 | 207.9 | 171.6 |
| Capital Expenditure in $ Million | 216.8 | 380.5 | 117.3 | 155.0 | 217.8 |
| Free Cash Flow in $ Million | 53.1 | -183.2 | 79.3 | 52.9 | -46.2 |
| Total Cash $ Million | 586.1 | 531.5 | 454.2 | 719.1 | 488.4 |
| Long-Term Debt in $ Million | 1,429 | 1,630 | 2,729 | 2,610 | 2,512 |
| Shares Outstanding (diluted) in Million | 1,261 | 1,269 | 1,278 | 1,299 | 1,313 |
| Quarterly Dividend $/share | 0.03 | 0.03 | 0.03 | 0.03 | 0.03 |
Data Source: Company release and Fun Trading.
* Estimated by Fun Trading
Note: Historical data from 2015 are available for subscribers only.
1 – Gold Production Details For The Third Quarter
1.1 Total attributable gold equivalent production
KGC Quarterly Production history (Fun Trading)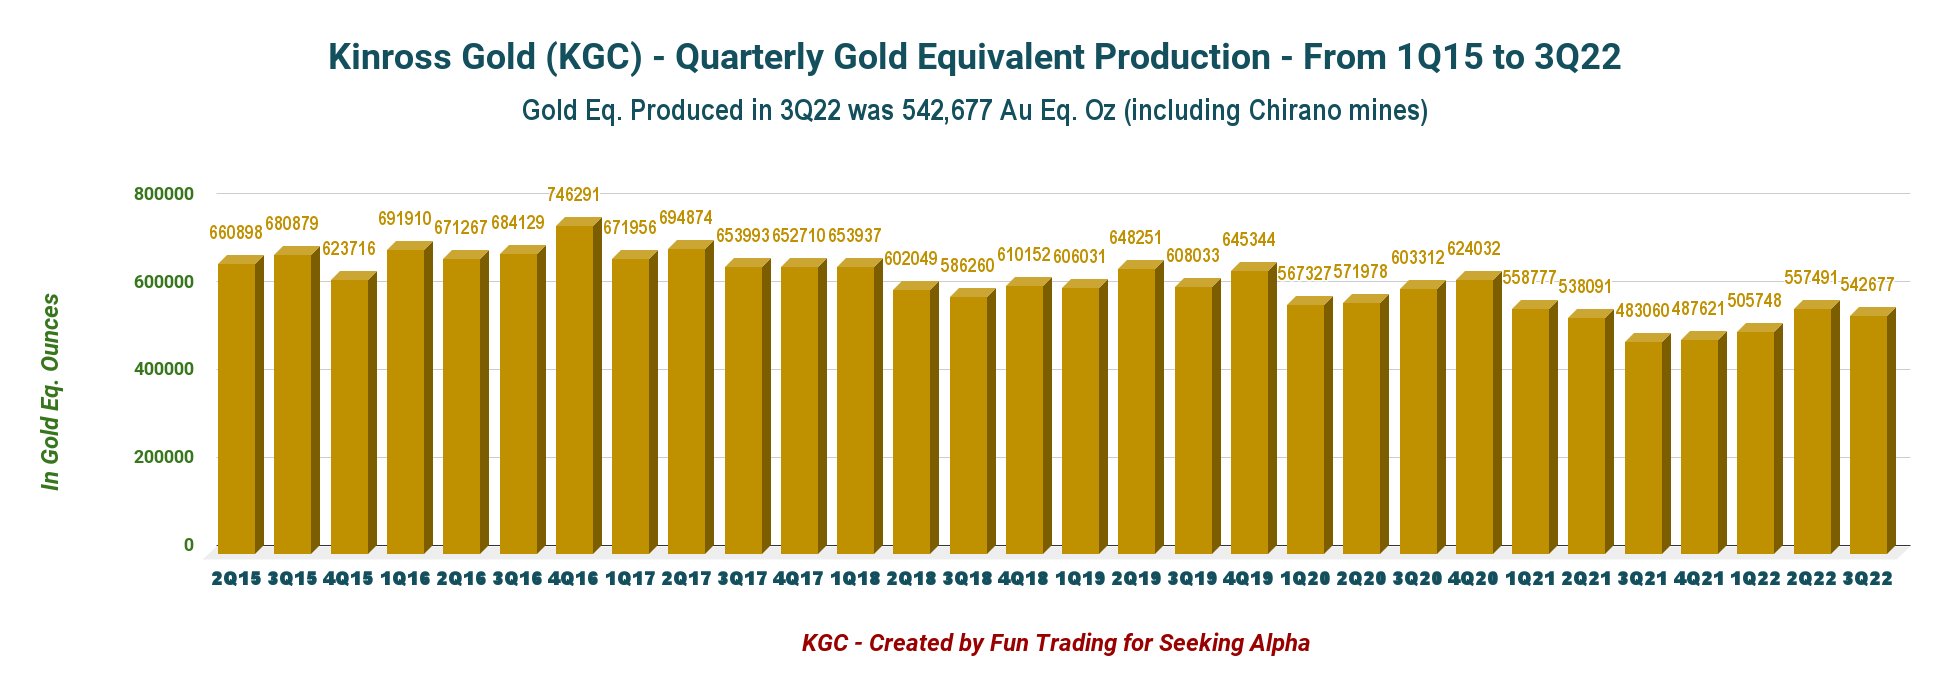
Kinross Gold equivalent produced 542,677 attributable Au eq. Oz. in 3Q22 – including production from Chirano (90%) – compared with 483,060 Au eq. Oz. in 3Q21. Production from continuing operations was 529,155 GEOs this quarter. Kinross Gold sold 509,431 GEOs in 3Q22.
KGC Production per quarter per mine 3Q21 2Q22 3Q22 (Fun Trading)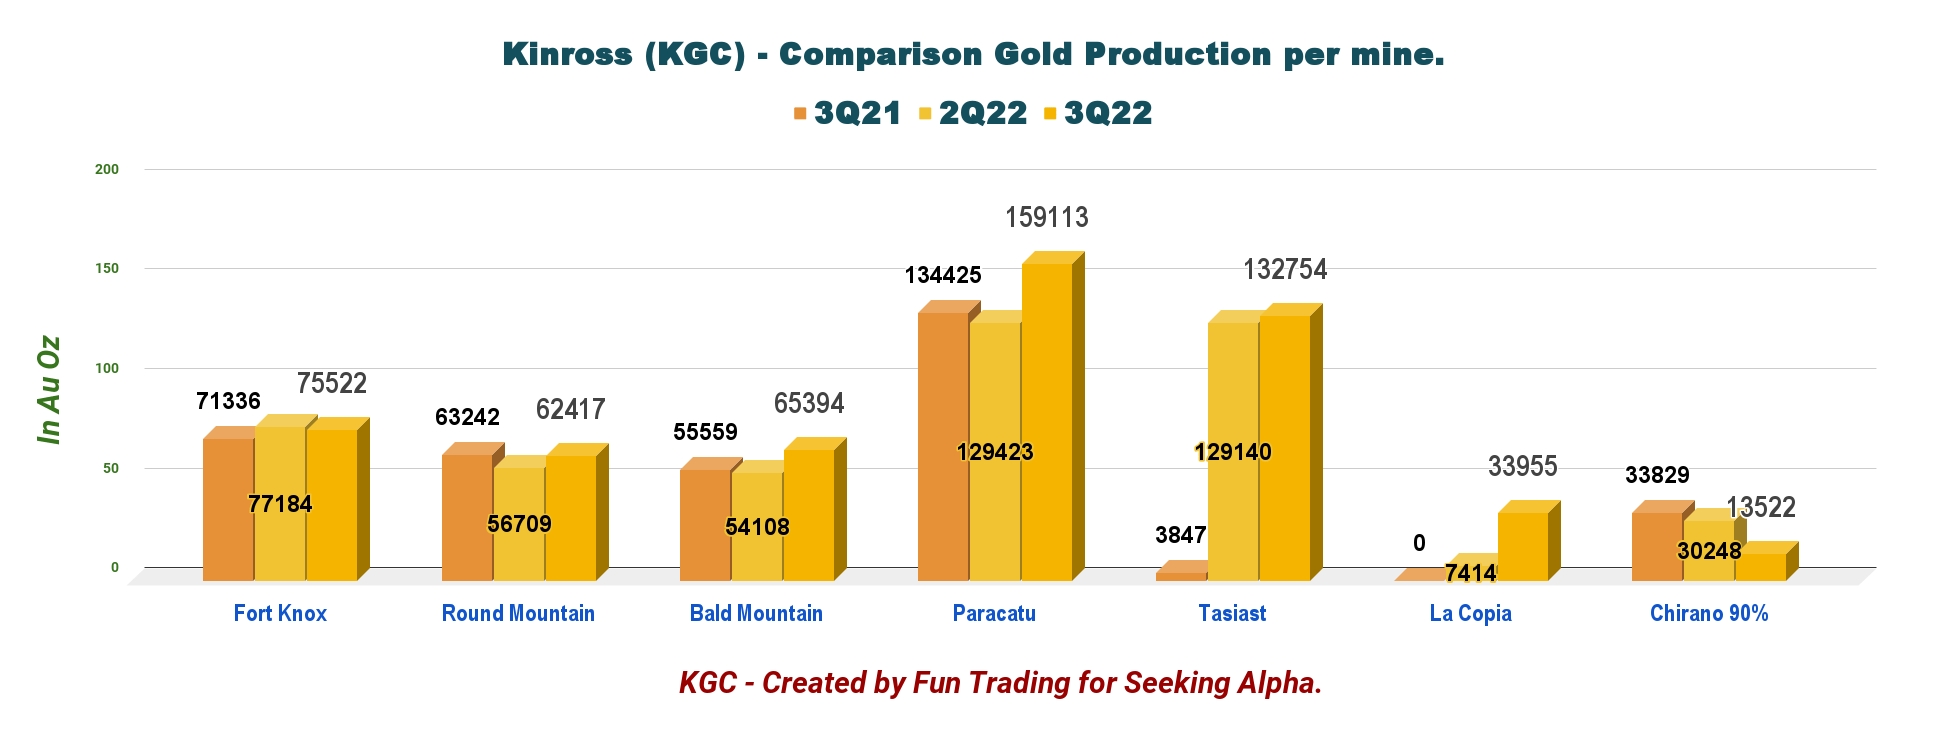
The total producing assets for Kinross Gold will drop to six units starting in 4Q22 (Chirano divestment).
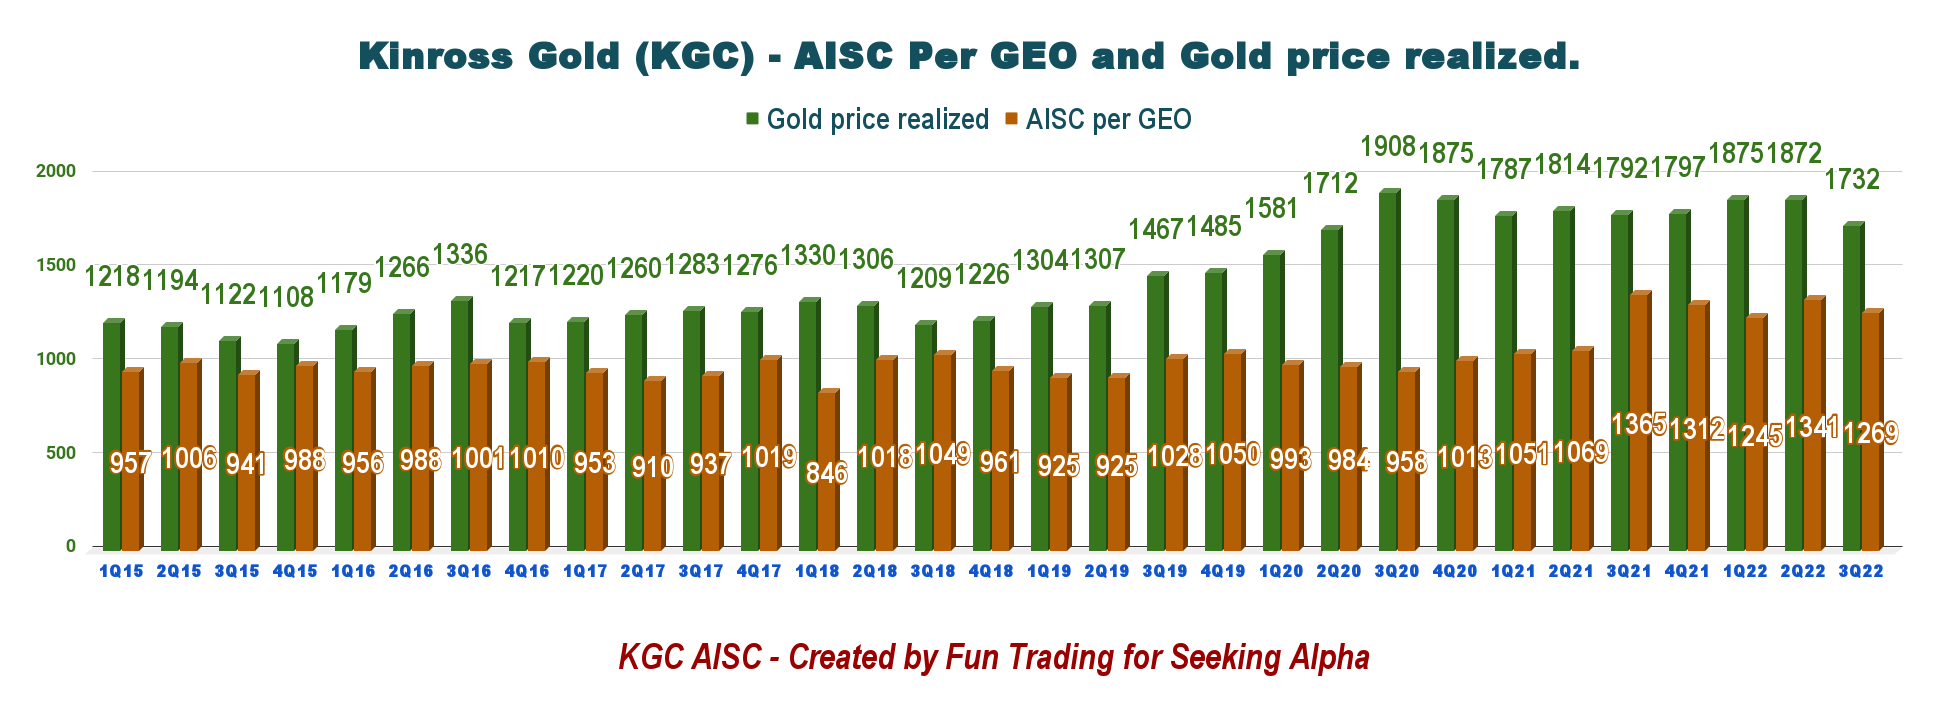
KGC Production per mine in 3Q22 (Fun Trading) KGC Quarterly AISC and gold price history (Fun Trading)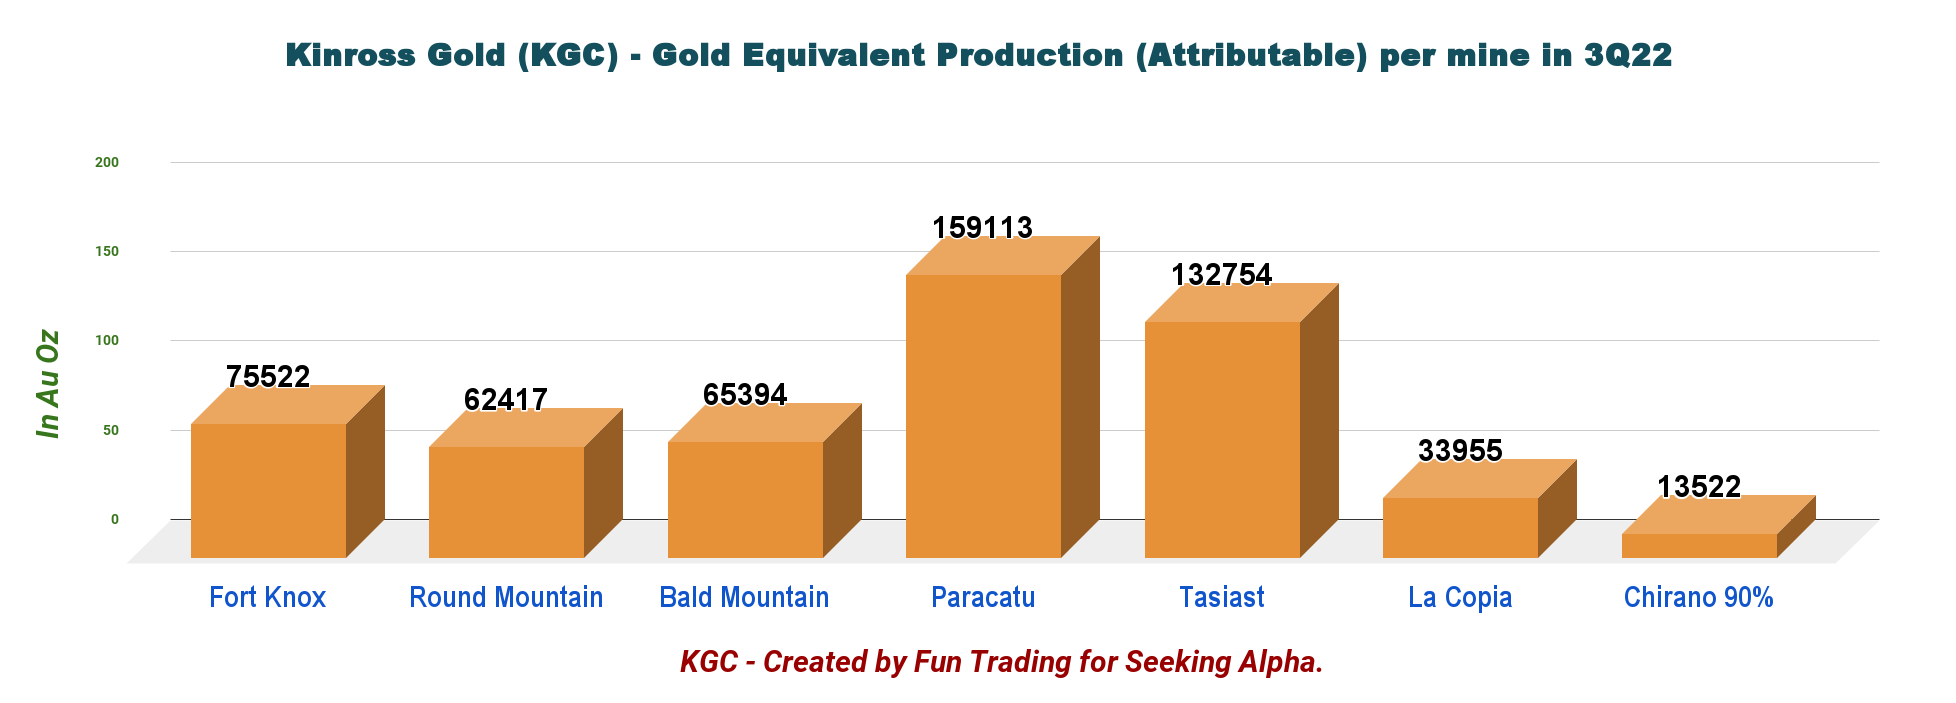
1.2 – Important Projects
1.2.1 Tasiast 24K
The Tasiast 24k project continues progressing on schedule to reach a throughput of 24,000 TPD by mid-2023. Also, the 34MW Tasiast solar power plant continues to advance and is on schedule for completion in the second half of 2023.
1.2.2 – Great Bear Project In Red Lake, Canada.
The Company continues progressing and is scheduled to declare an initial mineral resource in early 2023. The Company also plans to issue a Technical Report to support the resource.
To date, Kinross has drilled approximately 160,000 meters and is on track to complete at least 200,000 meters of exploration and infill drilling in 2022 at the Limb and LP Fault zones.
The company is excited about the project, and CEO Paul Rollinson said in the conference call:
I’d like to comment on Great Bear and how excited I am about the results we are seeing. Our drilling continues to confirm our thesis of a large, high-grade deposit with mineralization coming to surface and remaining open in all directions. In particular, our drilling continues to confirm our thesis that the deposit extends to debt.
1.2.3 – Manh Choh got the green light
On July 27, 2022, the Company, as the joint venture operator, announced that it would proceed with developing the 70%-owned Manh Choh project in Alaska.
The project is expected to increase the Company’s production profile in Alaska by approximately 640K attributable to Au eq. Oz. over the life of mine at lower costs.
Initial production from Manh Choh is expected in the second half of 2024.
2 – Kinross Gold: Financial Analysis
2.1 – Revenues were $856.2 million in 3Q22
KGC Quarterly Revenues history (Fun Trading)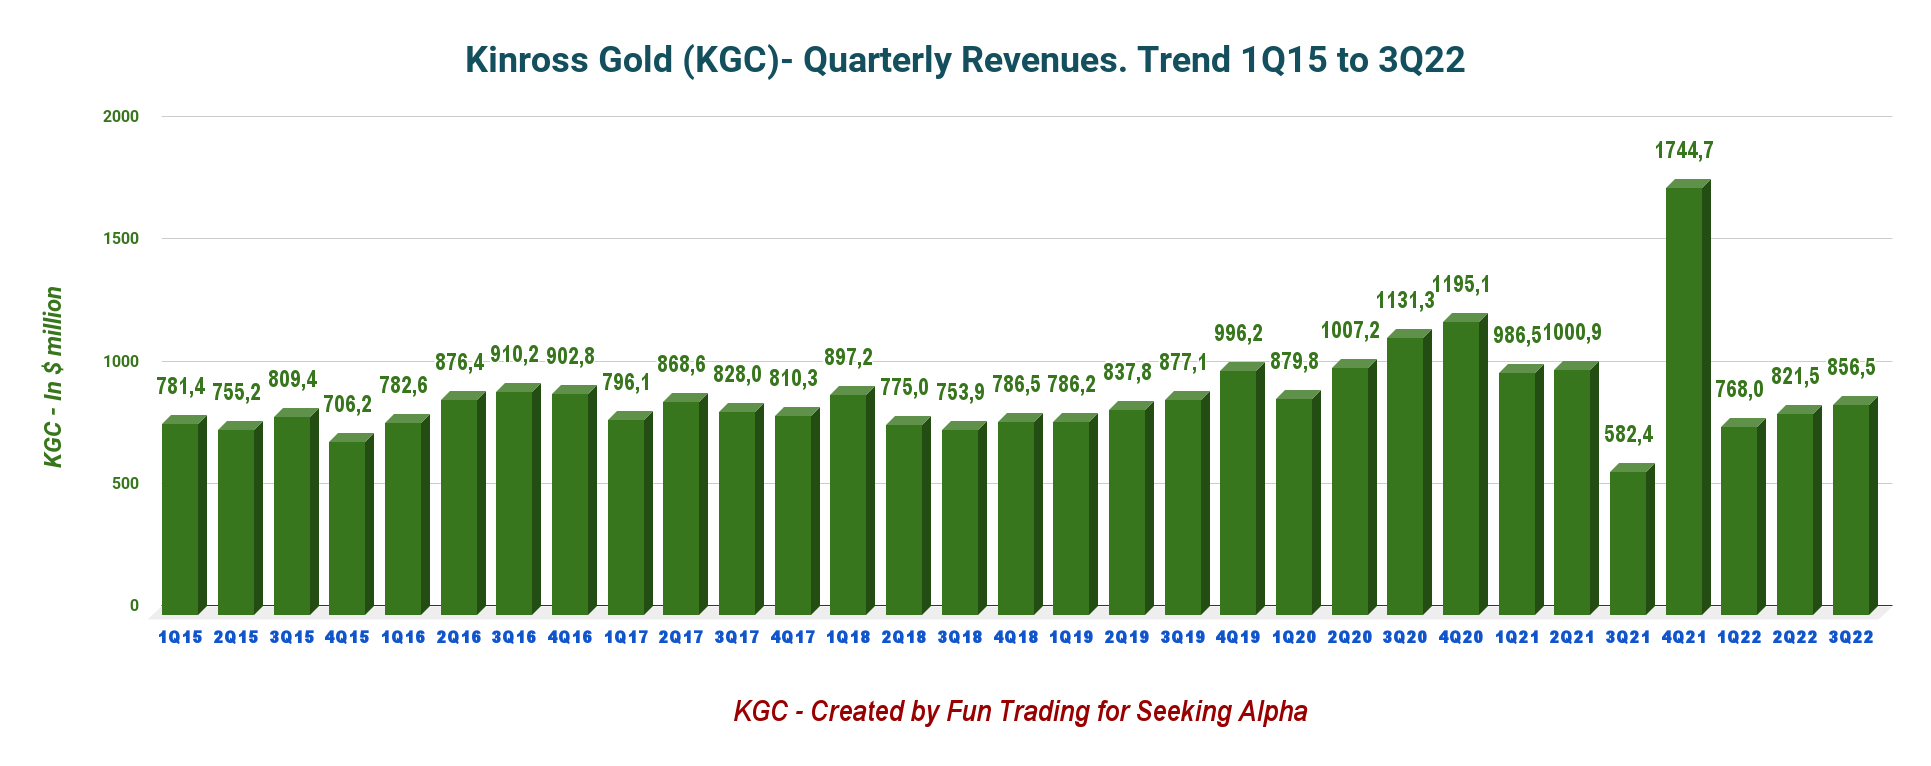
Note: Previous quarters were restated.
KGC posted an income of $64.9 million or $0.05 per diluted share in the third quarter of 2022, compared to a loss of $44.9 million or $0.04 per diluted share in the same quarter last year.
The adjusted net earnings were $68.7 million or $0.05 per share for 3Q22.
Revenues from continuing operations in 3Q22 were up 47.1% year-over-year to $856.5 million.
The production cost of sales from continuing operations per Au eq. Oz. sold increased to $941 this quarter, compared with $891 in 3Q21, mainly due to inflationary cost pressures on key consumables, such as fuel, emulsion, and reagents across the portfolio.
2.2 – Free Cash Flow was a loss of $46.2 million in 3Q22
KGC Quarterly Free cash flow history (Fun Trading)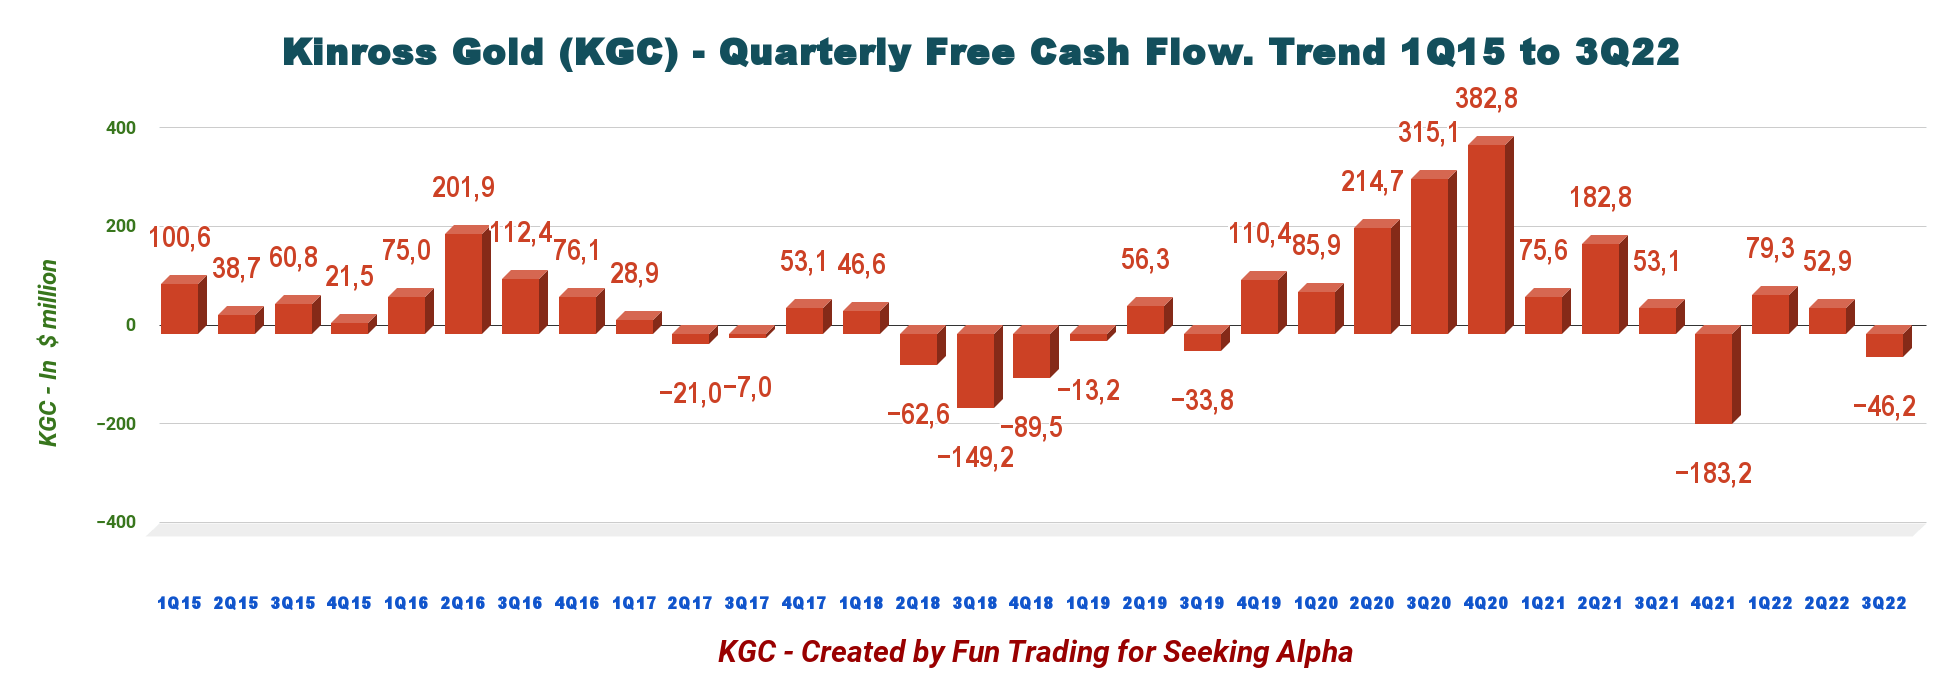
Note: Generic free cash flow is the cash from operations minus CapEx.
Trailing 12-month free cash flow is a loss of $97.2 million. The Company had a free cash flow loss of $46.2 million in 3Q22.
The Company pays a quarterly dividend of $0.03 per share or a yield of 2.85%.
The company repurchased $60 million worth of shares in 3Q22.
Reflecting the Company’s financial strength and proceeds from recent asset sales, under the enhanced share buyback program Kinross has re-purchased approximately $180 million in shares, or 60% of the $300 million target for 2022.
On September 29, 2022, Kinross received approval from the Toronto Stock Exchange to increase its normal course issuer bid (“NCIB”) program. Under the amended NCIB program, the Company is authorized to purchase up to 114,047,070 of its common shares (out of the 1,300,045,558 common shares outstanding as at July 27, 2022) representing 10% of the Company’s public float, during the period starting on August 3, 2022 and ending on August 2, 2023.
The company expects to generate significant Free cash flow in 4Q22. In the press release:
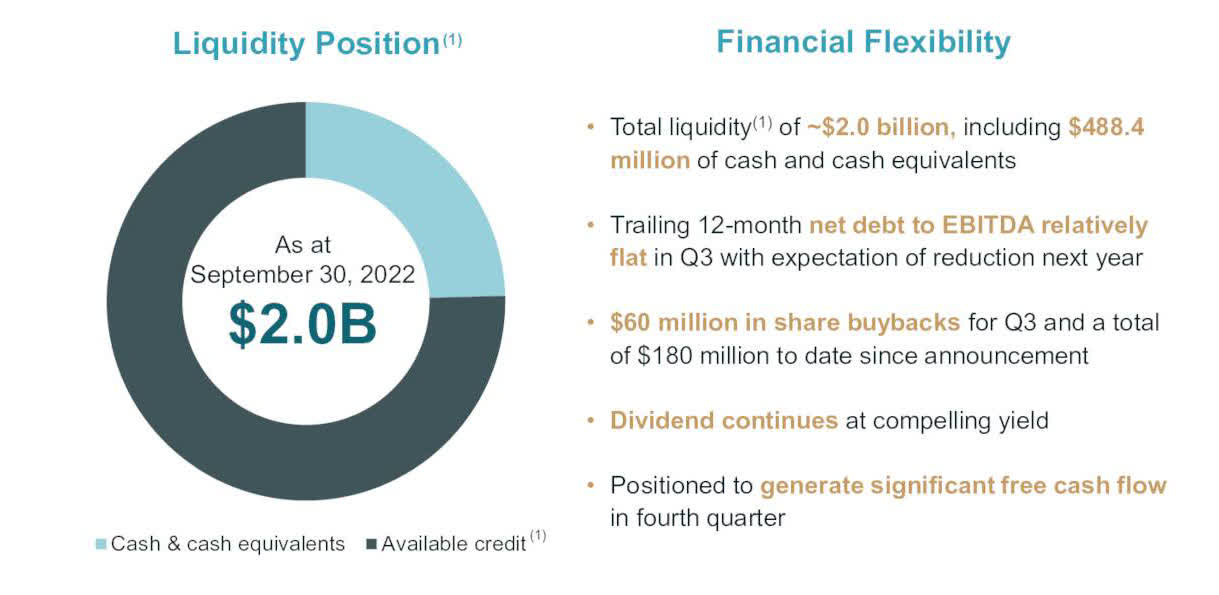
2.3 – Net debt and liquidity – Excellent profile.
The net debt dropped sequentially to $2,023 million in 3Q22 but is up significantly compared with 3Q21 ($842.6 million) after arranging a new $1 billion term loan and closing the Great Bear acquisition.
The Company had cash and cash equivalents of $488.4 million, with total liquidity of approximately $2 billion, on September 30, 2022.
KGC Quarterly Cash versus Debt history (Fun Trading) KGC Liquidity (KGC Presentation)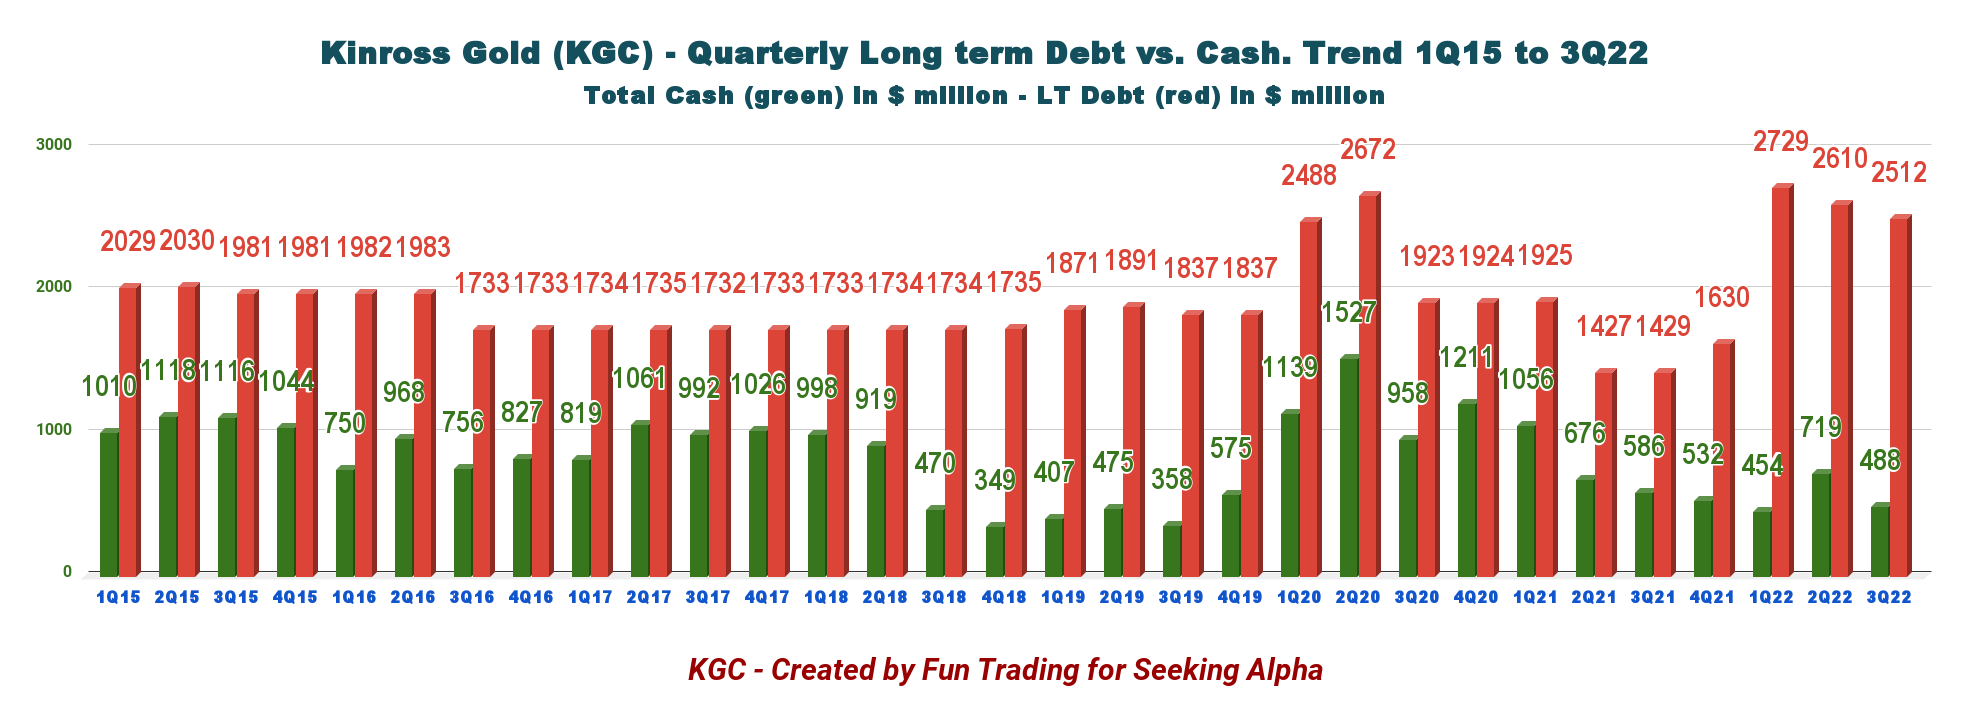
Part III – Technical Analysis & Commentary
KGC TA Chart short-term (Fun Trading StockCharts)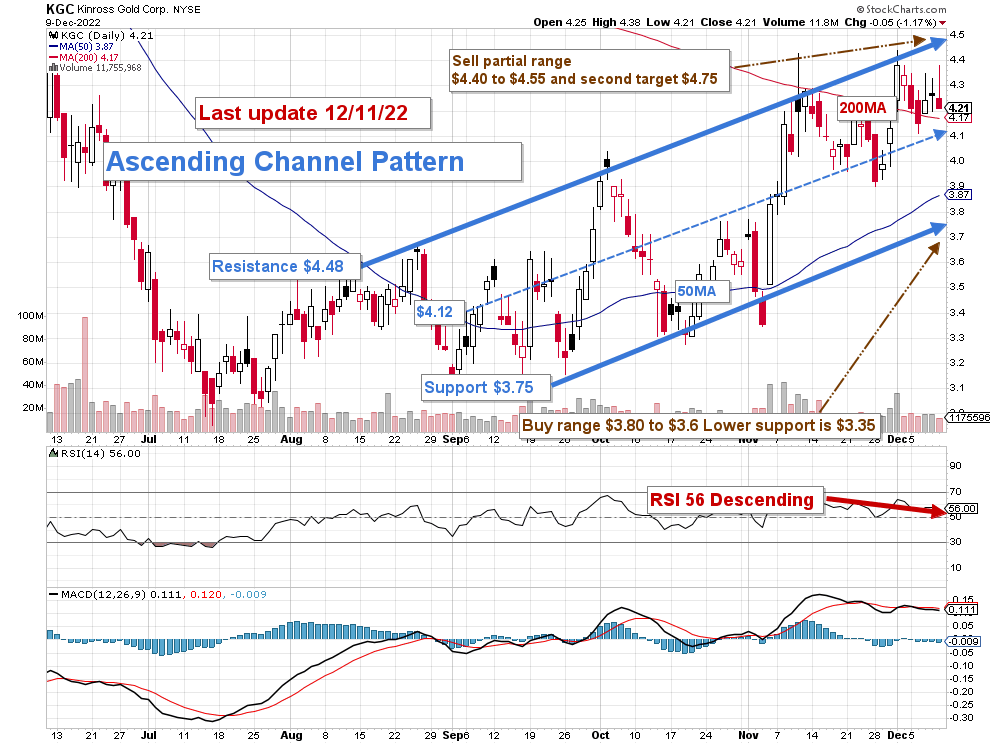
Note: the chart is adjusted for the dividend.
KGC forms an ascending triangle pattern with resistance at $4.48 and support at $3.75. Because of the wide channel range, some traders/investors should consider the mid-resistance/support range at $4.12 below the 50MA.
Ascending channel patterns are short-term bullish moving higher within an ascending channel, but these patterns often form within longer-term downtrends as continuation patterns.
It is the most common pattern for the gold miners that have trended up after the FED announced it would raise the interest rate by 50 points on December 14, boosting gold and silver much higher in the process.
I recommend trading short-term LIFO about 50%-60% and keeping a core long-term position for a final target of $7. I promote the basic strategy in my marketplace, “The Gold and Oil corner.”
I suggest selling about 60% of your position between $4.40 and $4.55 with possible upper resistance at $4.75 and buying KGC between $3.80 and $3.60 with possible lower support at $3.35. For frequent traders, I suggest trading around the mid-support at $4.12-$4.17.
Trading LIFO lets you keep your old position, which is generally underwater in the KGC case, and trade your most recent position for gain without selling your long position at an unnecessary loss. By repeating this exercise, you will be able to accumulate a solid gain that you can keep to lower your long position.
Warning: The TA chart must be updated frequently to be relevant. It is what I am doing in my stock tracker. The chart above has a possible validity of about a week. Remember, the TA chart is a tool only to help you adopt the right strategy. It is not a way to foresee the future. No one and nothing can.
Author’s note: If you find value in this article and would like to encourage such continued efforts, please click the “Like” button below to vote for support. Thanks.
Be the first to comment