

imaginima
The dependency of European countries on Russian natural gas has decreased from 40% to below 10%. Also, the United States became the most significant natural gas producer, while its production levels are way more than the domestic demand levels. In this market condition, with 71 thousand miles of natural gas pipelines, Kinder Morgan (NYSE:KMI) is well positioned to benefit from the increasing natural gas transportation in the following years. Due to the stronger than expected commodity prices in the last three months and favorable gathering and pipeline volumes, the company has outperformed its 2022 financial guidance, increasing its previous 2022 net income of $2.5 billion, adjusted EBITDA of $7.2 billion, and DVF of $4.7 billion, by 5%. I expect KMI to report strong 3Q 2022 financial results. The stock is a buy.
Quarterly results
In its 2Q 2022 financial results, KMI reported revenues of $5151 million, compared with 2Q 2021 revenues of $3150 million, driven by solid growth in the natural gas business and commodity price uplift and SACROC above plan, helping KMI’s CO2 business segment. The company’s cost of sales increased from $936 million in 2Q 2021 to $2683 million in 2Q 2022. In the second quarter of 2022, KMI reported net income attributable to Kinder Morgan of $635 million, compared with 2Q 2021 net loss attributable to Kinder Morgan of $757 million. KMI’s natural gas transport volumes decreased from 38408 BBtu/d in 2Q 2021 to 37822 BBtu/d in 2Q 2022. The company’s natural gas sales volumes increased from 2561 BBtu/d in 2Q 2021 to 2579 BBtu/d in 2Q 2022. Also, KMI’s natural gas gathering volumes increased from 2667 BBtu/d in 2Q 2021 to 2997 BBtu/d in 2Q 2022. Furthermore, in the second quarter of 2022, the company’s gasoline pipeline decreased by 3% to 1017 MBbl/d, and its diesel fuel pipeline decreased by 11% to 372 MBbl/d. KMI reported a 2Q 2022 jet fuel pipeline of 267 MBbl/d, compared with a 2Q 2021 jet fuel pipeline of 224 MBbl/d. The company’s total oil production (net of royalties and outside working interests) decreased from 30.13 MBld/d in 2Q 2021 to 28.84 MBld/d in 2Q 2022. KMI’s 2Q 2022 cash dividend increased by 3% YoY to $0.2775 per share. “As we have for the last six years, we continue to live within our cash flow, and expect to continue to fund expansion capital opportunities with the cash flow we generate,” the CEO commented. “We also expect to meet or improve on our debt metric goal, and return excess cash to our shareholders through a strong dividend and opportunistic share repurchases,” he continued.
The market outlook
With 71000 miles of natural gas pipelines, KMI moves 40% of U.S. natural gas production. Also, the company does more than 15% of U.S. natural gas storage. “We currently transport approximately 50% of the natural gas used for U.S. LNG exports and given the proximity of our assets to planned LNG expansions, we expect to maintain or grow that share as we pursue that set of opportunities,” the CEO stated in the company’s 2Q 2022 financial results. It is worth noting that 62% of the company’s operations belong to the natural gas segment. EIA forecasts that U.S. consumption of natural gas averages 86.6 Bcf/d in 2022, up 3.6 Bcf/d from 2021, driven by increases across all consuming sectors. However, EIA expects consumption of natural gas to fall by 1.9 Bcf/d in 2023 because of declines in consumption in the industrial and electric power sectors (see Figure 1). Natural gas production is expected to increase to an average of 99.0 Bcf/d in 4Q22 and then rise to 100.4 Bcf/d in 2023. Also, U.S. natural gas export is expected to increase in the rest of 2022 and 2023 (see Figure 2).
Figure 1 -U.S. natural gas consumption
eia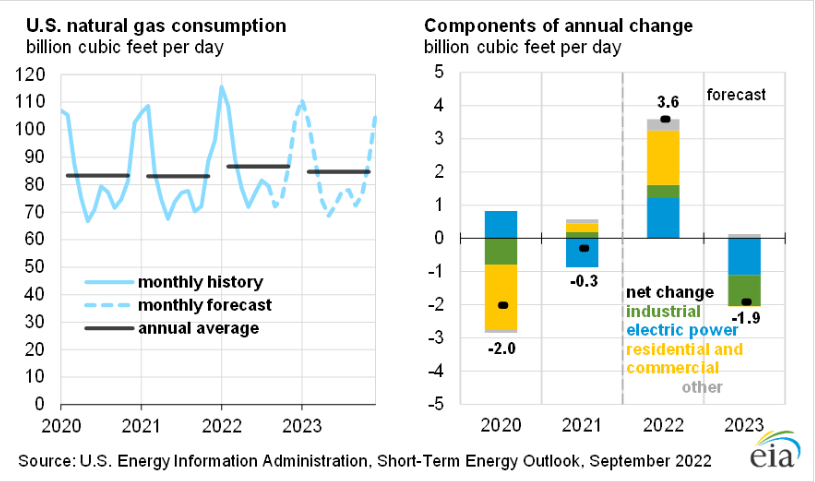
Figure 2 – U.S. annual natural gas trade
eia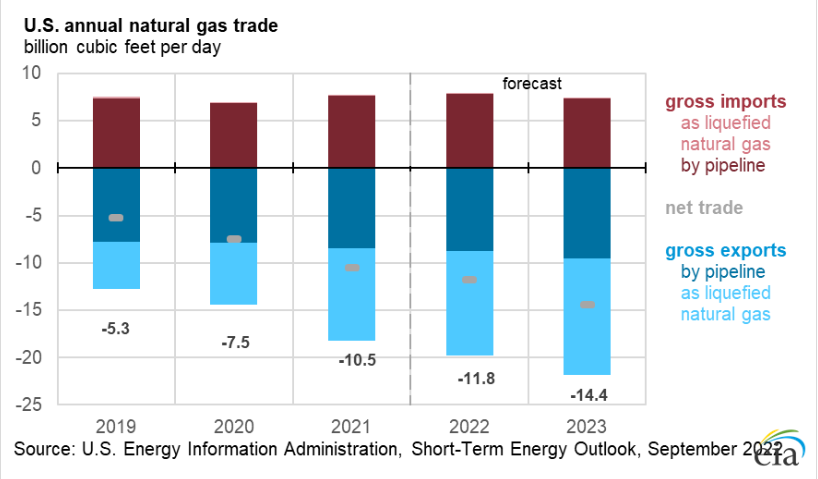
Before the war, Europe depended on Russia for more than 40% of its natural gas. Due to the geopolitical tensions in the region caused by the invasion of Russia into Ukraine, natural gas prices in the European Union skyrocketed. Recently, Russia’s state-controlled Gazprom suspended natural gas deliveries to Italy. Gazprom has already decreased its natural gas exports to Europe by more than 75% (see Figure 3). As a result, European countries are trying to find alternatives to Russian natural gas. Gas supply from Russia now represents around 9% and Norway is now Europe’s biggest supplier. Meanwhile, in 2022, the United States turned into the biggest natural gas producer. According to U.S. natural gas production and demand levels, the country can export about 80 Bcf of natural gas per day (see Figure 4). Thus, KMI’s natural gas pipeline volumes will continue to increase in the following quarters.
Figure 3 – Gazprom natural gas exports to Europe dropped significantly
Bloomberg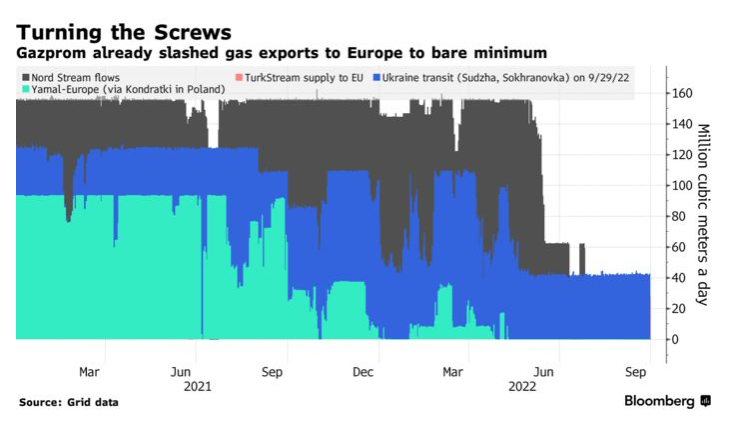
Figure 4 – U.S. natural gas exports potential
September 2022 investor presentation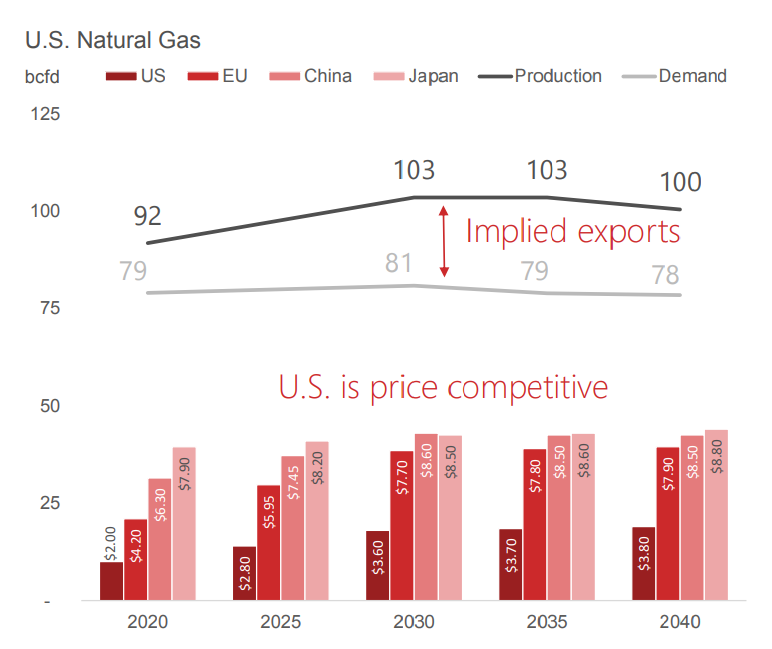
Furthermore, with 1500 miles of CO2 pipelines, KMI produces and transports CO2 to the Permian where it is used for enhanced oil recovery. 9% of KMI’s operations belong to the CO2 segment. The Permian Basin is the driver for U.S. production growth of crude oil and due to increased crude oil prices and technological advancements in drilling and completion techniques, oil production in the Permian Basin is increasing. Figure 5 shows that On October 2022, oil production in the Permian Basin is expected to increase by 66 thousand barrels per day. Thus, I expect KMI’s revenues from its CO2 segment to increase due to higher demand for its services
Figure 5 -Oil production in the Permian Basin
eia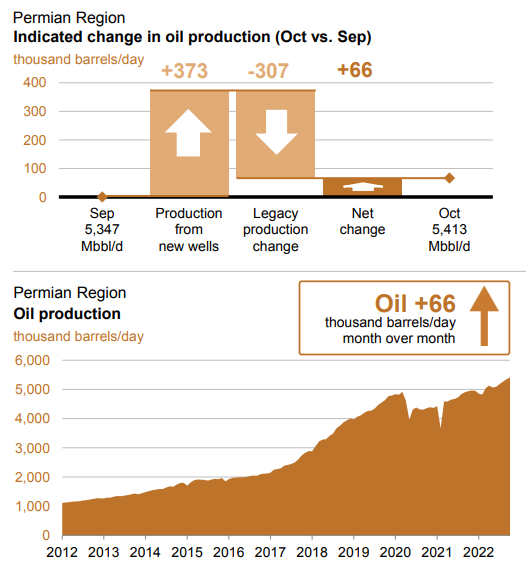
Kinder Morgan performance outlook
I looked at Kinder Morgan’s profitability ratios in this thorough article to assess how well the company can turn a profit and use its assets to make money for its investors. I have examined the profitability ratios for margin ratios and return ratios to provide useful insights into the financial health of the company.
In general, margin ratios evaluate the company’s ability to turn revenues into profits in a number of ways. It is clear that this major natural gas transporter had lower gross profit and EBITDA margins than in the prior quarter by roughly 16%. In comparison to its level of 0.42 in the first quarter of 2022, its gross profit margin was 0.35 in the second quarter of 2022. Furthermore, KMI’s EBITDA margin decreased by roughly 30% year over year from its level of 0.43 at the same time in 2021 to 0.3 in the second quarter of 2022. Examining the EBITDA margin has the advantage of excluding fluctuating costs and providing a clear view of the company’s performance. In summary, despite the decline in margin ratios over the previous year, it is anticipated that the company would increase sales, which will result in stronger margins, based on the company’s contracts and the rising demand for natural gas (see Figure 6).
Figure 6 – KMI’s margin ratios
Author (based on SA data)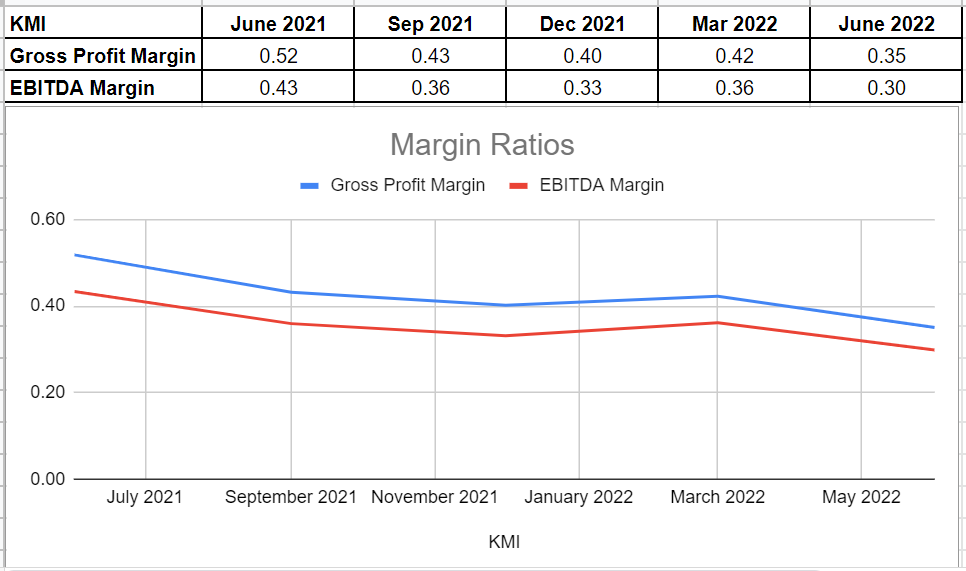
I looked into KMI’s return on equity and return on assets ratios to show how well the company can tailor returns to its shareholders. The ROA ratio illustrates the amount of profit an organization may produce for each dollar of its assets. The ROA ratio for Kinder Morgan has been rising over the past year. The return on assets for Kinder Morgan in the second quarter of 2022 was 0.92% compared to a negative value at the same point in 2021. Additionally, its return on equity for the second quarter of 2022 was 2.01%, which is above the ROE levels in the last months of 2021. This ratio shows the company’s net income in relation to shareholders’ equity and is important since it calculates the rate of return on the capital invested in the business. This means that Kinder Morgan’s return ratios could indicate that the corporation has improved its return circumstances (see Figure 7).
Figure 7- KMI’s return ratios
Author (based on SA data)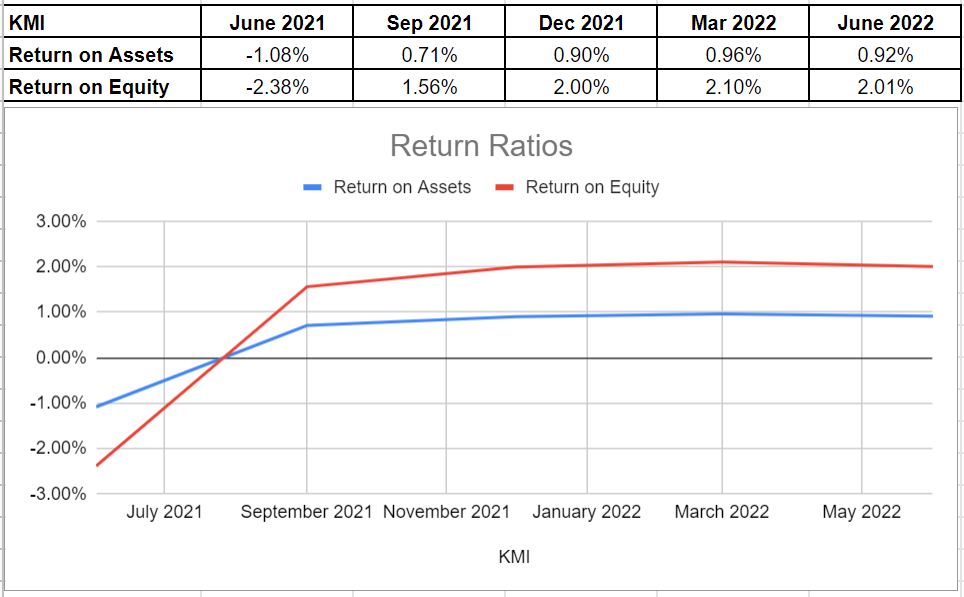
Conclusion
Ultimately, all was said and done, according to the preceding remarks, the company’s profitability performance, and the increasing demand for natural gas due to the invasion of Russia into Ukraine, it is not surprising to see that Kinder Morgan Inc., as the largest natural gas transporter in the United States, may bring more benefits for its investors in the future. Thus, I believe that a buy rating is appropriate for KMI stock.
Be the first to comment