

bob_bosewell/iStock via Getty Images
The Invesco KBW High Dividend Yield Financial ETF (NASDAQ:KBWD) provide exposure to small-cap financial companies and REITs. The ETF pays an attractive 10.0% trailing 12 month distribution yield, but I am concerned that its yield is higher than its average annual returns. It also pays an extremely high total expense ratio of 3.84%, inclusive of acquired fees. I think total return investors may be better off with vanilla sector ETFs.
Fund Overview
The Invesco KBW High Dividend Yield Financial ETF provides exposure to financial companies that pay a high dividend yield. The KBWD ETF tracks the KBW Nasdaq Financial Sector Dividend Yield Index (“Index”), an index designed to track financial services companies, including REITs, that pay high dividend yields.
The KBWD fund has $390 million in assets.
Portfolio Holdings
Figure 1 shows the portfolio holdings of the KBWD ETF. As designed, KBWD has a 43.3% allocation in Residential & Commercial REITs, 29.3% in Investment Banking firms, and 15.4% allocation in Banking Services. In total, the fund has 57% of assets invested in financial services and 43% in REITs.
Figure 1 – KBWD industry allocation (Author created with portfolio from KBWD website)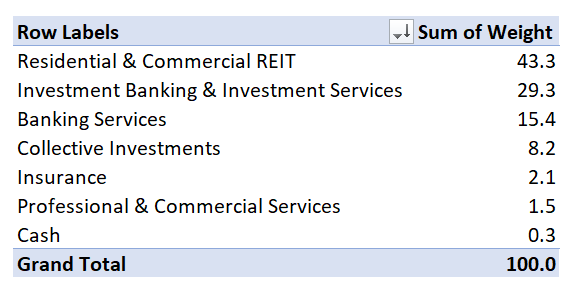
The fund skews to small-cap value stocks, with an average market cap size of the fund’s holdings of $1.75 billion and a 9.8x trailing P/E ratio.
Figure 2 – KBWD market cap allocation (invesco.com)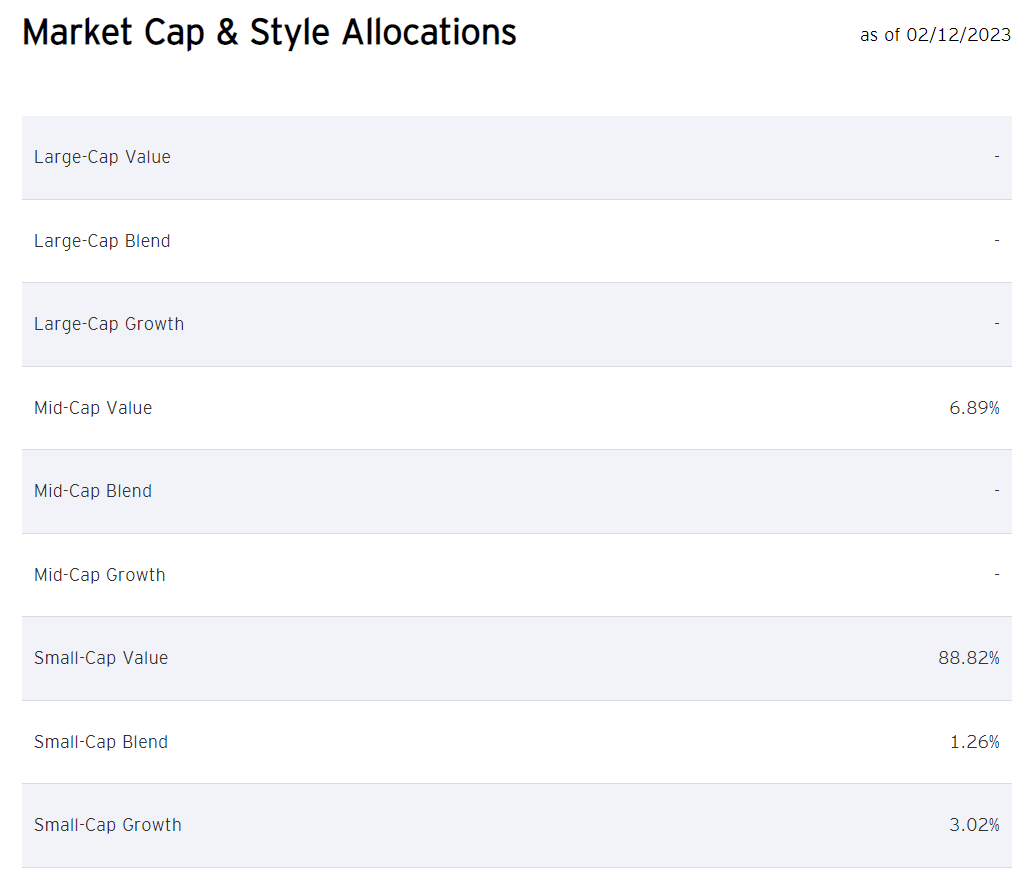
Figure 3 shows KBWD’s top 10 holdings, which comprise 38.3% of the portfolio.
Figure 3 – KBWD top 10 holdings (invesco.com)
Returns
Figure 4 shows KBWD’s historical returns. KBWD had a fantastic January, returning 15.8%. However, longer-term returns have been mediocre, with 3/5/10Yr average annual total returns of 1.2%/3.5%/5.2% respectively to January 31, 2023.
Figure 4 – KBWD historical returns (morningstar.com)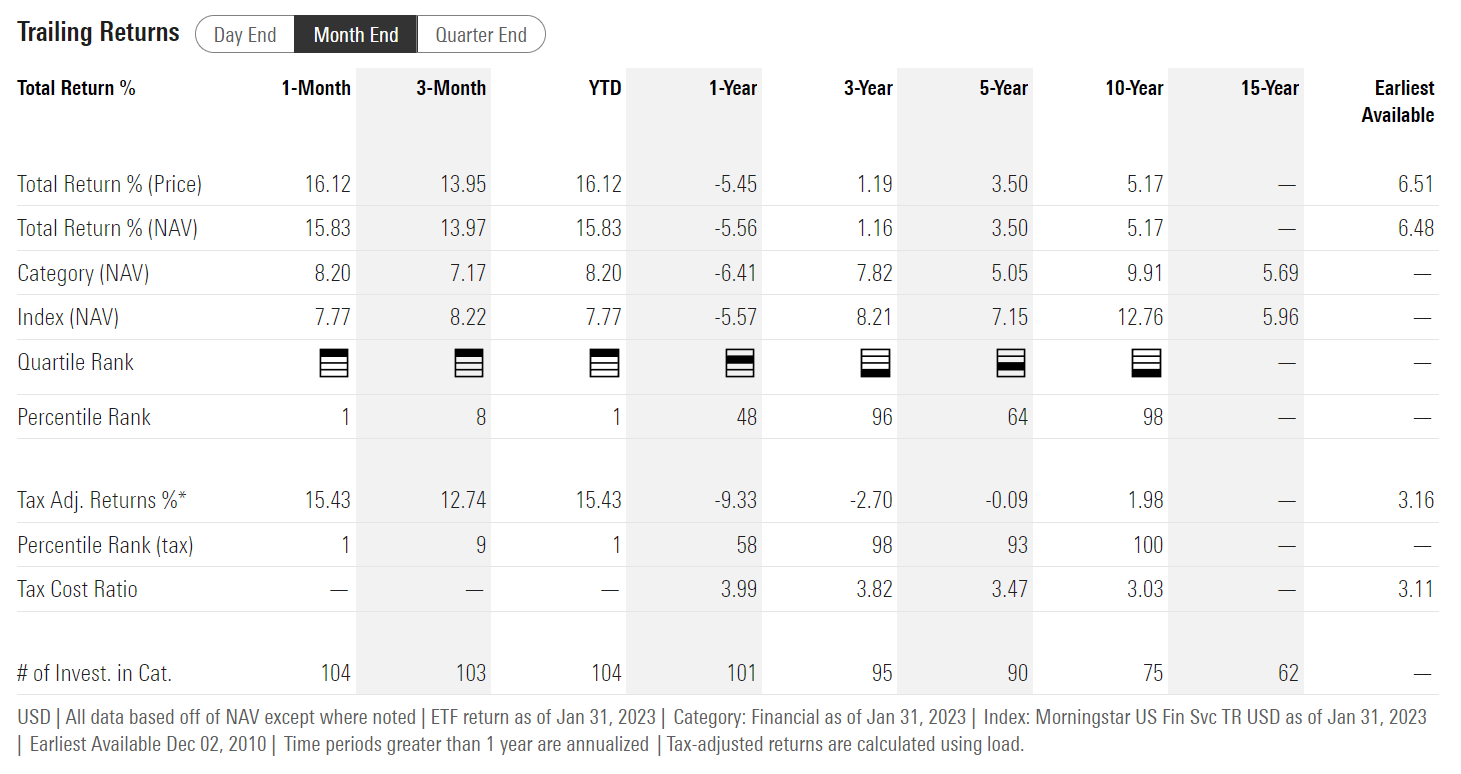
Rollercoaster Returns
Looking at KBWD on an annual basis, one is struck by the extreme annual volatility of returns. In the past 5 years, the KBWD fund lost 8.8% in 2018, gained 20.6% in 2019, lost 15.2% in 2020, gained 31.9% in 2021, and lost 19.0% in 2022 (Figure 5)
Figure 5 – KBWD extremely volatile annual returns (morningstar.com)
KBWD’s volatile annual returns show up in elevated portfolio volatility, with 3Yr volatility of 38.4% and 5Yr volatility of 31.4%. This translates into low Sharpe Ratios of 0.23 on 3Yr and 0.25 on a 5Yr basis for the ETF (Figure 6).
Figure 6 – KBWD has poor risk metrics (morningstar.com)
Figure 6 also shows that the KBWD ETF has significantly higher volatility and lower returns than the Morningstar category Financial Index.
Distribution & Yield
KBWD’s main selling point is its high monthly distribution, with a trailing 12-month distribution rate of $1.69/share which translates into a 10.0% trailing yield (Figure 7).
Figure 7 – KBWD distribution (Seeking Alpha)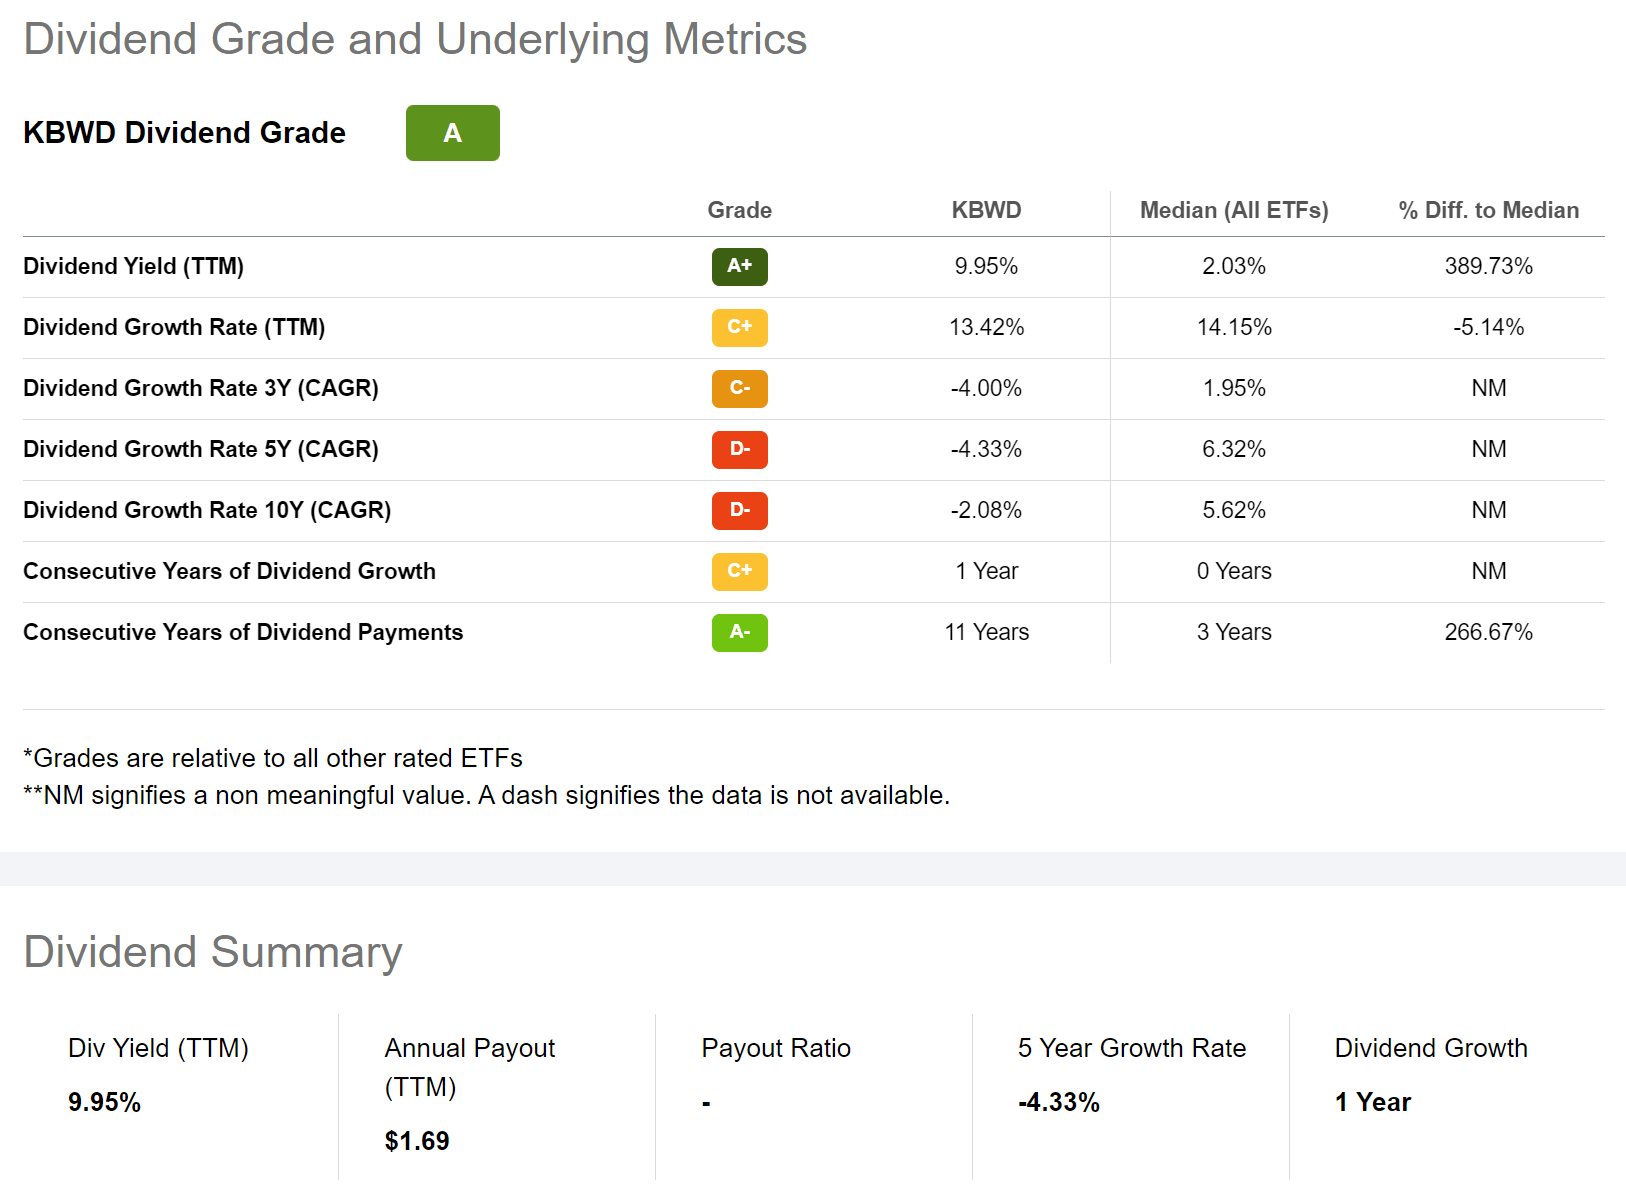
However, investors should be mindful that with the fund paying a 10.0% yield but only earning a 5Yr average annual total return of 3.5%, the fund may have a (return – distribution) shortfall.
Fees
The KBWD ETF charges a relatively small 0.35% management fee. However, many of the fund’s holdings also charge management fees (REITs and financial services companies), so the all-in total expense ratio is an eye-watering 3.84% (Figure 8).
Figure 8 – KBWD has a high total expense ratio (invesco.com)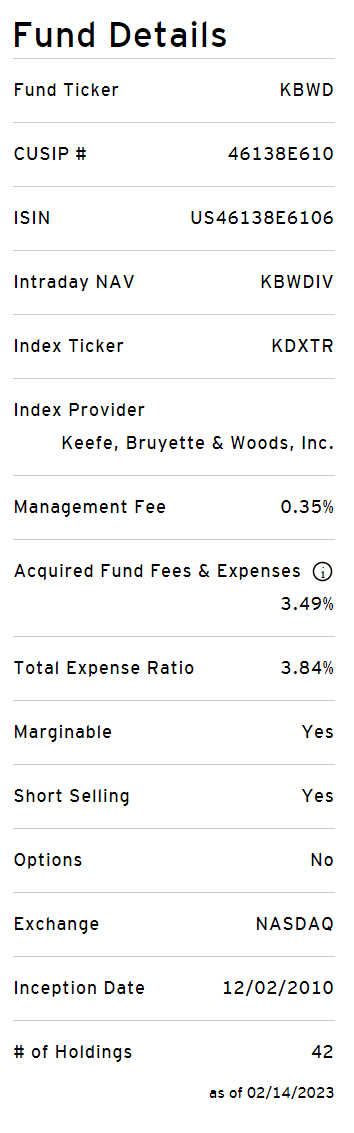
KBWD vs. IYR and XLF
Since the KBWD ETF is predominantly invested in REITs and financial companies, it might be helpful to compare its historical performance to the iShares US Real Estate ETF (IYR) and the Financial Select Sector SPDR ETF (XLF). Figure 9 and 10 compares the funds using the time period January 2011 (KBWD’s inception) to January 2023.
First, as expected, KBWD is highly correlated to IYR and XLF, showing correlations of monthly returns of 0.72 and 0.81 to IYR and XLF respectively (Figure 9).
Figure 9 – KBWD is highly correlated to IYR and XLF (Author created with Portfolio Visualizer)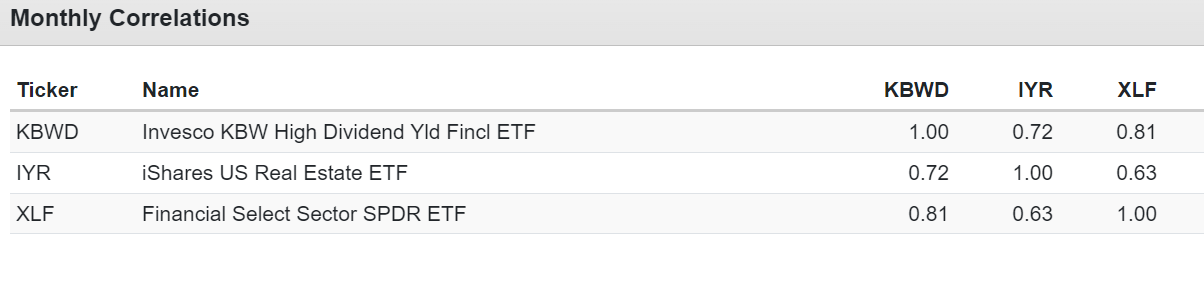
Moving on to performance, the KBWD ETF has a CAGR return of 6.2% vs. IYR at 7.9% and XLF at 11.0% in the time period analyzed (Figure 10). KBWD also has a markedly higher volatility of 22.1% vs. 16.6% and 19.0% respectively. This translates into a far lower Sharpe Ratio of only 0.37 vs. 0.50 and 0.61 for IYR and XLF.
Figure 10 – KBWD vs. IYR and XLF returns and risk (Author created with Portfolio Visualizer)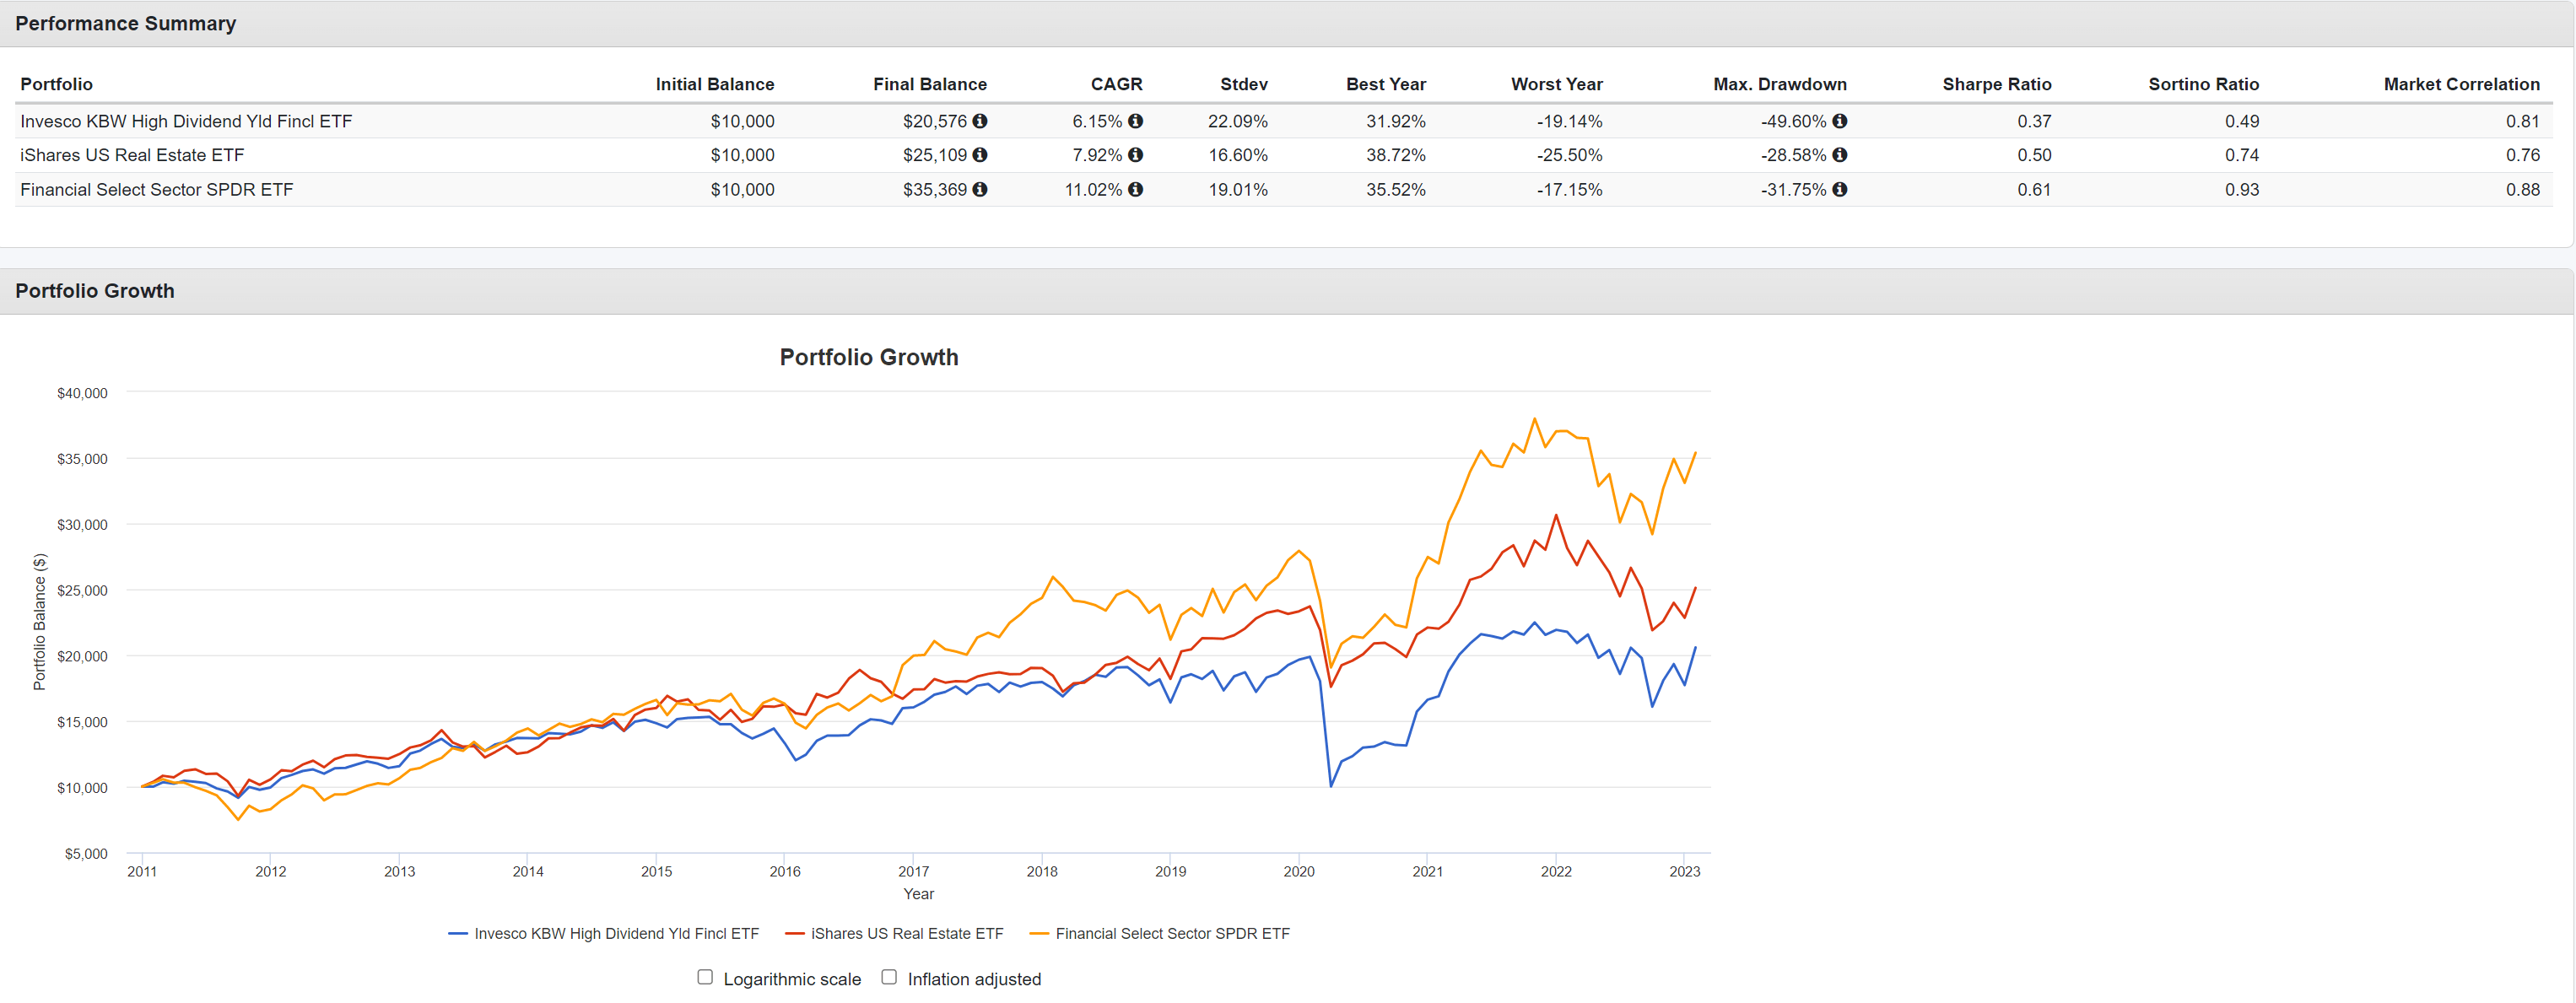
The only area where KBWD is measurably better than IYR and XLF is its distribution yield, where KBWD is paying a 10.0% trailing yield vs. 2.7% for IYR and 1.9% for XLF (Figure 11).
Figure 11 – KBWD has a far higher distribution yield than IYR and XLF (Seeking Alpha)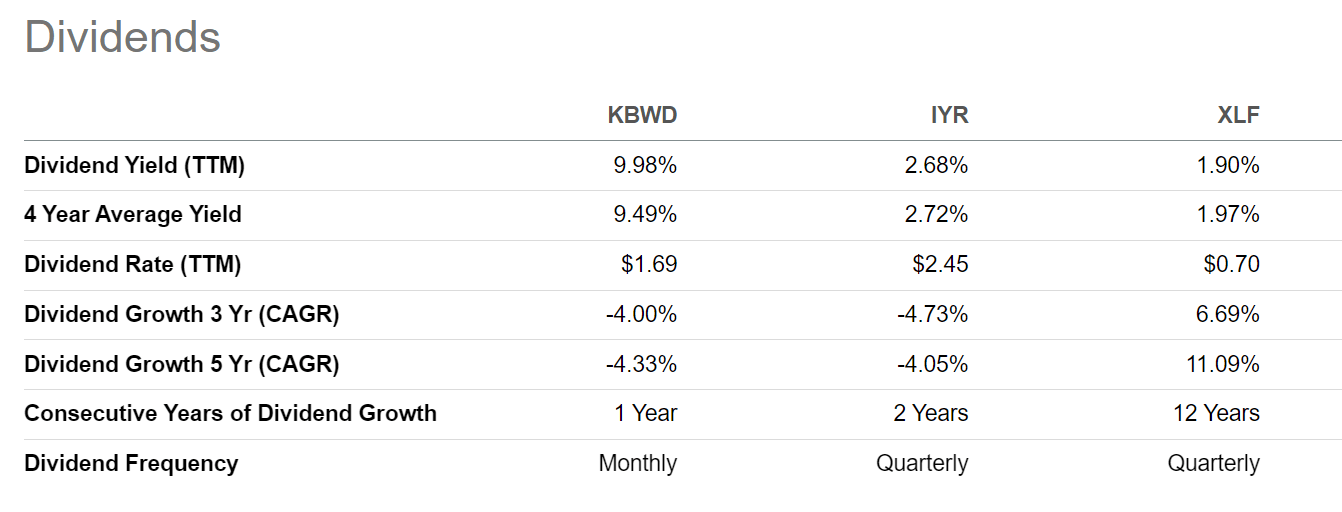
However, I feel KBWD’s high headline distribution yield is a bit of a mirage, as the fund clearly earns less in average annual total returns than its distribution yield. This means that while shareholders receive a high yield up-front, they pay for it through NAV declines in the back-end (such that total returns are less than the yield).
Conclusion
While the KBWD ETF pays an attractive 10.0% trailing 12-month distribution yield, I am concerned that it appears to be paying out a higher distribution yield than its average annual returns. It also charges a high total expense ratio of 3.84%, inclusive of acquired fees. Finally, although it correlates with the IYR and XLF ETFs, the KBWD lags significantly behind both vanilla ETFs while having higher volatility.
Be the first to comment