

metamorworks
A Quick Take On Karooooo
Karooooo Ltd. (NASDAQ:KARO) went public in April 2021, raising approximately $29 million in gross proceeds in an IPO that was priced at $28.00 per share.
The firm provides real-time mobility data solutions to fleet operators worldwide.
I’m still on Hold for KARO at its current level due to uncertainties in customer decision behavior in the short-term period ahead and dropping gross margin.
Karooooo Overview
Singapore-based Karooooo was founded to develop a SaaS platform for enterprises seeking to have constant communication and data analytics – telematics – for their vehicles and other assets.
Management is headed by founder and CEO, Isaias Jose Calisto, who was previously a member of Vehicle Tracking Services, a vehicle telematics distributor.
The company’s primary offerings include:
-
Communications
-
Analytics
-
Accounting
-
Live video streaming
-
Workforce management
-
Medical and roadside assistance
Karooooo’s Market & Competition
According to a 2019 market research report by Allied Market Research, the global market for automotive telematics was an estimated $50.4 billion in 2018 and is forecast to reach nearly $321 billion by 2026.
This represents a forecast CAGR of 26.8% from 2019 to 2026.
The main drivers for this expected growth are advances in solution options for organizations, and a strong demand for increased transportation efficiencies.
Also, below is a chart showing the expected growth pattern by segment within the larger vehicle telematics market:
Automotive Telematics Market (Allied Market Research)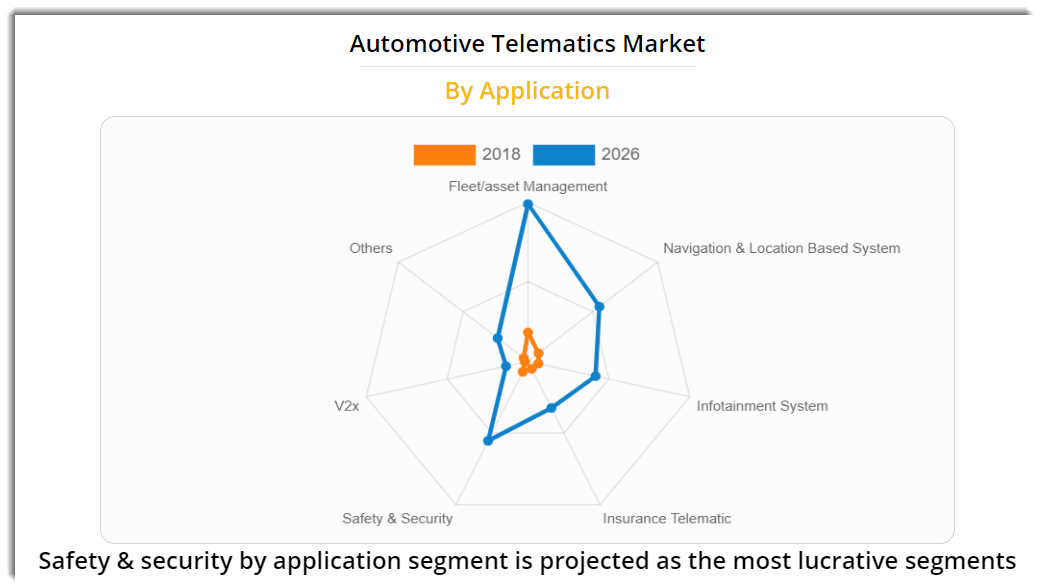
Major competitive or other industry participants include:
-
Verizon Connect
-
WebFleet
-
Trimble (TRMB)
-
Masternaut
-
Fleet Complete
-
Tracker
-
Netstar
-
MiX Telematics
-
Inseego (Ctrack) (INSG)
KARO’s Recent Financial Performance
-
Total revenue by quarter has risen per the chart below:
9 Quarter Total Revenue (Seeking Alpha)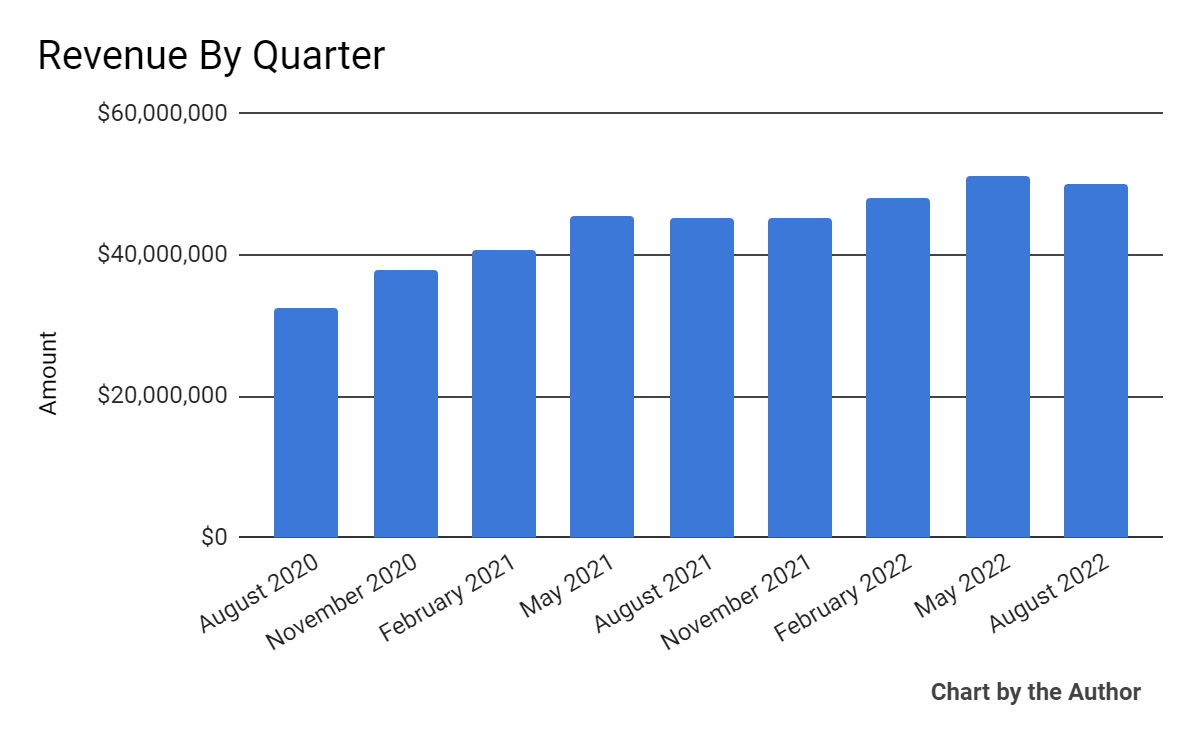
-
Gross profit margin by quarter has trended lower in recent quarters:
9 Quarter Gross Profit Margin (Seeking Alpha)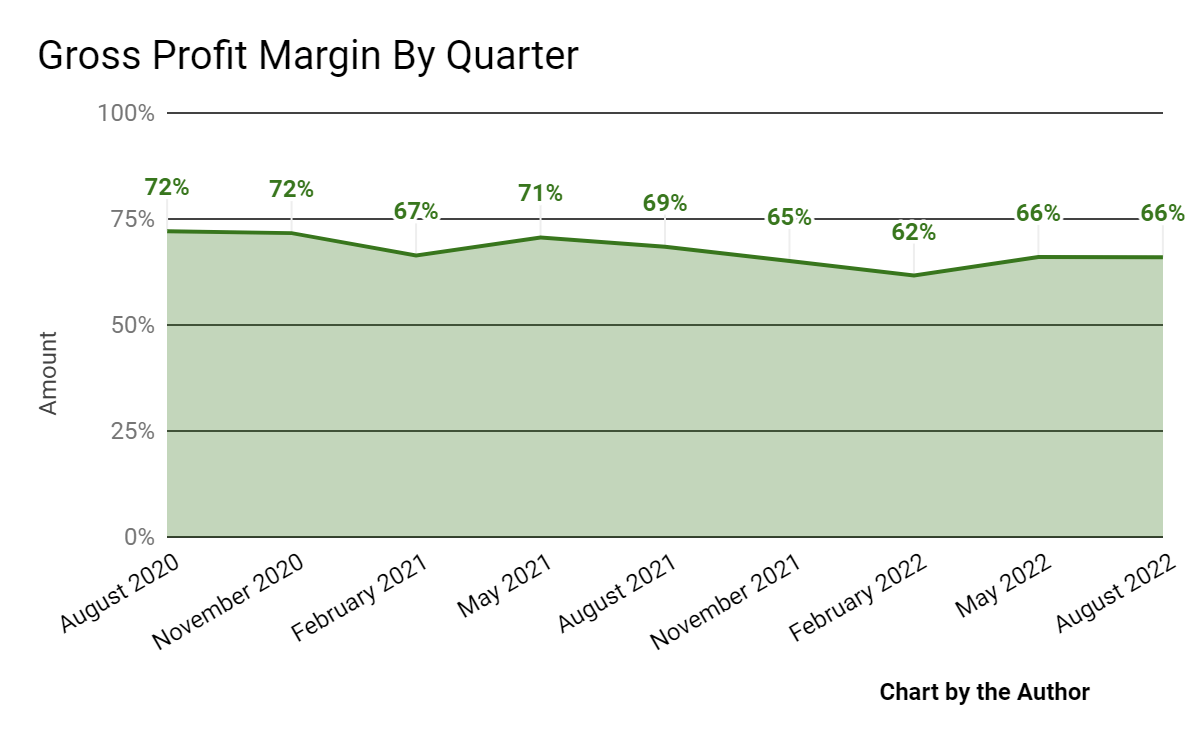
-
Selling, G&A expenses as a percentage of total revenue by quarter have varied per the following chart:
9 Quarter Selling, G&A % Of Revenue (Seeking Alpha)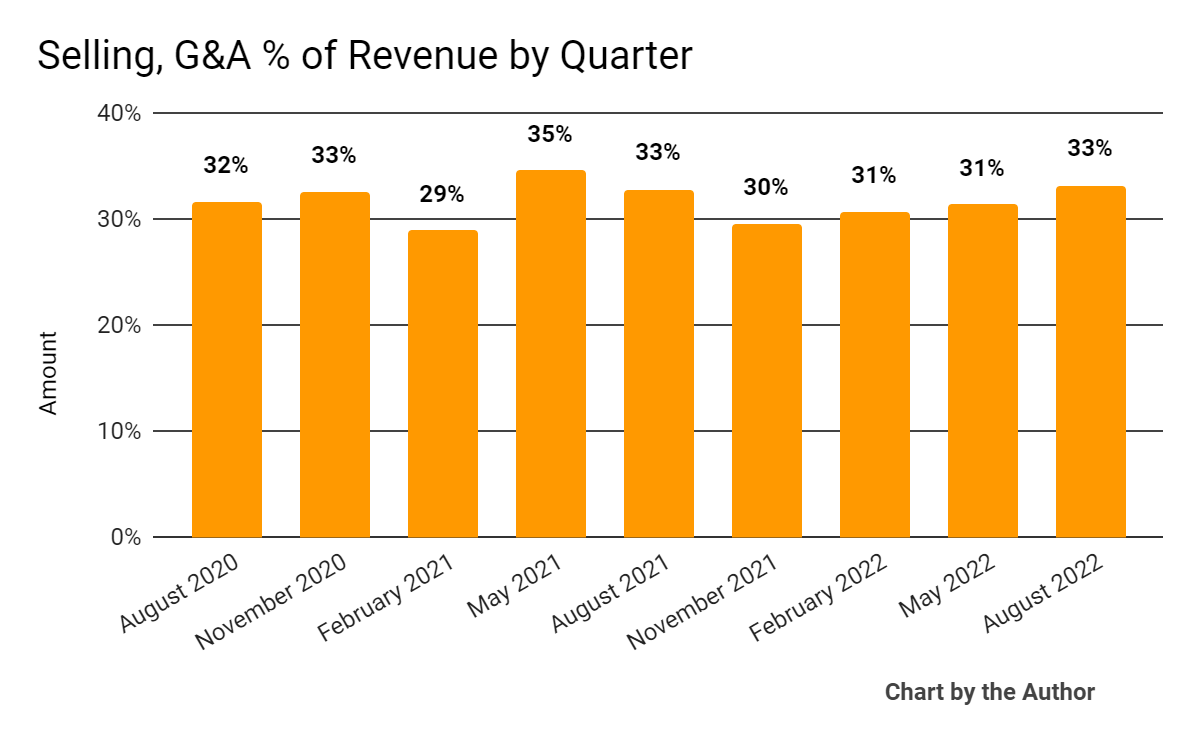
-
Operating income by quarter has trended slightly higher recently:
9 Quarter Operating Income (Seeking Alpha)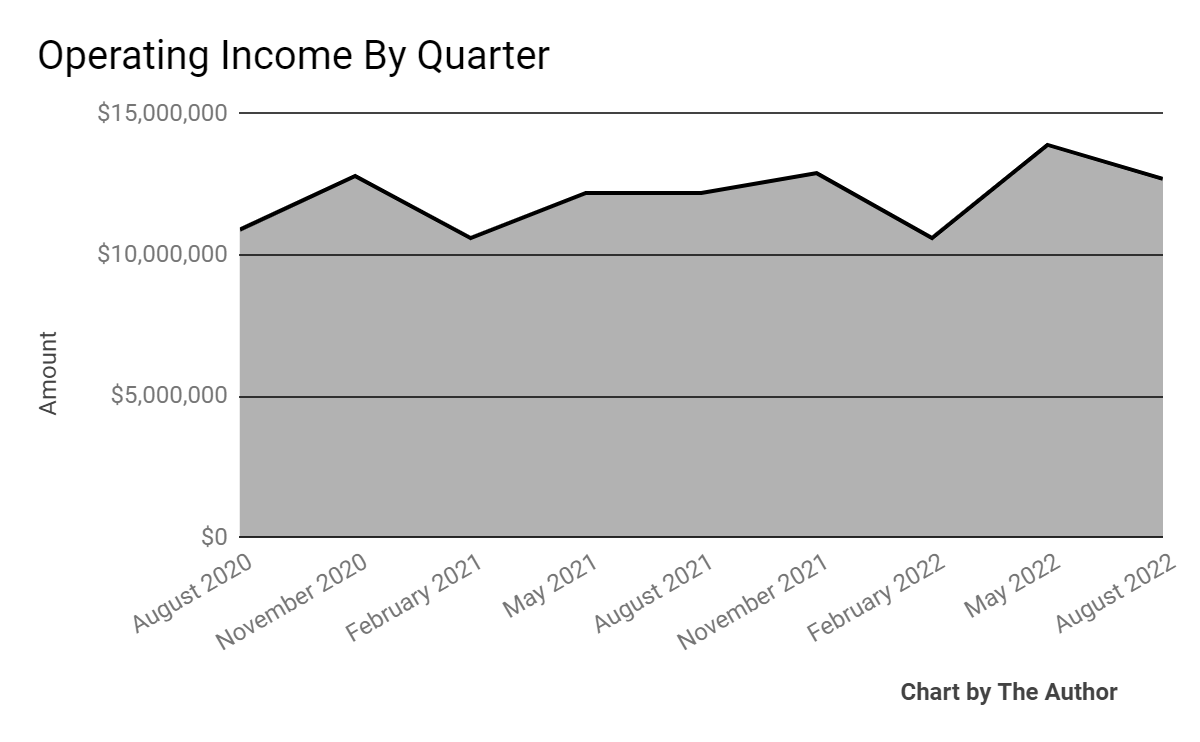
-
Earnings per share (Diluted) have risen in recent periods:
9 Quarter Earnings Per Share (Seeking Alpha)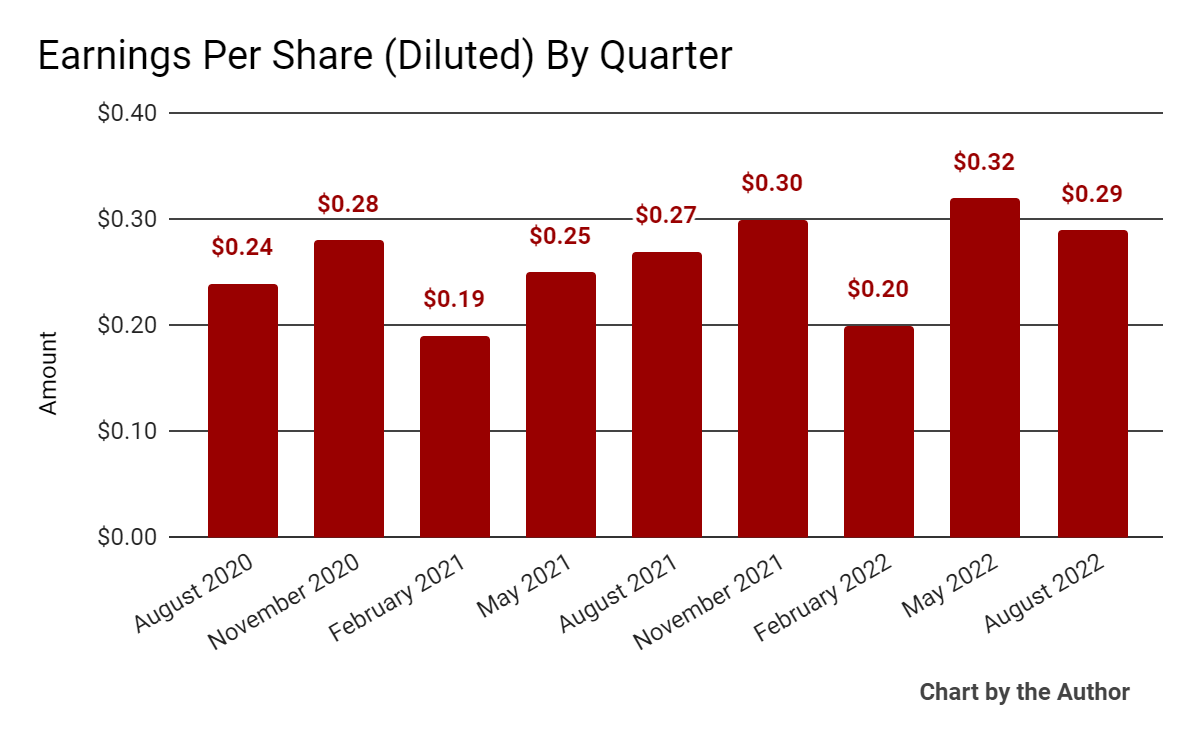
(All data in the above charts is GAAP)
In the past 12 months, KARO’s stock price has dropped 32.7% vs. the U.S. S&P 500 index’s drop of around 13%, as the comparison chart below indicates:
52-Week Stock Price Comparison (Seeking Alpha)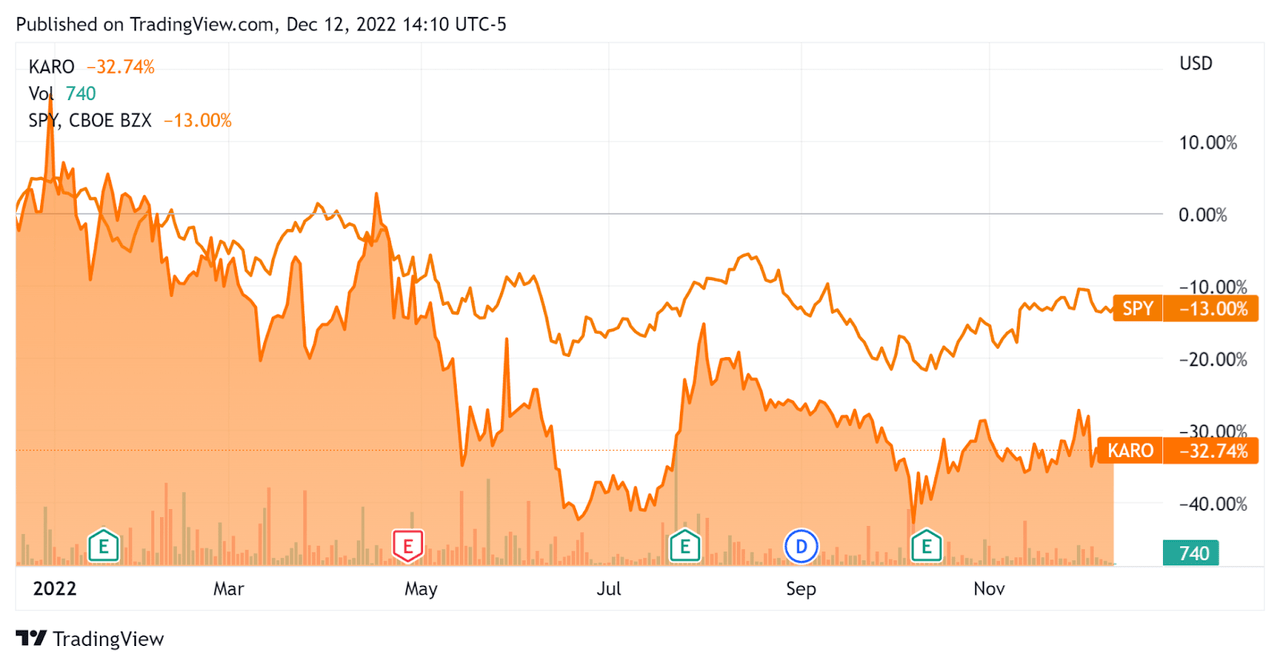
Valuation And Other Metrics For Karooooo
Below is a table of relevant capitalization and valuation figures for the company:
|
Measure [TTM] |
Amount |
|
Enterprise Value / Sales |
3.7 |
|
Enterprise Value / EBITDA |
8.9 |
|
Revenue Growth Rate |
25.4% |
|
Net Income Margin |
17.6% |
|
GAAP EBITDA % |
41.2% |
|
Market Capitalization |
$713,422,980 |
|
Enterprise Value |
$666,638,140 |
|
Operating Cash Flow |
$61,245,168 |
|
Earnings Per Share (Fully Diluted) |
$1.11 |
(Source – Seeking Alpha)
As a reference, a relevant partial public comparable would be MiX Telematics (MIXT); shown below is a comparison of their primary valuation metrics:
|
Metric [TTM] |
MiX Telematics |
Karooooo Ltd. |
Variance |
|
Enterprise Value / Sales |
1.3 |
3.7 |
192.8% |
|
Enterprise Value / EBITDA |
6.7 |
8.9 |
32.5% |
|
Revenue Growth Rate |
2.3% |
25.4% |
1000.0% |
|
Net Income Margin |
2.5% |
17.6% |
597.2% |
|
Operating Cash Flow |
$10,320,000 |
$61,245,168 |
493.5% |
(Source – Seeking Alpha)
A complete comparison of the two companies’ available performance metrics may be viewed here.
The Rule of 40 is a software industry rule of thumb that says that as long as the combined revenue growth rate and EBITDA percentage rate equal or exceed 40%, the firm is on an acceptable growth/EBITDA trajectory.
KARO’s most recent GAAP Rule of 40 calculation was 66.6% as of the end of July, 2022, so the firm has performed well in this regard, per the table below:
|
Rule of 40 – GAAP |
Calculation |
|
Recent Rev. Growth % |
25.4% |
|
GAAP EBITDA % |
41.2% |
|
Total |
66.6% |
(Source – Seeking Alpha)
Commentary On Karooooo
In its last earnings presentation (Source – Karooooo), covering FQ2 2023’s results, management highlighted the large potential for growth of its services in Southeast Asia and Europe, with each region representing greater than 100 million vehicle size opportunities.
As of the end of FQ2, the company reported having more than 95,000 commercial customers and produced a 17% revenue CAGR for the three years ended August 31, 2022.
As to its financial results, total revenue rose 10.8% year-over-year, while gross profit margin dropped 300 basis points over the same period.
The company presentation did not divulge any retention rate metrics, while the firm’s Rule of 40 results have been quite impressive.
SG&A as a percentage of revenue has been rising in recent quarters, while earnings per share have been trending upward recently.
For the balance sheet, the firm finished the quarter with $58.5 million in cash and equivalents and $2.6 million in total debt.
Over the trailing twelve months, free cash flow was $28.9 million, of which capital expenditures accounted for $32.3 million of cash used during the period.
Looking ahead, management indicated that it is seeing strong demand for its services in the Southeast Asia region.
As a result, it will likely be prioritizing resources in that region.
Regarding valuation, the market is valuing KARO at an EV/Sales multiple of around 3.7x.
The SaaS Capital Index of publicly-held SaaS software companies showed an average forward EV/Revenue multiple of around 6.8x at October 31, 2022, as the chart shows here:
SaaS Capital Index (SaaS Capital)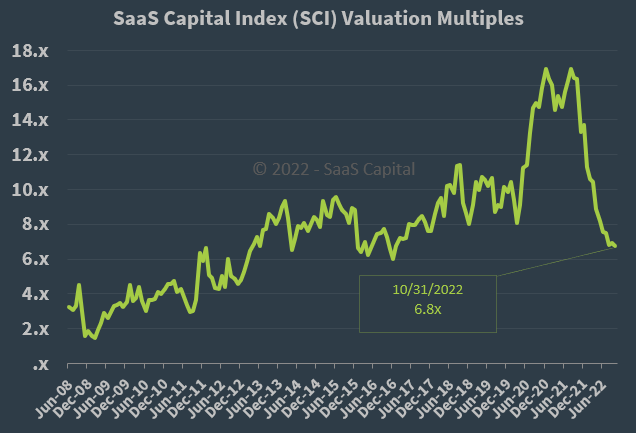
So, by comparison, KARO is currently valued by the market at a discount to the broader SaaS Capital Index, at least as of October 31, 2022.
The primary risk to the company’s outlook is an increasingly likely macroeconomic slowdown or recession, which may produce slower sales cycles overall.
An upside catalyst may be the desire for companies to increase fleet efficiencies, driving them to adopt such solutions more quickly.
I’ve previously been hesitant on KARO at a higher valuation and I still believe the stock may be overvalued in the near term, given slowing economic activity.
As a result, I’m still on Hold for KARO at its current level due to uncertainties in customer decision behavior in the short-term period ahead and worsening gross margins.
Be the first to comment