aeduard
It’s been a rough year for investors in the Gold Miners Index (GDX) and an even tougher two years as the 22-month cyclical bear market has continued much longer than many expected. Fortunately, for K92 Mining (OTCQX:KNTNF) investors, the stock has been somewhat of a sanctuary in this violent bear market, down just ~25% vs. a 50% decline for the GDX. This outperformance can be attributed to the company’s continued operational excellence and a growth rate that allows it to triple annual revenue (FY26 vs. FY22) even in a weaker gold price environment. With K92 Mining now trading at a more reasonable valuation, further weakness should present a buying opportunity.
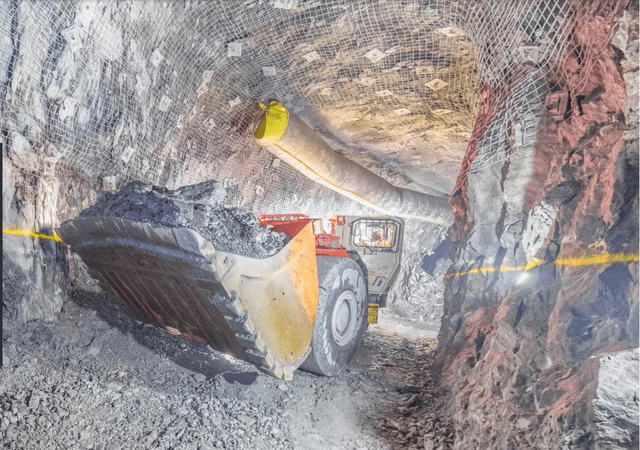
K92 Mining Operations (Company Presentation)
Q3 Production
K92 Mining released its Q3 production results last week, producing ~33,000 gold-equivalent ounces, translating to a 37% increase from the year-ago period. The sharp increase in production was related to a 35% increase in tonnes processed to a new record of ~117,900, offset by a slight dip in grades to 8.7 grams per tonne gold (Q3 2021: 9.0 grams per tonne gold). The significant increase in production was driven by the successful Stage 2 Expansion and the significant outperformance vs. Stage 2 expansion capacity, with an average daily throughput of 1,282 tonnes per day. Year-to-date production now sits at 87,000 GEOs, and with 35,000+ GEOs likely in Q4, K92 will meet FY2022 guidance (115,000 – 140,000 GEOs).
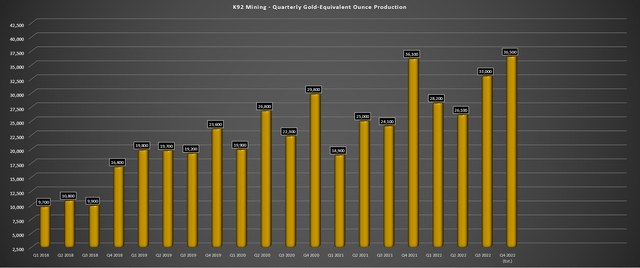
K92 Mining – Quarterly Gold-Equivalent Ounce Production (Company Filings, Author’s Chart)
Notably, while throughput continues to exceed the planned run rate, mine production also continues to hit new highs, with record quarterly mine production of ~122,000 tonnes in Q3, up 37% from the year-ago period. This has allowed the company to build up its largest stockpile since late 2020. Finally, the company also approached new records from a development standpoint, with mine development coming in at 1,880 meters in Q3, up 19% year-over-year and at its second-highest levels to date. The result is that twin inclines (#2 and #3) have been advanced to 1,540 meters and 1,580 meters, respectively, supporting the higher mine throughput needed to fill the growing plant capacity (Stage 3/Stage 4 Expansions).
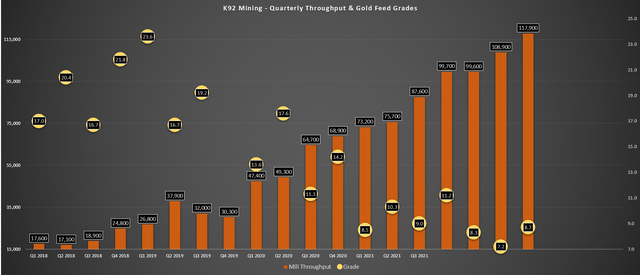
K92 Mining – Quarterly Operating Metrics (Company Filings, Author’s Chart)
Looking at the quarterly operating metrics above, K92 Mining continues to hit new records from a plant throughput standpoint. It’s worth noting that its current average daily throughput rate is approaching its Stage 2A Expansion rate (1,370 tonnes per day) and was within striking distance of this level in September (1,336 tonnes per day) even though the plant upgrades are not yet complete. The company noted that while the new filter press and TC-1000 secondary/tertiary crusher are installed and operational, the company is still working on its flotation expansion which will double rougher capacity and boost metallurgical recoveries, with it set to be commissioned in Q1 2023.
Updated Stage 3 & New Stage 4 Expansion Studies
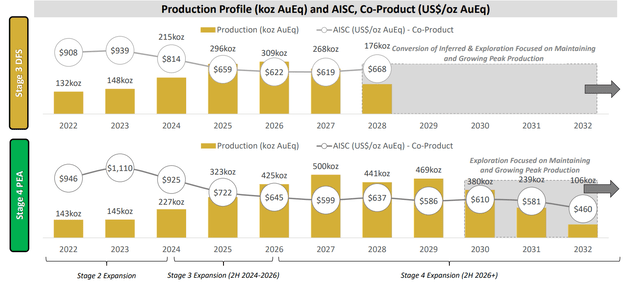
While the operational results were phenomenal, the major news in the quarter was that K92 Mining published a Feasibility Study [FS] for its flagship Kainantu Mine (Stage 3 Expansion plans) and an even larger expansion in a Stage 4 Preliminary Economic Assessment. In the case of the more conservative FS, annual production is expected to average 221,000 GEOs with a 7-year mine life at all-in-sustaining costs of $545/oz. This involves building a new 1.2 million tonne per annum plant and supporting infrastructure. The FS provides a solid base case and is supported by ~1.66 million gold-equivalent ounces in mineral reserves.
K92 Mining – Stage 3 DFS & Stage 4 PEA (Company Presentation)
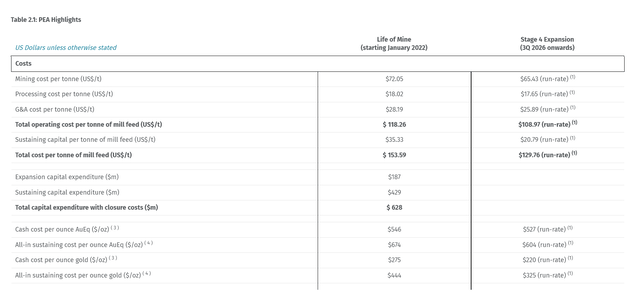
The larger Stage 4 PEA envisions a much larger operation, though it will take slightly longer to complete. The plan is to build the same Stage 3 1.2 million tonne per annum plant as in the FS but then idle the Stage 2A plant as the Stage 3 plant ramps up before re-commissioning the Stage 2A plant in mid-2026 and leveraging its existing infrastructure to allow for two plants to run simultaneously post-2026. The result would be a total processing capacity at the asset of 1.7 million tonnes per annum, with an average production profile beginning in Q4 2026 of ~406,000 GEOs at all-in sustaining costs of $604/oz gold-equivalent, or $325 per ounce of gold.
The negative is that capital costs have increased substantially from $466 million (2020 PEA) to $616 million, with a more conservative estimate being $660+ million due to potential cost overruns. That said, this does incorporate the construction of a slightly larger plant than initially contemplated (1.2 million tonnes per annum vs. 1.0 million tonnes per annum). Meanwhile, operating costs increased from below $95/tonne to $118/tonne despite the economies of scale. Finally, head grades came in a little below my expectations at 7.0 grams per tonne of gold vs. 8.8 grams per tonne of gold in the 2020 PEA.
K92 Mining – Stage 4 PEA (Company News Release)
The result of these changes is that the After-Tax NPV (5%) came in slightly below my estimate despite a higher gold price, with an estimated After-Tax NPV (5%) for the 2022 PEA of $1.3 billion at $1,600/oz gold, $4.00/lb copper and $20.00/oz silver. That said, this is still an incredible project that will be one of the lowest-cost mines globally post-2025. Plus, the growth profile is actually more attractive, with annual GEO production increasing to 309,000 GEOs over the next decade vs. a previous outlook of ~260,000 GEOs. Besides, I think this PEA still understates this asset’s true potential, Judd and Kora continuing to over-deliver from an exploration standpoint and being open in multiple directions.
To summarize, while the cost increases aren’t ideal, this was largely expected due to inflationary pressures over the past two years and the slight change in scope. The important part, though, is that K92 Mining can still self-fund the asset with $120+ million in cash and consistent free-cash-flow generation, and the company continues to boast a top-3 growth profile industry-wide and is set to graduate to the ranks of only a handful of producers with sub $600/oz all-in sustaining costs. These include Fosterville, Macassa, Cadia, Skouries (if built), Red Chris, Island Gold, Ho Maden, and a few others. However, these are assets held by mid-tiers or majors, placing K92 in rare air being the proud owner of one of these ultra-low-cost assets. Let’s look at the valuation:
Valuation & Technical Picture
Based on ~242 million fully diluted shares at year-end and a share price of US$5.00, K92 Mining trades at a market cap of ~$1.21 billion and an enterprise value of ~$1.09 billion. If we compare this to an updated estimated net asset value of ~$1.70 billion ($1,700/oz gold price assumption + exploration upside), this leaves K92 Mining trading at 0.71x P/NAV, a slight premium to its peer group, which is mostly justified due to its industry-leading growth and margin profile. That said, the updated NPV (5%) came in slightly lower than I anticipated, mostly due to higher capital expenditures and slightly lower grades, with fair value dropping from US$8.30 to $7.00.
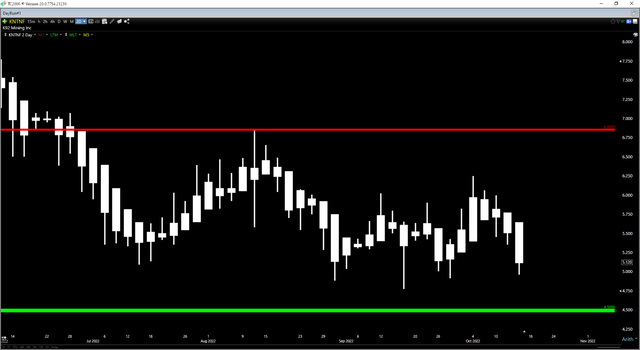
Given that I prefer a minimum 30% discount to fair value to justify buying single-asset producers (especially those in non-Tier-1 jurisdictions), the updated buy zone for the stock has slid to US$4.90 or lower. From a technical standpoint, this lines up near where the stock has found support over the past two years, near US$4.50. So, if we see further weakness in the stock before year-end, the US$4.50 – US$4.90 zone would be a relatively low-risk area to start an initial position. Given that K92 Mining benefits from industry-leading margins, the ability to self-fund its growth, and a triple-digit growth profile, I continue to see the stock as a top-12 producer.
KNTNF Daily Chart (TC2000.com)
Summary
K92 Mining had another solid quarter operationally in Q3 and remains on track to meet its FY2022 guidance of 115,000 to 140,000 GEOs. If we look ahead to FY2022, the company should be able to produce upwards of 145,000 GEOs, helping the buck to buck the trend of lower sales/cash flow that we’ll see sector-wide if the gold price remains below $1,775/oz. However, the real differentiator is that it’s one of only a handful of junior producers with 400,000-ounce per annum potential long-term, benefiting from costs more than 50% below the industry average ($1,250/oz). So, if we see further weakness in the stock, I would view this as a buying opportunity.


Be the first to comment