

pepifoto
This article series aims at evaluating ETFs (exchange-traded funds) regarding past performance and portfolio metrics. Reviews with updated data are posted when necessary.
JQUA strategy
JPMorgan U.S. Quality Factor ETF (NYSEARCA:JQUA) has been tracking the JP MorganUS Quality Factor Index since 11/08/2017. It has 259 holdings, a 30-day SEC yield of 1.30% and an expense ratio of 0.12%. Distributions are paid quarterly.
As described in the prospectus by JPMorgan, the underlying index selects equities in the Russell 1000 Index based on a rules-based methodology featuring “a quality factor to identify higher quality companies as measured by profitability, quality of earnings, and solvency.” Additionally, the weighting process is designed to ensure diversification. The portfolio turnover rate in the most recent fiscal year was 21%. This article will use as a benchmark the parent index Russell 1000, represented by iShares Russell 1000 ETF (IWB).
Portfolio
The fund invests almost exclusively in U.S. companies (over 99% of asset value), mostly in large and mega caps (about 65%). The portfolio is overweight in information technology and communication services (36.7% of assets). Other sectors weigh less than 15%. The sector breakdown is not much different from the benchmark, although JQUA moderately overweights consumer discretionary and industrials.
Sector breakdown (Chart: author; data: JPMorgan, iShares)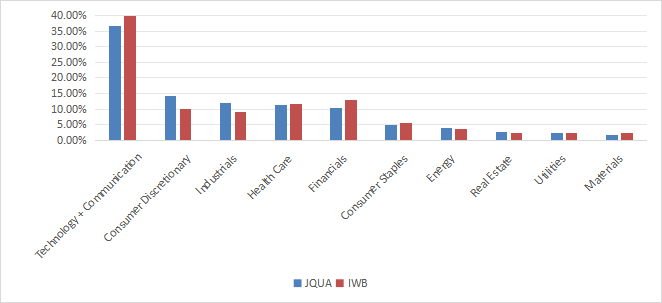
The top 10 holdings, listed below, represent 21.8% of asset value, and the heaviest one weighs about 3%. The fund is well-diversified across holdings and risks related to individual companies are low, but keep in mind it is overweight in technology.
|
Ticker |
Name |
Weight% |
EPS growth %TTM |
P/E TTM |
P/E fwd |
Yield% |
|
NVIDIA Corp. |
3.01% |
788.51 |
74.04 |
46.90 |
0.03 |
|
|
Meta Platforms, Inc. |
2.59% |
115.95 |
28.42 |
24.48 |
0.40 |
|
|
Alphabet, Inc. |
2.56% |
45.00 |
27.55 |
23.80 |
0.45 |
|
|
Broadcom Inc. |
2.32% |
-26.54 |
71.36 |
34.76 |
1.27 |
|
|
Apple, Inc. |
2.26% |
9.26 |
32.27 |
31.45 |
0.48 |
|
|
Microsoft Corp. |
2.09% |
25.11 |
38.97 |
38.10 |
0.67 |
|
|
Berkshire Hathaway |
1.90% |
876.68 |
12.09 |
21.58 |
0 |
|
|
Visa, Inc. |
1.82% |
19.92 |
31.25 |
27.67 |
0.76 |
|
|
Costco Wholesale Corp. |
1.63% |
19.53 |
52.58 |
52.47 |
0.55 |
|
|
Mastercard, Inc. |
1.59% |
25.70 |
36.15 |
31.84 |
0.58 |
Fundamentals
JQUA is close to its parent index regarding valuation ratios and growth metrics, as reported in the next table. The cash flow growth rate is significantly higher, though.
|
JQUA |
IWB |
|
|
P/E TTM |
24.7 |
25.18 |
|
Price/Book |
5.43 |
4.26 |
|
Price/Sales |
3.16 |
2.75 |
|
Price/Cash Flow |
16.59 |
17.11 |
|
Earnings growth |
22.21% |
22.31% |
|
Sales growth % |
8.97% |
8.64% |
|
Cash flow growth % |
12.28% |
8.49% |
Data source: Fidelity
In my ETF reviews, risky stocks are companies with at least 2 red flags among: bad Piotroski score, negative ROA, unsustainable payout ratio, bad or dubious Altman Z-score, excluding financials and real estate where these metrics are unreliable. With this assumption, risky stocks weigh 8.3% of asset value, which is acceptable, but not so good for a quality-focused ETF. However, based on my calculation of aggregate quality metrics (reported in the next table), portfolio quality is significantly superior to the large cap benchmark.
|
JQUA |
IWB |
|
|
Altman Z-score |
8.89 |
3.75 |
|
Piotroski F-score |
6.36 |
5.89 |
|
ROA % TTM |
13.87 |
6.26 |
Performance
Since 11/15/2017, JQUA has underperformed its parent index by 60 bps in annualized return, as reported in the next table. It shows a lower volatility, resulting in a marginally higher Sharpe ratio (a measure of risk-adjusted performance).
|
Total Return |
Annual Return |
Drawdown |
Sharpe ratio |
Volatility |
|
|
JQUA |
123.35% |
12.93% |
-32.92% |
0.67 |
16.35% |
|
IWB |
131.76% |
13.57% |
-34.60% |
0.64 |
17.97% |
JQUA has been more resilient than IWB in the 2022 correction, and it is leading by a 7.6% margin over the last three years.
JQUA vs IWB, 3-year return (Seeking Alpha)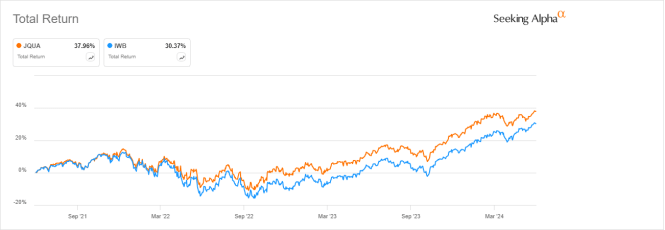
Competitors
The next table compares characteristics of JQUA and four of the most popular quality ETFs:
- iShares MSCI USA Quality Factor ETF (QUAL),
- Invesco S&P 500 Quality ETF (SPHQ),
- Vanguard U.S. Quality Factor ETF (VFQY), recently reviewed here
- Fidelity Quality Factor ETF (FQAL)
|
JQUA |
QUAL |
SPHQ |
VFQY |
FQAL |
|
|
Inception |
11/8/2017 |
7/16/2013 |
12/6/2005 |
2/13/2018 |
9/12/2016 |
|
Expense Ratio |
0.12% |
0.15% |
0.15% |
0.13% |
0.15% |
|
AUM |
$4.34B |
$46.61B |
$13.03B |
$338.12M |
$1.07B |
JQUA has the lowest expense ratio (by a short margin) and it is ranked #3 in size (assets under management). The next chart plots total returns, starting on 2/19/2018 to match all inception dates. JQUA is among the 3 best performers, shortly behind SPHQ and QUAL. It was leading the pack a few months ago.
JQUA vs competitors, since 2/19/2018 (Seeking Alpha)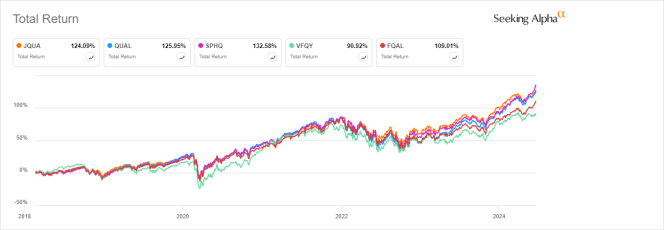
Takeaway
JPMorgan U.S. Quality Factor ETF holds over 200 Russell 1000 stocks with quality characteristics based on profitability, earnings quality and financial risk. JQUA is overweight in technology, but well-diversified across holdings. My own metrics confirm the high quality of the portfolio. Exposure to risky stocks is relatively high for a quality-style ETF, though. Historical performance is quite good compared to competitors, but average relative to the parent index Russell 1000. However, JQUA price history is quite short and mostly covers a strong bull market with a few deep corrections. JQUA may temper drawdowns in market downturns, like in 2022.
Be the first to comment