

jetcityimage
JPMorgan Chase & Co. (NYSE:JPM) is a leading bank within the U.S. for commercial and retail customers. While technical analysis shows how currently stock prices rallying, there is an expected pullback on price. Fundamentals suggest conservative growth over the coming years, which will positively impact the JPM stock price. Also, certain JPM executives have been selling their employer’s stock, indicating lower temporary pullbacks.
JPM Fundamentals are subdued
Growth
JPMorgan has had weak growth since 2017. However, it has been flat or even much weaker year-over-year between 2020 and 2021.
|
Unnamed: 0 |
2017 |
2018 |
2019 |
2020 |
2021 |
|
Period |
FY |
FY |
FY |
FY |
FY |
|
Revenue growth |
0.035 |
0.102 |
0.061 |
0.033 |
0.018 |
|
Net income growth |
-0.012 |
0.329 |
0.122 |
-0.200 |
0.659 |
Source: Financial Modelling Prep
Data
Simple moving average periods of 200 days are decent, considering many other extensive profile companies have been negative. However, a comparatively weaker 20-day SMA performance would be considered intermediate at best.
|
Unnamed: 0 |
Values |
|
SMA20 |
4.68% |
|
SMA50 |
12.93% |
|
SMA200 |
6.91% |
Source: FinViz
Enterprise
The enterprise level has been relatively conservative for this bank, where market cap growth has grown roughly 10% while stock performance has had some measurement of growth by nearly 25%.
|
Unnamed: 0 |
2017 |
2018 |
2019 |
2020 |
2021 |
|
Symbol |
JPM |
JPM |
JPM |
JPM |
JPM |
|
Stock price |
115.110 |
104.410 |
135.890 |
128.670 |
146.610 |
|
Number of shares |
3.552 B |
3.396 B |
3.221 B |
3.082 B |
3.022 B |
|
Market capitalization |
408.825 B |
354.618 B |
437.770 B |
396.612 B |
442.982 B |
|
Add total debt |
335.882 B |
351.307 B |
332.418 B |
326.893 B |
354.599 B |
|
Minus cash and cash equivalents |
430.121 B |
278.793 B |
263.631 B |
527.609 B |
740.834 B |
|
Enterprise value |
314.586 B |
427.132 B |
506.557 B |
195.896 B |
56.747 B |
Source: Financial Modelling Prep
Estimate
Over the next three years, JPMorgan has set a very conservative growth path of 20% with a predicted flat performance in its stock. Net profit appears to be in line consistently over this time. As a result, do not expect superior growth in JPMorgan’s stock price.
|
YEARLY ESTIMATES |
2022 |
2023 |
2024 |
2025 |
|
Revenue |
128,780 |
140,212 |
143,174 |
150,482 |
|
Dividend |
4.01 |
4.18 |
4.50 |
4.66 |
|
Dividend Yield (in %) |
3.02 % |
3.14 % |
3.39 % |
3.51 % |
|
EPS |
11.50 |
12.82 |
13.66 |
14.70 |
|
P/E Ratio |
11.55 |
10.36 |
9.72 |
9.04 |
|
EBIT |
50,977 |
57,252 |
58,517 |
66,006 |
|
EBITDA |
– |
– |
– |
– |
|
Net Profit |
34,873 |
38,114 |
39,735 |
41,657 |
Source: BusinessInsider.
Technical Analysis shows a coming pull after the quick rally
Fibonacci
One positive aspect of looking at this chart, the most recent stock price activity growth is shockingly strong. It is only a matter of time before confirmed entries can occur once the stock price crosses the trend line. However one can determine how fast the stock price grew last year, there’s also a reason for how steep the decline was. As the current stock price does rise with a strong slope, one is likely to see this continue once it crosses the Fibonacci trendline.
fibnonacci jpm (custom platform)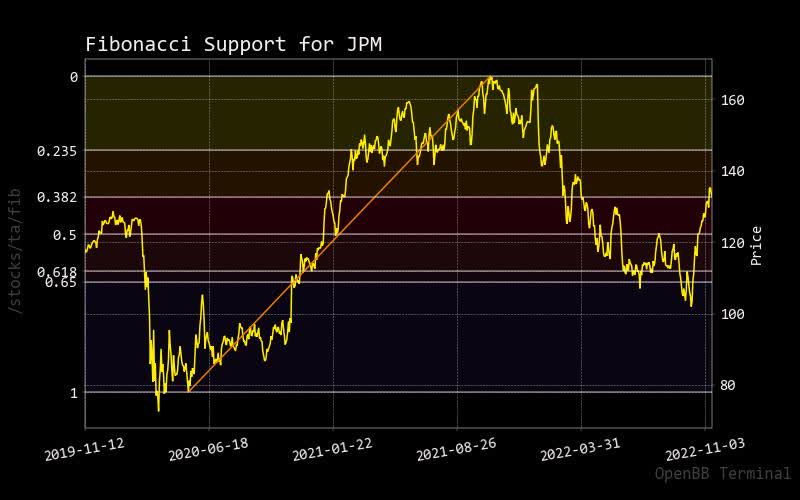
MACD
MACD chart shows that the stock price of JPMorgan has remained stable, as one might think. However, as hinted in the RSI, one needs to moderate expectations if they want to accumulate stock with the understanding that there could be a quick pullback in price.
macd jpm (custom platform)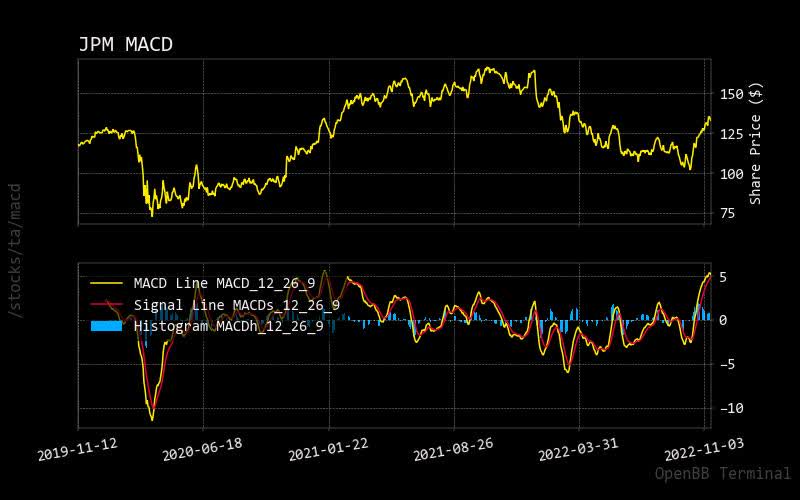
RSI
As there has been strong momentum in the stock price of JPMorgan, one needs to be concerned as it already has broken through the overbought market condition of the relative strength indicator. Therefore, one can expect quick pullbacks compared to other events like this in 2020.
rsi jpm (custom platform )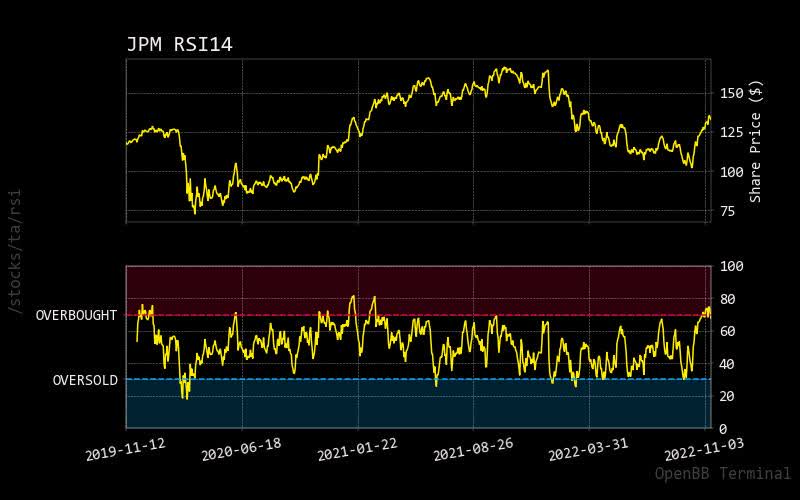
Prediction via AI
Monte Carlo
As high momentum builds in the stock price of JPMorgan, the predictive paths show the probability of stock price growth. This can also be shown in the normalized distribution, but price expectation for pullbacks is not revealed here.
montecarlo jpm (custom platform)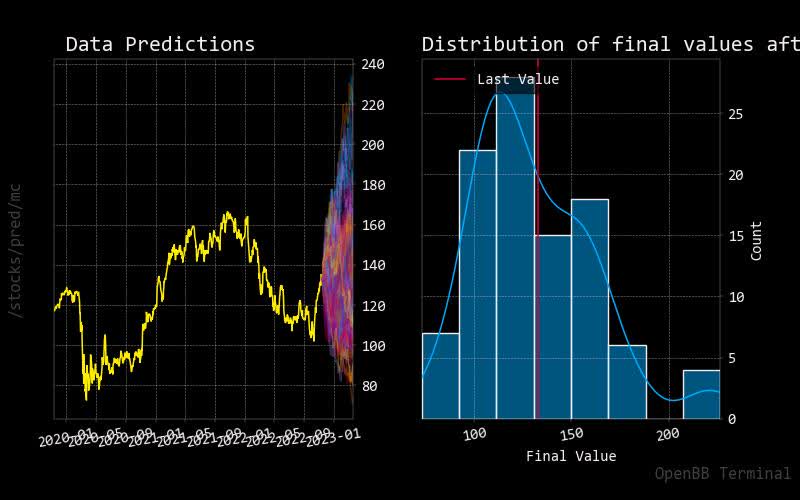
Regression
As one can see in this 30-day forecast in the red regression line, the momentum of the stock price for JPMorgan seems to moderate somewhat. This can be confirmed by those who will expect the pullback based on the current condition of the RSI.
regression jpm (custom platform )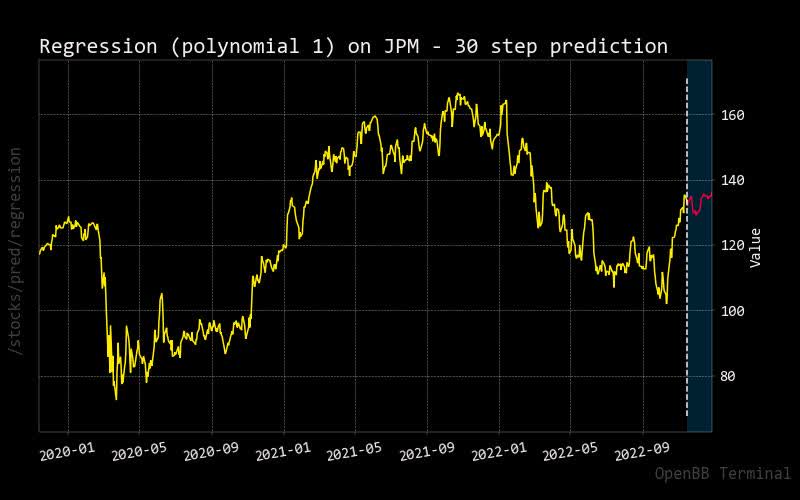
Risk Shows Uncertain Future Growth Story
Price vs. Short Volume
Short trading volume has been somewhat stable over the years compared to the overall trading volume for JPMorgan. As a result, only a few investors anticipate the need to short or take advantage of it, while there might be an expectation for a pullback based on the RSI.
short jpm (custom platform)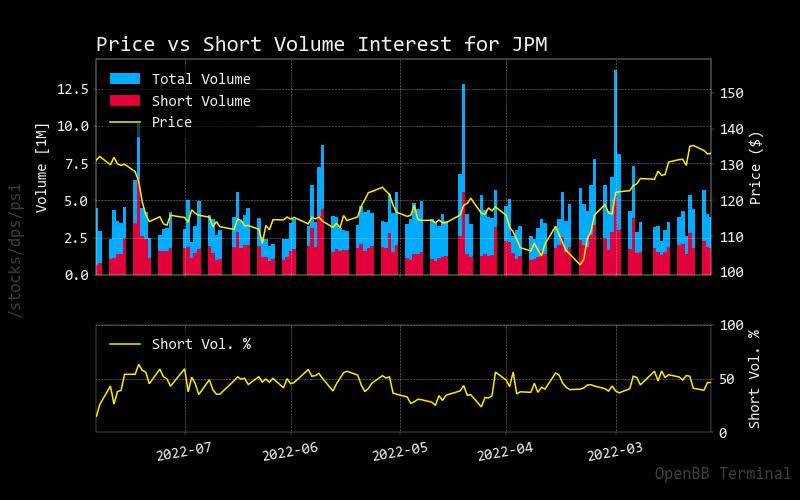
Source: StockGrid.
Insider Stats
With the amount of confirmed selling by JPMorgan executives, they expect stock price pullback, so they start taking profit now while they can. Also, based on their forecasted guidance, it is no wonder they think the stock price may not have long-term momentum.
|
Unnamed: 0 |
X |
Filing Date |
Trading Date |
Ticker |
Insider |
Title |
Trade Type |
Price |
Quantity |
Owned |
Delta Own |
Value |
|
0 |
nan |
2022-11-14 16:22:49 |
2022-11-10 |
JPM |
Petno Douglas B |
CEO Commercial Banking |
S – Sale |
$135.01 |
-5,139 |
396,548 |
-1% |
-$693,831 |
|
1 |
nan |
2022-11-14 16hope |
2022-11-10 |
JPM |
Scher Peter |
Vice COB |
S – Sale |
$133.02 |
.-1,311 |
33,662 |
-4% |
-$174,392 |
|
2 |
nan |
2022-10-27 17:00:50 |
2022-10-26 |
JPM |
Scher Peter |
Vice COB |
S – Sale |
$125.02 |
-1,310 |
34,973 |
-4% |
-$163,773 |
|
3 |
nan |
2022-10-27 16:59:40 |
2022-10-26 |
JPM |
Petno Douglas B |
CEO Commercial Banking |
S – Sale |
$125.02 |
-5,139 |
403,197 |
-1% |
-$642,456 |
|
4 |
nan |
2022-10-27 16:58:32 |
2022-10-26 |
JPM |
Leopold Robin |
Head of HR |
S – Sale |
$125.07 |
-2,000 |
39,547 |
-5% |
-$250,144 |
|
5 |
nan |
2022-10-19 16:17:45 |
2022-10-18 |
JPM |
Petno Douglas B |
CEO Commercial Banking |
S – Sale |
$120.05 |
-5,140 |
408,336 |
-1% |
-$617,055 |
|
6 |
nan |
2022-10-18 16:24:36 |
2022-10-17 |
JPM |
Erdoes Mary E. |
CEO Asset, Wealth Management |
S – Sale |
$115.77 |
-33,515 |
533,795 |
-6% |
-$3,880,135 |
Source: Open Insider.
Insider Activity
|
Date |
Shares Traded |
Shares Held |
Price |
Type |
Option |
Insider |
Trade |
|
2022-09-29 |
311.00 |
50,469.59 |
104.5 |
Buy |
No |
Korablina Elena A |
311.0 |
|
2022-09-29 |
311.00 |
4,872.66 |
104.5 |
Buy |
No |
Korablina Elena A |
311.0 |
|
2022-09-29 |
299.04 |
6,155.79 |
104.5 |
Buy |
No |
Korina Elena A |
299.04 |
|
2022-10-16 |
104,603.00 |
706,450.00 |
46.58 |
Buy |
No |
Korablina Elena A |
104603.0 |
|
2022-10-16 |
81,793.00 |
624,657.00 |
115.67 |
Sell |
No |
Petno Douglas B |
-81793.0 |
|
2022-10-16 |
33,515.00 |
533,795.00 |
115.77 |
Sell |
No |
Erdoes Mary E. |
-33515.0 |
|
2022-10-17 |
5,140.00 |
253,150.00 |
120.05 |
Sell |
No |
Pinto Daniel E |
-5140.0 |
|
2022-10-24 |
881.00 |
19,892.00 |
nan |
Buy |
No |
Pinto Daniel E |
881.0 |
|
2022-10-24 |
825.00 |
20,717.00 |
nan |
Buy |
No |
Rometty Virginia M |
825.0 |
|
2022-10-24 |
499.00 |
20,218.00 |
122.08 |
Sell |
No |
NOVAKOVIC PHEBE N |
-499.0 |
|
2022-10-24 |
500.00 |
19,718.00 |
122.08 |
Sell |
No |
NEAL MICHAEL A |
-500.0 |
|
2022-10-25 |
1,310.00 |
34,973.00 |
125.02 |
Sell |
No |
BURKE STEPHEN B |
-1310.0 |
|
2022-10-25 |
5,139.00 |
248,011.00 |
125.02 |
Sell |
No |
HOBSON MELLODY L |
-5139.0 |
|
2022-10-25 |
2,000.00 |
19,031.00 |
125.07 |
Sell |
No |
FLYNN TIMOTHY PATRICK |
-2000.0 |
|
2022-11-08 |
176,091.00 |
695,675.00 |
nan |
Sell |
No |
HOBSON MELLODY L |
-176091.0 |
|
2022-11-09 |
1,311.00 |
33,662.00 |
133.02 |
Sell |
No |
FLYNN TIMOTHY PATRICK |
-1311.0 |
|
2022-11-09 |
5,139.00 |
242,872.00 |
135.01 |
Sell |
No |
BURKE STEPHEN B |
-5139.0 |
|
2022-11-13 |
1,510.00 |
241,362.00 |
nan |
Sell |
No |
Rometty Virginia M |
-1510.0 |
Source: Business Insider.
Sustainability
JPMorgan shows a sustainability rating of average performance but will need to be worked upon to show authentic leadership in its industry.
|
Unnamed: 0 |
Value |
|
Social score |
16.18 |
|
Peer count |
172 |
|
Governance score |
11.73 |
|
Total esg |
29.02 |
|
Highest controversy |
3 |
|
ESG performance |
AVG_PERF |
|
Percentile |
59.52 |
|
Environment score |
1.11 |
Source: Yahoo Finance.
Recommendation
Based on the most recent stock performance, I agree on future growth over the next few months. This performance should continue over the years, but as said, expect moderate growth.
|
Interval |
RECOMMENDATION |
BUY |
SELL |
NEUTRAL |
|
One month |
NEUTRAL |
10 |
7 |
9 |
|
One week |
BUY |
13 |
3 |
10 |
|
One day |
BUY |
11 |
5 |
10 |
Source: Trading View.
Price Target
Market analysts that have set price targets are for JPMorgan stock price. One positive aspect currently is how the stock price of JPMorgan has met the most recent market analyst target level.
target jpm (custom plafform)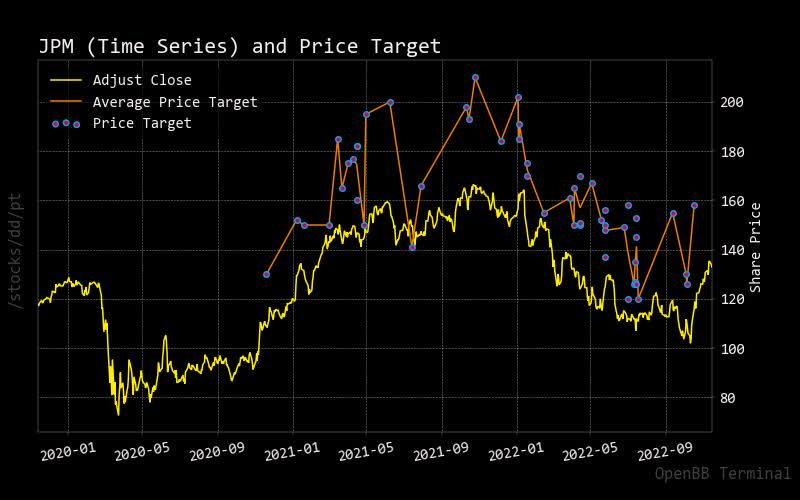
Source: BusinessInsider.
Conclusion
As the stock price for JPMorgan has been relatively quick, as shown via the RSI, it is anticipated to have a temporary pullback. Over the long run for this bank, the stock price should continue to add a moderated level over the long run. Based on JPMorgan’s projected revenue over the next few years, the stock price will likely be muted concerning the subdued expectation. Despite a potential long-term recession, it might be wise to accumulate this bank stock, as JPMorgan Chase & Co. has shown to be profitable in the challenging year of 2022.
Be the first to comment