

Chris Hondros
Introduction
According to CNBC, a little over a month ago, JPMorgan Chase (NYSE:JPM) CEO Jamie Dimon told an audience of investors:
“You know, I said there’s storm clouds but I’m going to change it … it’s a hurricane,” Dimon said Wednesday at a financial conference in New York. While conditions seem “fine” at the moment, nobody knows if the hurricane is “a minor one or Superstorm Sandy,” he added.
“You’d better brace yourself,” Dimon told the roomful of analysts and investors. “JPMorgan is bracing ourselves and we’re going to be very conservative with our balance sheet.”
On the one hand, the good news is that Dimon is aware of the near-term dangers and is taking precautions. On the other hand, that doesn’t mean JPMorgan’s stock price will not suffer a significant drawdown, anyway. And, it’s still unclear just how big the “hurricane” will be.
Out of the 400+ articles I’ve written for Seeking Alpha, I have never written an article about JPMorgan Chase. Part of that has to do with the fact that the price for the stock always seems to come right down to my buy prices and stop short, before rising. That happened both in the 2018 drawdown and in the March 2020 drawdown. I did buy several other banks during the March 2020 drawdown, though, and most of them produced 100% returns or better. Several of them were smaller mid-cap stocks so I didn’t write about them publicly, but I did write about both my purchases and my sale of U.S. Bancorp (USB) and PNC (PNC) publicly. I bought both of these stocks during the March 2020 crash and sold them in December 2020 and January 2021. I wrote about the sale of USB in my article “Why I Recently Took Profits in U.S. Bancorp” in mid-January of this year. The reason I’m sharing this is that if I had owned JPM or many other financial stocks, I would have taken profits around that time as well. In fact, that same month I wrote about “6 Financial Stocks I Recently Sold and Two I Will Hold For The Long Term“. Those two articles really share the overall spirit both of where I stood on the market and economy at the time, but also how I felt about deep cyclical banks like U.S. Bancorp and JPM, as well.
I am very much aware of the differences between JPM and some of the other banks and financial stocks I sold back then, but the differences, in this case, are not nearly as important as the similarities when it comes to historical price patterns and historical earnings cyclicality.
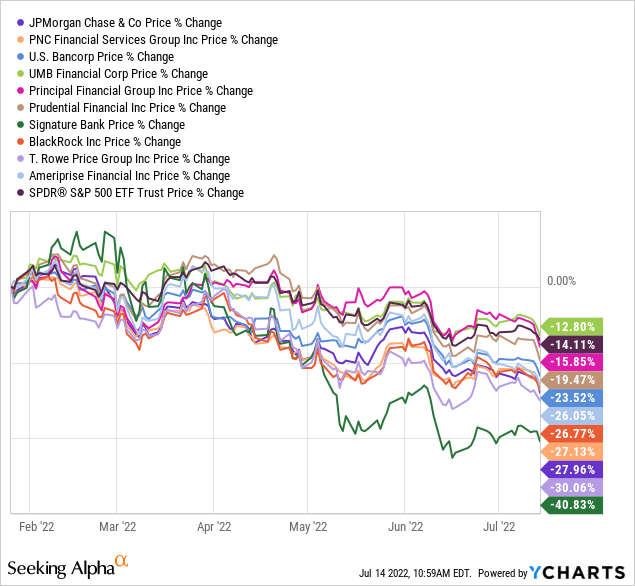
JPM, and all of the stocks I warned about in those January articles (including the two I held on to despite knowing the risk) are negative, and most are in a bear market. The S&P 500 is down about -14% during this time, so most are underperforming the market as well since my January 26th article.
The average return on the stocks I sold in January was about +111% in less than 2 years, so I did very well on this group as a whole, and I’m glad I took profits in all of them I owned except BlackRock (BLK) and Signature Bank (SBNY), which I decided to keep even though I was aware of the downside risk.
The ultimate point I’m getting at here is that if investors are patient, and demand very good prices for the banks and financial stocks they buy, and if they limit themselves to only the highest quality ones, they can produce very good returns. That said, my base case for the next upcycle (when it eventually comes) is to probably take approximately 5 years to fully recover instead of 2 years as it did recently, but a 100% return on average in 5 years is really good, too. And if it ended up taking 7 years to return 100%, that’s still a 10.41% CAGR, and it certainly wouldn’t be the end of the world.
So, even though I haven’t covered JPM in the past or owned it before, I do have a good track record of both buying financial stocks and banks at good prices, and also taking profits in most of them at good prices as well. In this article, I am going to share my deep cycle approach to buying stocks like JPM and USB, and I’ll share the price I’m aiming to buy JPM at should it fall that far.
Step 1: Determine the Cyclicality of Earnings
FAST Graphs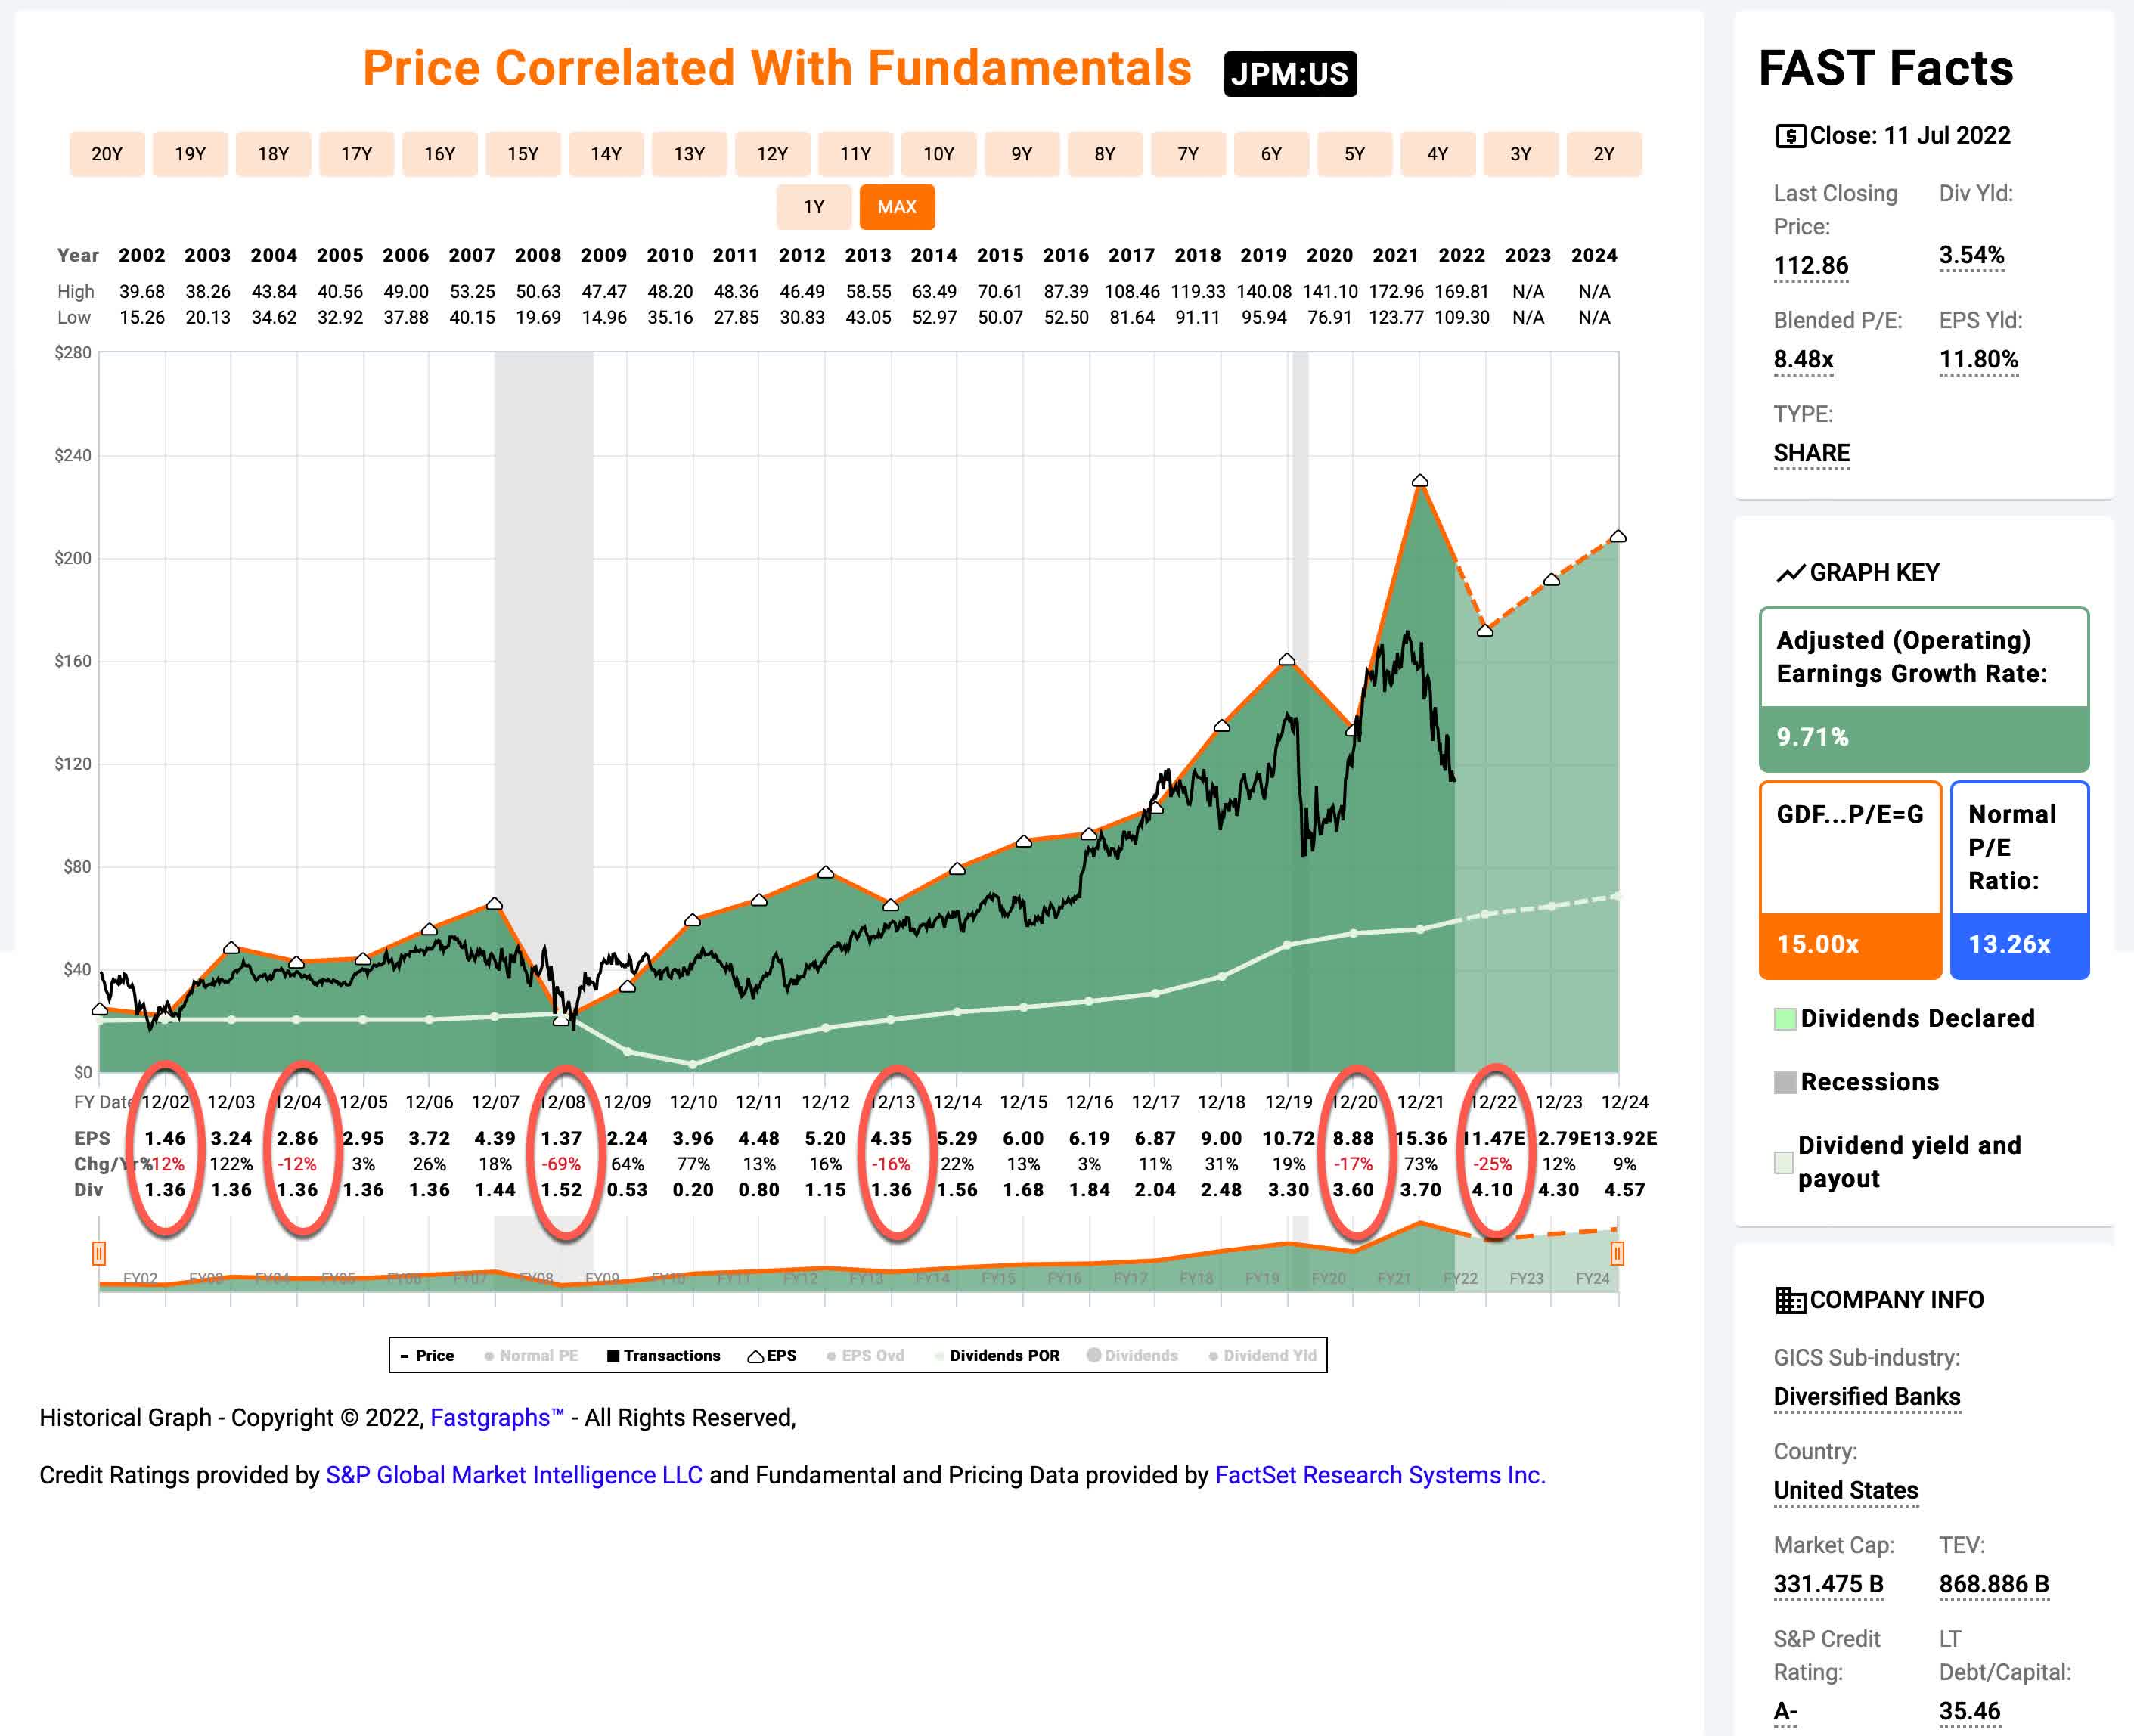
The main question I want to answer with the F.A.S.T. Graph above is how cyclical JPMorgan Chase’s earnings have been historically because that will determine what sort of analysis I perform on the stock. The dark green shaded area on the graph represents their adjusted operating earnings, and we see six annual drawdowns in earnings growth on the chart if we included this year’s estimated -25% decline in earnings growth (which is likely to be deeper in reality after they disappointed on earnings this quarter). The rough earnings growth decline threshold I use to declare a business either “deep cyclical” or “less-cyclical” is -50%. This level can actually vary quite a lot from bank to bank, depending on what kind of bank it is and their loan practices or whether they are an investment bank or a traditional bank. In the end, all I care about are their historical earnings patterns. In JPM’s case, because of the -69% decline in earnings growth in 2008, combined with various other years of double-digit earnings growth declines, I would classify JPM stock as a “deep cyclical” stock. (Contrast this with PNC, a less-cyclical bank, whose earnings growth only declined -27% in 2008, and we can see the difference.)
Because earnings can fluctuate a lot for deep cyclical stocks, I do not use earnings as a way to value the stocks. Instead, I use long-term historical price patterns to do so. And, I like to have data going back to at least 1998 for deep cyclical stocks so that I can observe at least two deep recessions (I don’t usually count 2020 because it was so weird.). Fortunately, for JPM, we have plenty of data going back that far so we can carry on with the “deep cyclical” analysis.
Step 2: Historical Price Cyclicality
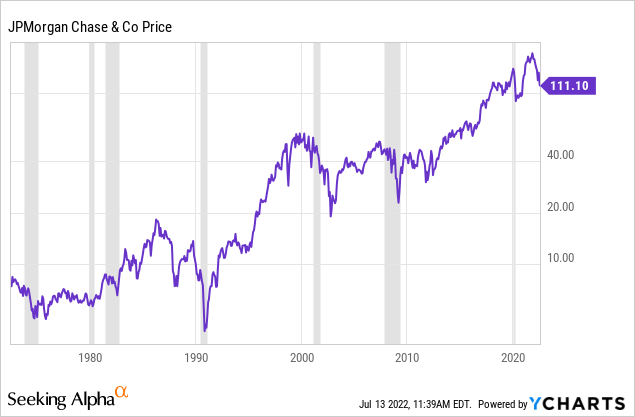
Once I’ve established that a stock is a deep cyclical, the next thing I examine is what their historical deep drawdowns have looked like. In most cases, I require there be at least enough data to include two recessions, and in JPM’s case, this isn’t a problem as they have data going back several decades and we can easily examine the last several recessions.
Above is a chart of their historical price drawdowns with recessions highlighted. Below is a table version of the data.
| Year | ~Time Until Bottom | ~Duration | ~Depth |
| 1972 | 1 year | 9 years | -50% |
| 1981 | 1 year | 15 months | -33% |
| 1982 | 1 year | 21 months | -35% |
| 1987 | 1 year | 9 years | -63% |
| 1989* | 1 year | 3 years | -73% |
| 1998 | 4 months | 6 months | -47% |
| 2000 | 2.5 years | 15 years | -76% |
| 2007* | 2 years | 6 years | -70% |
| 2020 | 3 months | 1 year | -44% |
| 2022** | 9 months** | ? | -35%** |
* These years the stock price did not make a full recovery before the next downcycle started.
** Only data for part of the year.
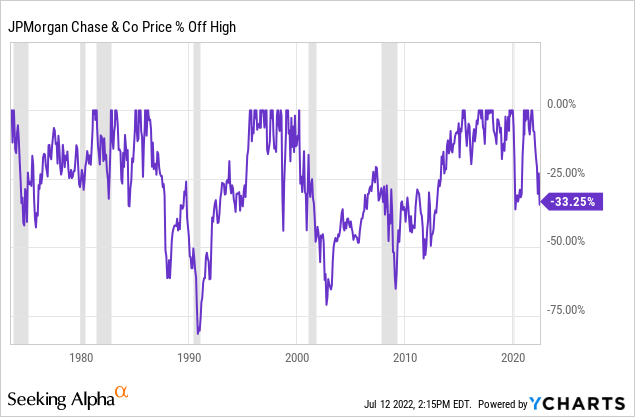
Obviously, JPM has changed over the decades and it is not the same company it was in the 1970s or 1980s, but I find it’s always useful to start with a big picture view first so that we have some idea of what is possible. During the big downcyles it is typical for JPM’s stock price to fall about -70% off its highs. This happened during the 1987, 2000, and 2007 downcycles. I think it’s reasonable, most other things being equal, to be prepared for the stock to fall that far if we have a bad recession this downcycle. Currently, my base case is for a mild recession, and not a bad recession, so I do not expect the stock to fall that far, yet. However, there is always the possibility that something else bad comes along to pile on top of what will already likely be a difficult period for the markets. If something extra bad like that happens, and I haven’t already bought the stock, I would aim to buy at that -70% drawdown level.
It’s notable that the 1998 decline from the Asian debt crisis and Long-term Capital Management implosion, and the 2020 COVID crash, were similar in terms of depth and duration (both periods where the Federal Reserve effectively came to the rescue of the markets). Generally speaking, I think the 2000 stock market decline has the most in common with our current decline. But I think JPM was about 20% more overvalued at the 2000 peak than it was at the 2021 peak based on their peak pre-recession P/E ratios.

Above is the approximate peak P/E in 2000. Below is the peak P/E based on normalized annual P/E ratio in 2021:
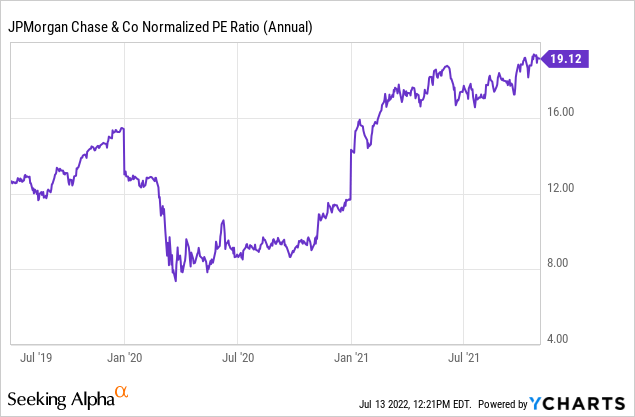
So, the way to make these downturns similar if we are estimating drawdown ranges is to lower the peak 2000 price by about 20%, and then measure from there. This also makes sense because JPM stock had a very quick blow-off top in March of 2000 that sort of gave a false peak for the stock. If we controlled for this, JPM’s price would have fallen from about $48 at its adjusted peak to roughly $15 near the bottom. That’s a decline of about -68%, give or take during the 2000 downturn.
Putting all this together, the bulk of the 1987 decline happened the first year and fell about -63%, the 2000 decline, once the blow of top in March of 2000 is controlled for (relative to 2021) the stock fell about -68% over 2.5 years, and the 2007-2009 decline was about -70% over 2 years. Based on these past declines, an expected price decline this time around is somewhere between -60% and -70%. I’m inclined to think there is more cash floating around going into this coming recession, and there are a lot of retirees who would probably be willing to come in and buy JPM stock because they know the name well, and JPM is perceived as relatively safe. So, I wouldn’t count on JPM stock falling into the deeper end of that range, and I would consider buying after a -60% drawdown, rather than aiming for a deeper decline (at least initially).
Currently, that would be a buy price of $69.18, which is about -35% lower than where the stock trades today.
But before I buy a deep cyclical stock like this I also run the business through a series of what I call impairment tests. The goal of these tests is to probe whether something might indeed be different this time that might prevent the stock from recovering as it has in the past.
Step 3: Impairment Tests
Underpinning this strategy is the idea that the past often repeats when we are dealing with high quality, yet cyclical, businesses. In fact, I only select businesses that have a relatively consistent pattern of repeating cycles. Next, let’s look at the impairment tests I run cyclical candidates through in order to see if there are any red flags that might indicate this time is significantly different from past cycles. I frame these as a series of questions, and as long as a stock passes the tests, I buy it when it hits its buy price.
Are revenues this cyclical peak higher than the last one?
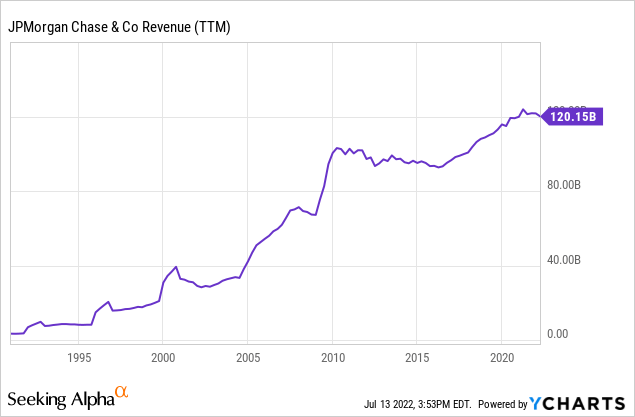
Revenues are nearly double what they were in 2007, so they are a lot higher this time around and JPM easily passes this test.
Could the business have a hidden fatal flaw?
Since, by definition, the fatal flaw in the business model is “hidden” and cannot be easily seen, my test for this is whether the cyclical business in question has experienced two full business cycles because, typically, recessions are where the flaws are exposed, and sometimes businesses can get lucky and avoid trouble in one recession but have the flaw eventually catch up to them during the next. I typically pre-screen for this before I write an article, and JPM passes this test since it recovered fine from the past two recessions, and has been around for over 100 years.
Is there a clear and disruptive threat to its core business?
The simple answer here is “no”. At least not that I can see. And I think over the next year all of the “Defi” and crypto investors are going to wish they owned JPM rather than potential disruptors. Sure, JPM might have a drawdown that is 2/3rds from its peak, but it will eventually bounce back. The same can’t be said for 99% of the potential disruptor stocks.
Has the stock experienced a recent super-cycle?
Occasionally, stocks go through big super-cycles, valuations get thrown out the window by investors and the stock prices get bid up to crazy high levels. This can cause a problem for a strategy like mine that measures declines from peak prices because if the peak prices are ridiculously high, then a stock might fall -50% or more off its highs and still not exactly be a good value.
I don’t have a clear way to identify super-cycles. It’s kind of an “I’ll know it when I see it” sort of thing. But my quick way to check is to look at a log-scale version of a long-term historical price chart. Super-cycles tend to show up pretty well on these charts without giving as many false positives as a normal long-term price chart might.
As I noted, super-cycles can sometimes be hard to identify, but one could argue that the steep rise in the mid-1990s to 2000 was a super cycle, and maybe even the 5-year period from 1982 to 1987. In comparison, the climb from 2012 to 2021, was more gradual. So, while 2021 was certainly a cyclical peak, I don’t think it qualifies as a clear super-cycle.
Is management corrupt or incompetent?
I don’t think most people would consider Jaime Dimon corrupt or incompetent, and usually, he is considered a top-tier CEO.
How is the company’s debt-to-equity compared to previous cycles?
I don’t use this factor for banks. So, we will skip it for this stock.
Has the price dropped enough to produce alpha in the past?
This might be the most interesting test to examine because during a couple of the downcycles the cycle from peak to peak was longer than I would prefer.
For this section of the analysis, I’m going to go back in time and see what sort of returns investing in JPM after a major decline would have produced. In the table below, I assume the stock was purchased after it had declined -60% from its highs and then sold after it recovered its previous peak stock price. So, for each investment, the pure return is ~150%, and they do not include dividends. I annualized that return and then compared it to the S&P 500 if bought and sold on the same dates, annualized. The goal is to see if historically this would be an alpha-producing strategy, so the last column is the alpha produced by the investment annualized relative to the S&P 500. As I did earlier, I adjusted for the March 2000 price spike.
|
Year the decline began |
Purchase Date | Sell Date | Months Held | Annualized Gains |
S&P 500 Annualized Gains |
Alpha Vs S&P 500 Annualized |
| 1987 | 12/15/87 | 7/25/95 | 91 | 19.78% | 17.27% |
+2.51% |
| 2000* | 7/23/02 | 1/24/07 | 54 | 33.33% | 17.10% | +16.23% |
| 2007 | 1/20/09 | 8/1/2013 | 56 | 32.14% | 22.09% | +10.05% |
*Adjusted to control for March 2000 price spike.
We can see above that even during the extended double dip that JPM stock took after the 1987 crash and early 1990’s recession, the stock eventually recovered and still produced a very good 20% annual return excluding dividends, while also slightly outperforming the S&P 500 index. I think if we have a very bad recession that takes a long time to recover from, then the 1987 downturn is probably the type of return we should expect. Not great, but certainly not bad. The adjusted 2000 and 2007 downturn returns of 32% to 33% annualized after holding in between 4-5 years, would be my base case approximation if we were able to buy JPM stock down -60% off its highs. These purchases would have outperformed the S&P 500 index by double digits annually. All-in-all, the odds of good returns if purchased at the right price and willing to hold for the medium-to-long-term, are very good with this stock.
Conclusion
When earnings are deeply cyclical as they are with JPMorgan Chase even high quality businesses with a long historical track record can sell off deeply. During recessions, it should be expected that JPMorgan’s stock price can sell off as deep as -70% off its highs. Historically, during these deep sell-offs, buying after a -60% drawdown from the peak price has produced very good medium and long-term returns both on an absolute and historical basis. JPM’s price peaked at about $172.96 this cycle. If it sold off -60% from there, that would produce a buy price of $69.18 per share, and that’s when I’ll be a buyer. Currently, at this point in the cycle, I am about 1/3 cash at the portfolio level, and for deep cycle stocks like JPM I typically take a 1% weighted position, never more than 2%.
Be the first to comment