

Justin Sullivan/Getty Images News
Thesis and Background
This article explains how why both Johnson & Johnson (NYSE:JNJ) and AbbVie (NYSE:ABBV) are excellent candidates for a withdrawal account for safe current income and at the same time expect healthy price appreciation. They are both excellent examples to illustrate our investment strategy and the philosophy of our newly launched marketplace service.
A bit of background about ourselves. My family is in the final stage toward retirement (after about 15 years of work). Through our own personal journey, we learned the key to building and protecting wealth is to pursue growth and income with ISOLATED risks. Sadly, we’ve seen too many people around us make the tragic mistake of mixing growth with income generation, or even worse, focusing on growth before ensuring adequate income. That is why we urge our readers to ALWAYS build two portfolios (and also why we provide 2x such model portfolios in our service) – one for income in the short term and one for growth in the long term – the so-called barbell model.
Under this context, the remainder of this article will compare JNJ and ABBV to highlight the things we look for in a holding on the short-term end of the barbell. Specifically, we look for:
- Adequate and safe income in the long term. We are looking for a relatively high current yield that is safely covered by strong financials. Both JNJ and ABBV boast status as Dividend Aristocrats. Both are among this elite group because they have raised dividends continuously for the last 50 years (in ABBV’s case, it includes its time as part of Abbott Labs). Also, both stocks are currently yielding substantially above the overall market. Especially, in ABBV’s case, it is current yield is about 3.4%, which is not only substantially higher than the overall market but also than the industry and JNJ (about 2.3%).
- Favorable odds for price appreciation. Specifically, we are looking for a margin of safety due to valuation or a catalyst in the near term. And you will also see both JNJ and ABBV are quite reasonably valued, both in absolute and relative terms, making both excellent fits for the income (or withdrawal) end of our barbell.
- Then we will detail the reasons why we only own ABBV even though we like both. As you will see, the primary reason is that ABBV offers a thicker dividend cushion, a lower valuation, and a future with less drama (compared to JNJ’s pending spinoff). These considerations make ABBV more of a conservative investment and JNJ more of a higher-risk-higher-return investment – in relative terms against each other.
The remainder of this article will focus on the above aspects and won’t dive into their pipelines. Readers interested in our take on their pipeline can see our earlier articles.
How did our barbell perform?
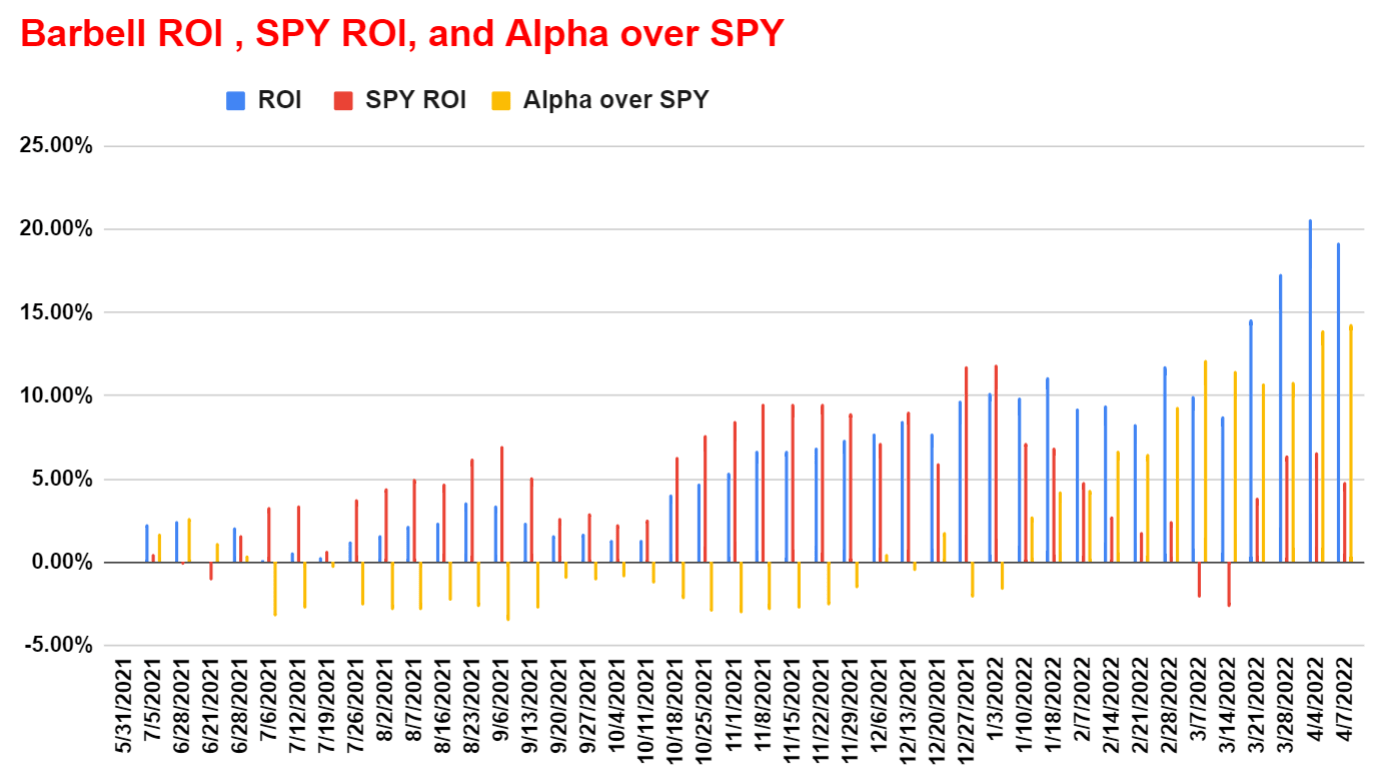
Before going into further details, you must be wondering how our barbell portfolio has performed. We hold a rather concentrated portfolio with about a dozen tickers diversified across different asset classes. Currently, our stock portfolio holdings are shown in the next chart. Using the date I first published it on 5/31/2021 as the inception date, its performance relative to the S&P 500 (represented by SPY) is shown below, and also plotted on a weekly basis in the second chart. The chart plots a really short timeframe compared to our horizon and there is no need to read too much into the specific numbers. At its current level (about 14% ahead of SPY), it can all change within a few days of random market fluctuations. A few notes:
- As you can see, they all tend to be stocks with a good combination of quality and valuation. We further divide them into two groups (withdrawal/survival vs aggressive growth) and hold them in our barbell portfolios. And that is how we achieve a superior return in a consistent and relaxed way with only a handful of holdings.
- Note that AAPL has been a legacy holding and its returns are not included in these charts (otherwise, it will completely dominate the picture). Also note that these returns did not include dividends, so the actual returns from our holdings are slightly better than reported here.
- Finally, our own journey has shown that sticking to FEWER but well-understood holdings not only generated higher returns but also LOWER risks despite the fact that we consistently applied leverage to the growth end of our barbell.
Source: author. Source: author.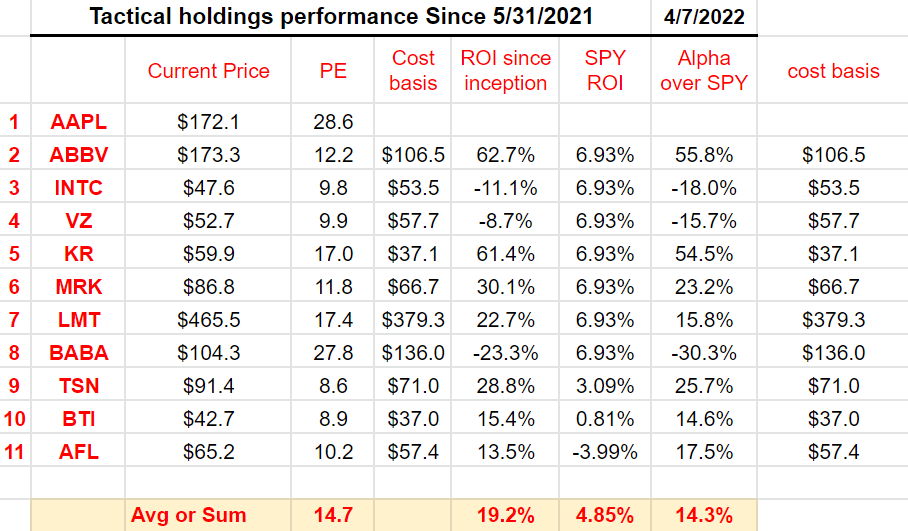
Superb profitability and dividend safety
Both JNJ and ABBV currently offer an attractive dividend yield of about 2.3 and 3.4%, respectively. Dividends from both companies are supported by superior and consistent profitability as you can see from the following chart. Take the net income margin as an example. Both feature a net margin of around 21%. To put things under perspective, the average profit margin for the overall economy fluctuates around 8% and rarely goes above 10%. Of course, this is an average across all business sectors. Nonetheless, as a rule of thumb, 10% is a very healthy profit margin and 20% is a very high margin.
Seeking Alpha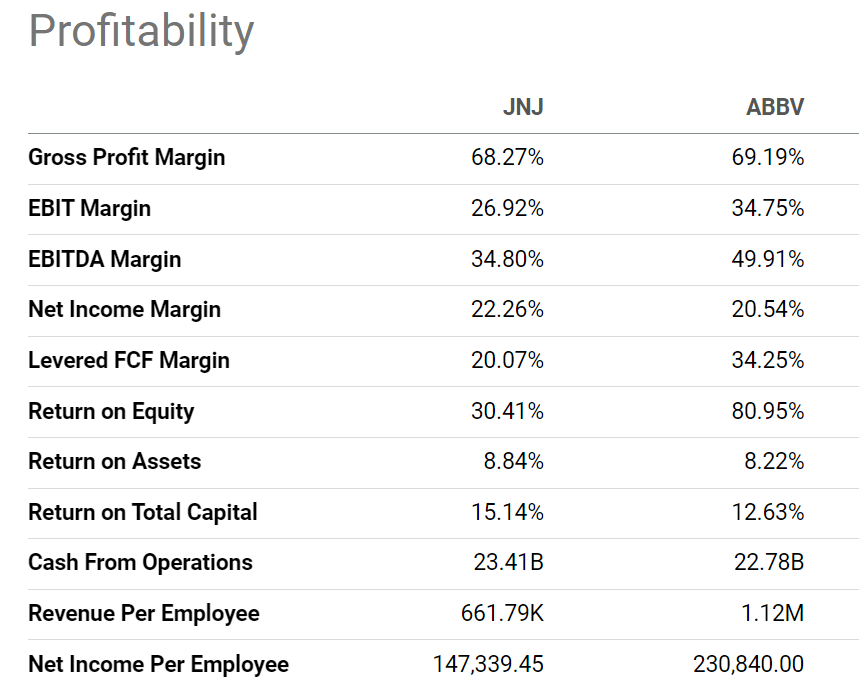
And for dividend investors, I am sure all of us know all the typical metrics to gauge dividend safety such as payout ratio in terms of earnings, payout ratio in terms of cash flow, et al. The following chart shows JNJ and ABBV’s payout ratio in terms of cash flow. As seen, both JNJ and ABBV have been doing a consistent job of managing their dividend payout in the past. The payout ratios have been essentially the same for both – on average 44% to 45%.
Also, you can see that ABBV’s current payout ratios are a bit lower than its historic averages, adding another layer of safety.
Author based on Seeking Alpha data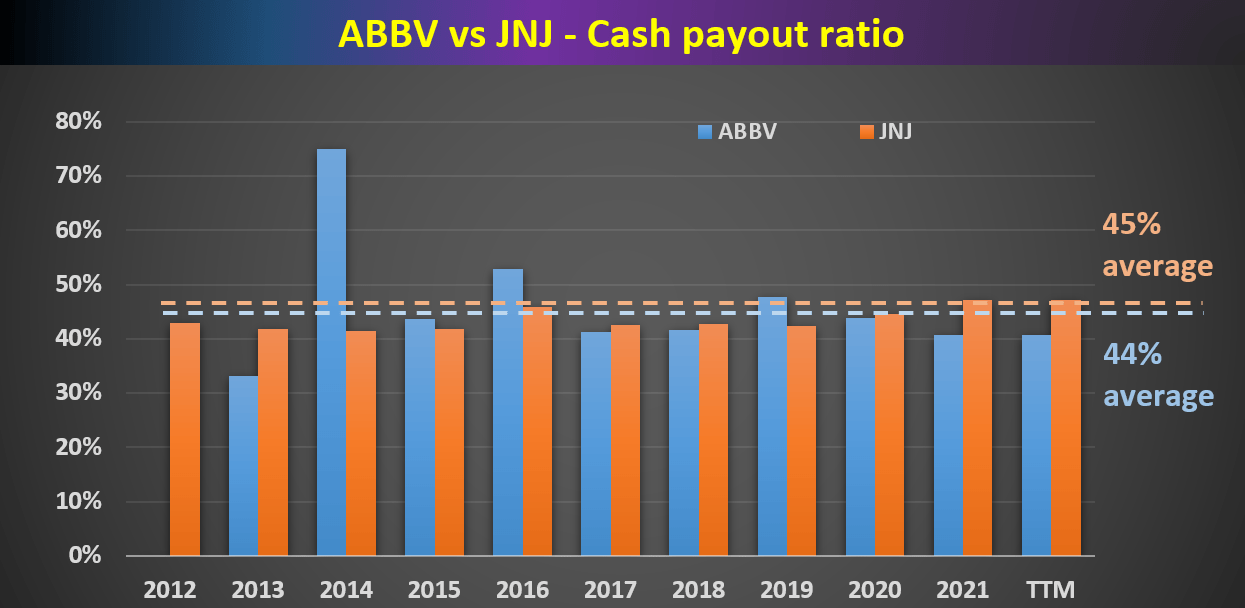
Dividend cushion ratios
The above pay-out ratios we commonly quote enjoy simplicity, and we also like to go a step further for a more comprehensive assessment of dividend safety. As detailed in my earlier article here, the major limitations of the above simple payout ratios are twofold:
- The simple payout ratio ignores the current asset that a firm has on its balance sheet. Obviously, for two firms with the same earning power, the one with more cash sitting on its balance sheet should have a higher level of dividend safety.
- The simple payout ratio also ignores the upcoming financial obligations. Again, obviously, for two firms with the same earning power, the one with a lower level of obligations (pension, debt, CAPEX expenses, et al) should have a higher level of dividend safety.
The above simple payout ratios ignore all these important pieces. For a more advanced analysis of dividends stocks, we find the so-called dividend cushion ratio an effective tool. A detailed description of the concept can be found in Brian M Nelson’s book entitled Value Trap. And a brief summary is quoted below:
The Dividend Cushion measure is a ratio that sums the existing net cash (total cash less total long-term debt) a company has on hand (on its balance sheet) plus its expected future free cash flows (cash from operations less all capital expenditures) over the next five years and divides that sum by future expected cash dividends (including expected growth in them, where applicable) over the same time period. If the ratio is significantly above 1, the company generally has sufficient financial capacity to pay out its expected future dividends, by our estimates. The higher the ratio, the better, all else equal.
Note that our following analysis made one revision to the above method. Instead of subtracting the total long-term debt, we subtracted the total interest expenses over a past five-year period. The reason for this revision is to adjust the status of businesses such as JNJ and ABBV. Mature businesses like these probably will never have the need to repay all of their debt at once. But it does need to have enough earnings to service its debt (i.e., cover the interest expenses). With this background, the dividend cushion ratios for JNJ and ABBV are calculated and shown below.
As can be seen, JNJ has been maintaining an average dividend cushion ratio of 2.63x in recent years, and ABBV has been maintaining an even higher cushion ratio of 2.74x. Both are significantly above 1, confirming their safe and conservative dividend payout in the past.
Author based on Seeking Alpha data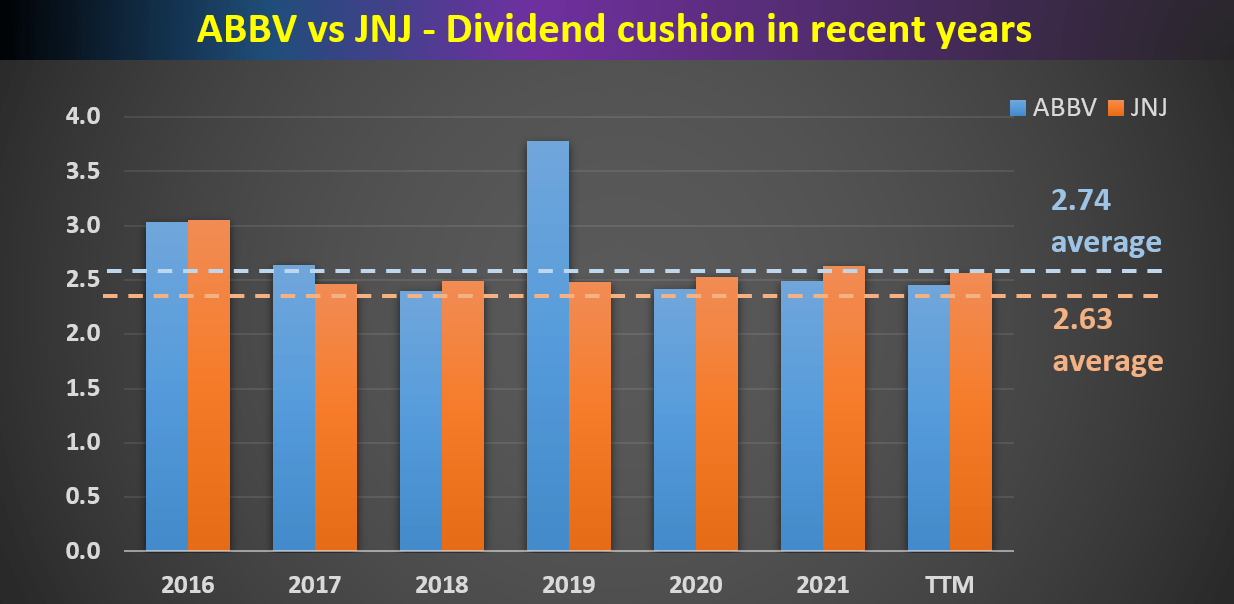
Valuation and Projected Returns
As can be seen from the following numbers in the table, at its current price level, JNJ is about fairly valued. It is about 9% undervalued based on its historical price to cash flow multiples, and about 9% overvalued based on its historical dividend yield. Thanks to its robust revenue streams and super profitability as aforementioned, it also boasts an A++ financial safety and A earning consistency.
For the next 3~5 years, a mid-single-digit annual growth rate is expected (near 5.5%) given its strong ROCE (return on capital employed). At 48% ROCE, a modest 10% investment rate would be able to sustain a 4.8% organic growth rate. Given its long-term pricing power, adding a bit of an inflation escalator would achieve a 5.5% growth rate conservatively. And the total return in the next 3~5 years is projected to be in a range of 15% (the low-end projection) to about 37% (the high-end projection), translating into a very attractive annual total return up to the upper single-digit.
Author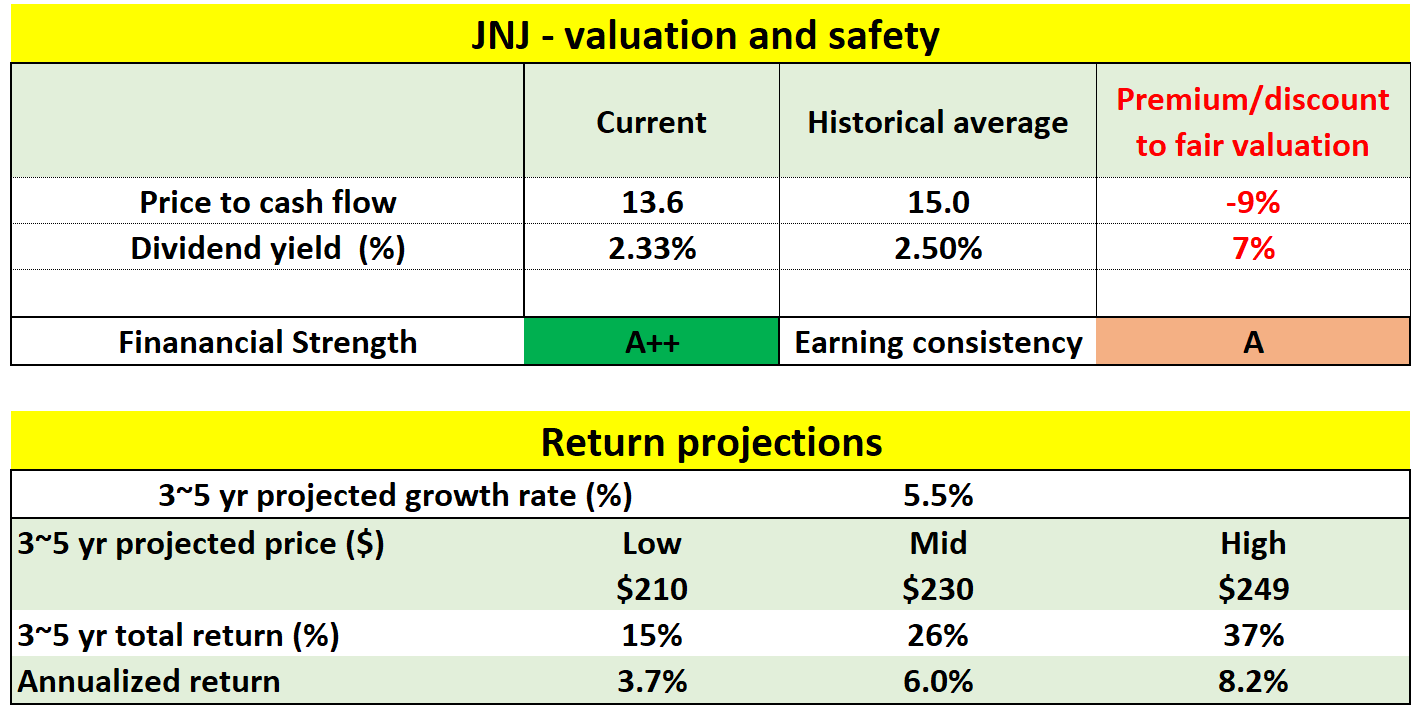
ABBV’s case is very similar as can be seen from the following table. At its current price level, it is also about fairly valued. It is about 4% undervalued based on its historical price to cash flow multiples.
For the next 3~5 years, a mid-single-digit annual growth rate is also expected (near 5.5%). ABBV’s ROCE is about 60%, even higher than JNJ. Its reinvestment rate is a bit lower though, around 7.5%. At 60% ROCE and a 7.5% reinvestment rate, a 4.5% organic growth rate. Given its long-term pricing power, adding a bit of an inflation escalator would achieve a 5.5% growth rate conservatively. And the total return in the next 3~5 years is projected to be in a range of 3% (the low-end projection) to about 28% (the high-end projection), also translating into a very attractive annual total return up to the upper single-digit.
Author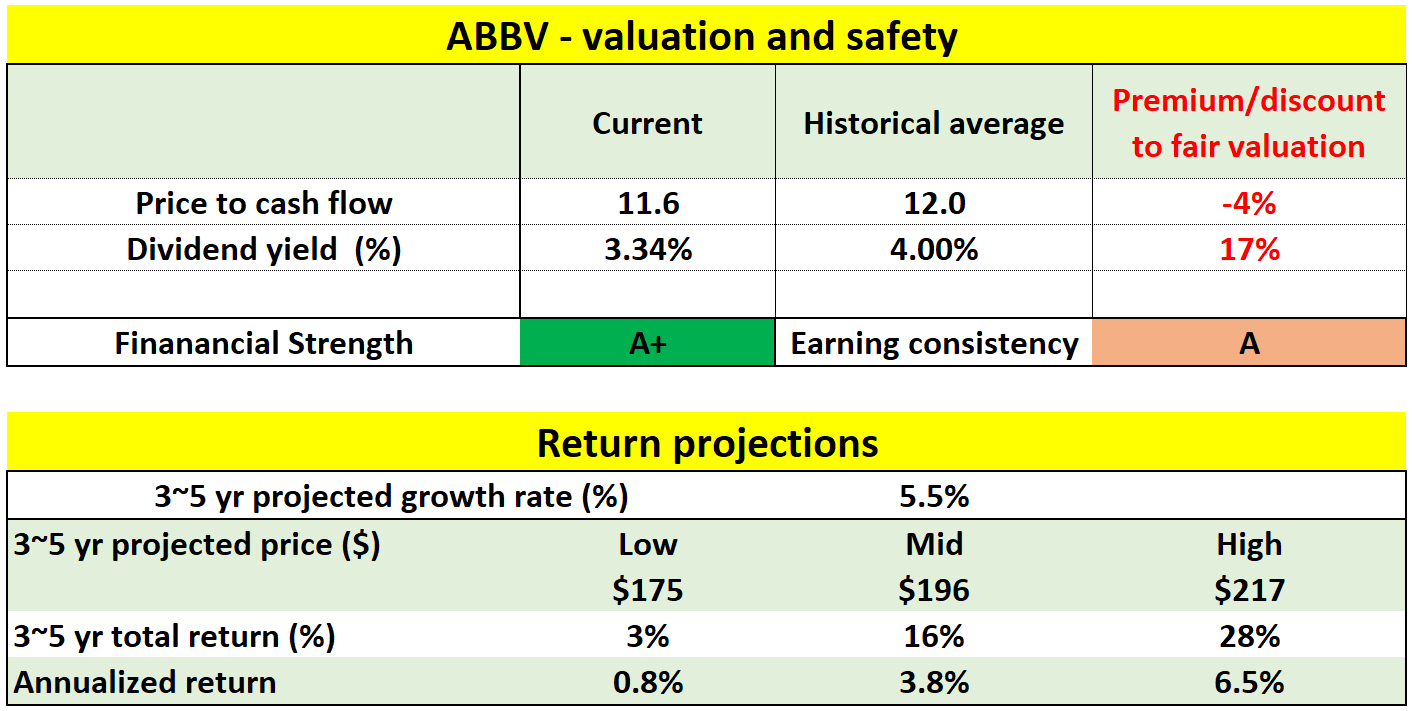
Risks and other considerations
- In JNJ’s case, cost control remains an issue in the near term. The cost environment remains tough, and the effectiveness of its expense-control efforts is yet to be seen. The elephant in the room is its ongoing spin-off. JNJ announced plans to spin off its Consumer Health business and also split into two independent companies. The spinoff plan could aid growth down the road. However, a move of this magnitude certainly entails some risks.
- In ABBV’s case, there can be some sizable volatility risks in the short term. Its share price has surged roughly 50% over this past year, and the PE multiple is starting to look a bit stretched. Given the recent rapid price rally and the unfolding macroeconomics risks, investors should be prepared for some volatility risks ahead.
Conclusion and final thoughts
Both JNJ and ABBV are best examples to illustrate the barbell strategy we apply on our personal accounts and in our marketplace service. Both are excellent fits for the withdrawal end of the barbell with their high dividends, safety, and favorable price appreciation potential.
Although we like both and our analysis shows both offers about the same long-term return potentials (up to upper single-digit), we only hold ABBV for the following considerations tailored to our own investment style and risk profile:
- The primary reason is that ABBV is more of a value investment compared to JNJ. Even though their total return potentials are about the same, the compositions are different. In ABBV’s case, a larger portion comes from the current dividend.
- And its dividend is safer in terms of a thicker dividend cushion.
- Combined with the consideration of JNJ’s unfolding spin-off, ABBV is more of a conservative investment and JNJ more of a higher-risk investment – in relative terms against each other.
- But ultimately, we do not see bad choices here. Only choices that investors need to make to suit their own situations.
Be the first to comment