

Mariia Polskaia
One of my favorite things about investing is the sheer variety of companies that are out there to analyze. I especially find joy in discovering a business that has a very specific niche in which it operates and does so in a way that creates attractive value for its investors. One example of a company that fits this description is John B. Sanfilippo & Son (NASDAQ:JBSS). In recent years, there has been no clear trend when it comes to the company’s revenue and profitability. But for the most part, its numbers have remained in a fairly narrow range, indicating stability. Given the stability and how cheap shares are relative to similar firms, I do believe that it represents an interesting investment opportunity. This is far from a strong prospect, but I do think it makes for a soft ‘buy’ one at this time.
One nutty business
According to the management team at John B. Sanfilippo & Son, the company operates as one of the leading processors and distributors of peanuts, pecans, cashews, walnuts, almonds, and other nuts in the US. The nuts it produces are sold under a few key brands, such as Fisher, Orchard Valley Harvest, Squirrel Brand, Southern Style Nuts, and Sunshine Country. In addition to this, it also sells its products under private label brands as well. More specifically, the company’s primary products are raw and processed nuts. During its latest fiscal year, these made up 70% of the company’s revenue. The company acquires all of its peanuts and walnuts directly from domestic growers. The majority of its pecans are also purchased from domestic growers, with some suppliers having operations in Mexico. To cover the rest of demand, the company also relies on trading companies and various domestic processors.
The company also produces and sells peanut butter, as well as a wide assortment of other food and snack products. Examples include snack mixes, salad toppings, snacks, trail mixes, dried fruit, and other related products. The company then sells these products to roughly 255 customers through a mixture of its consumer, commercial ingredient, and contract packaging distribution channels. Though not a major portion of the business, the company does also have a retail store at its headquarters that sells snack and baking products, bulk foods, and other related offerings.
It would be helpful to understand a bit more about the company’s product mix. Last year, trail and snack mix products made up the largest portion of its revenue, accounting for 24.7% of sales in all. This was followed by cashews and mixed nuts at 23.3%. Peanuts made up 19.3% of revenue, while almonds comprised 10.8%. Another way to look at the company is through the lens of its customer. 79.9% of the company’s revenue in its 2021 fiscal year were made to the consumer category. 10.8% of revenue went to the commercial ingredients category. And the remaining 9.3% went to the contract packaging space.
Author – SEC EDGAR Data
Over the past few years, the financial performance of the company has been remarkably consistent. Revenue has not shown any clear trend, instead sticking around in a fairly narrow range of between $846.6 million and $888.9 million over the past five years. Although the company does have a history that shows no real growth, the current fiscal year might be a bit different. During the first nine months of its 2022 fiscal year, the company generated revenue of $698.1 million. That’s 7.1% higher than the $651.7 million reported just one year earlier. The largest contributor to this rise in sales was sales volume, which added 5.6% to the company stop line. Higher pricing, meanwhile, contributed to the tune of 1.5%.
Author – SEC EDGAR Data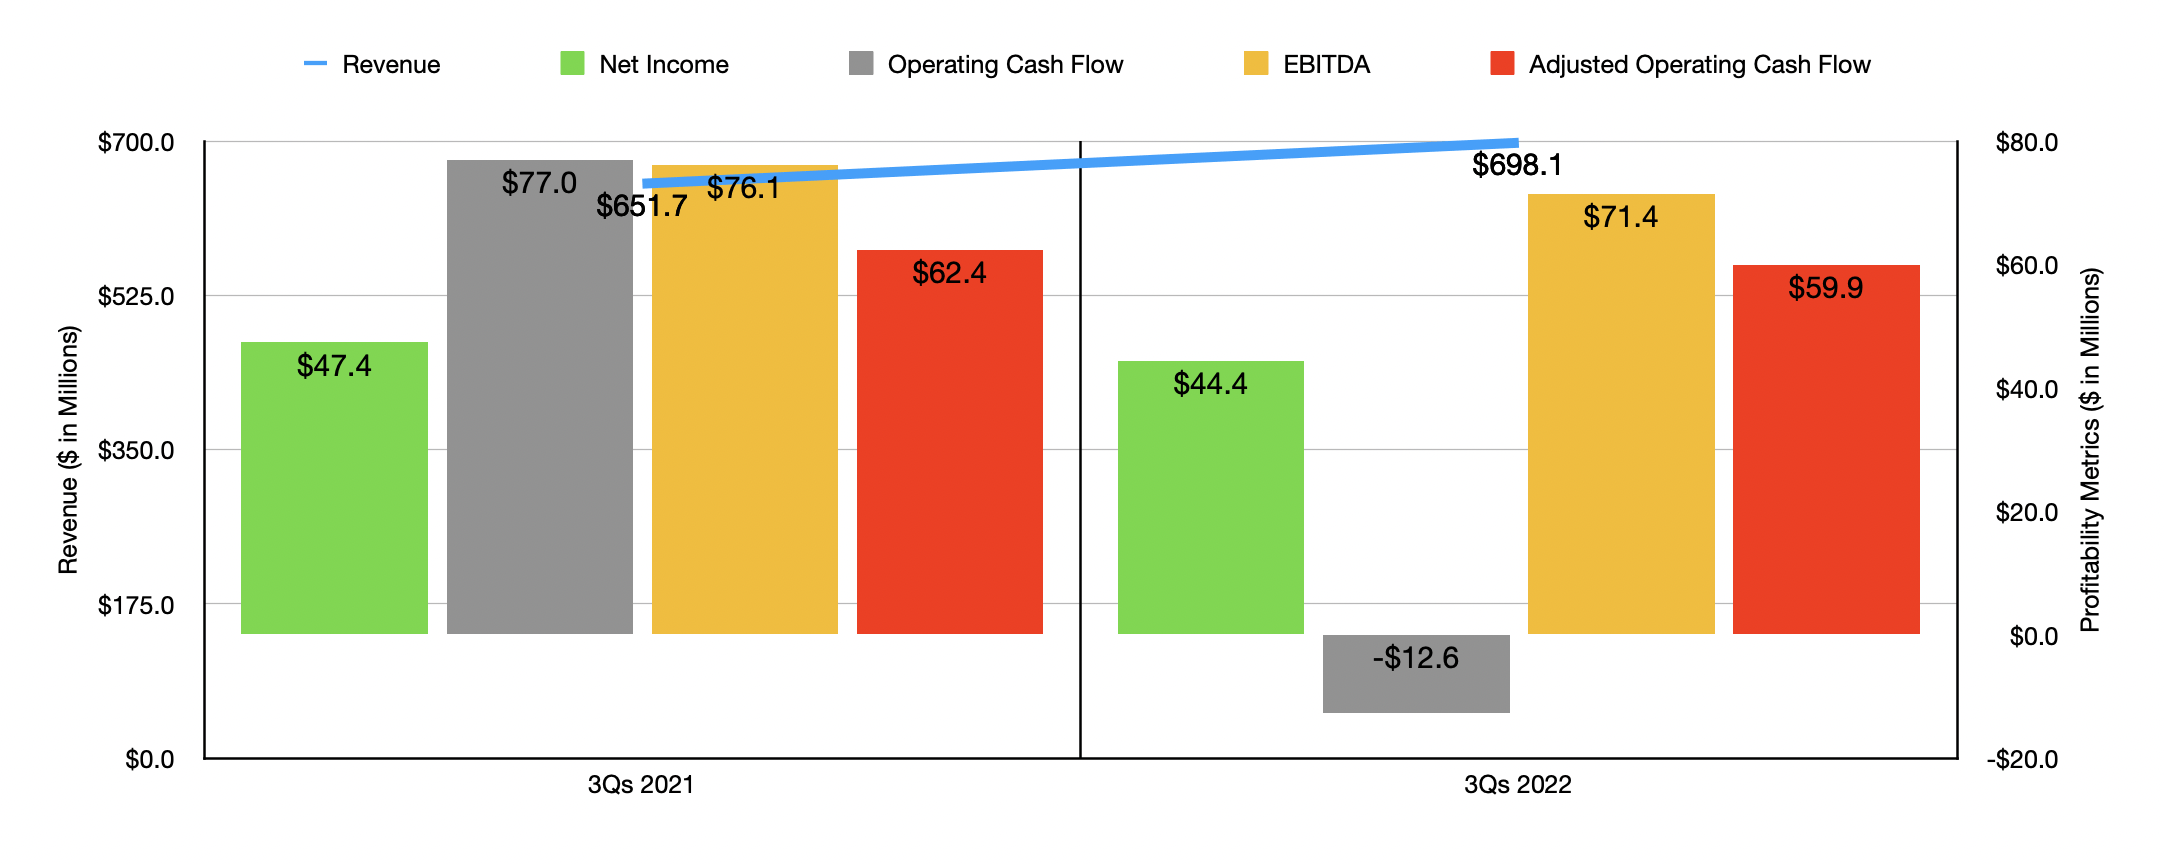
When it comes to profitability, the picture has been fairly similar to what we have seen when looking at revenue. Net income has shown something of a trend. After seeing profits dip from $36.1 million in 2017 to $32.5 million in 2018, they then continued to climb, eventually hitting $59.7 million last year. Operating cash flow, meanwhile, has not shown really any trend. The metric has bounced around between a low point of $52.7 million and a high point of $104.7 million. But if we adjust for changes in working capital, we would see the trend rise consistently year after year, climbing from $52.5 million in 2017 to $79.1 million last year. A similar uptrend can be seen when looking at EBITDA, with the metric dipping from $72.6 million in 2017 to $68.2 million in 2018. From there, it ultimately began a consistent year-over-year improvement, hitting $97.3 million in 2021.
Although revenue has come in higher this year, profitability has been a bit on the weak side. Net income in the first three quarters of 2022 totaled $44.4 million. That’s down slightly from the $47.4 million generated the same time one year earlier. Operating cash flow plunged from 77 million dollars to negative $12.6 million. But if we adjust for changes in working capital, it would have dipped from $62.4 million to $59.9 million. Meanwhile, EBITDA also worsened, dropping from $76.1 million to $71.4 million.
Author – SEC EDGAR Data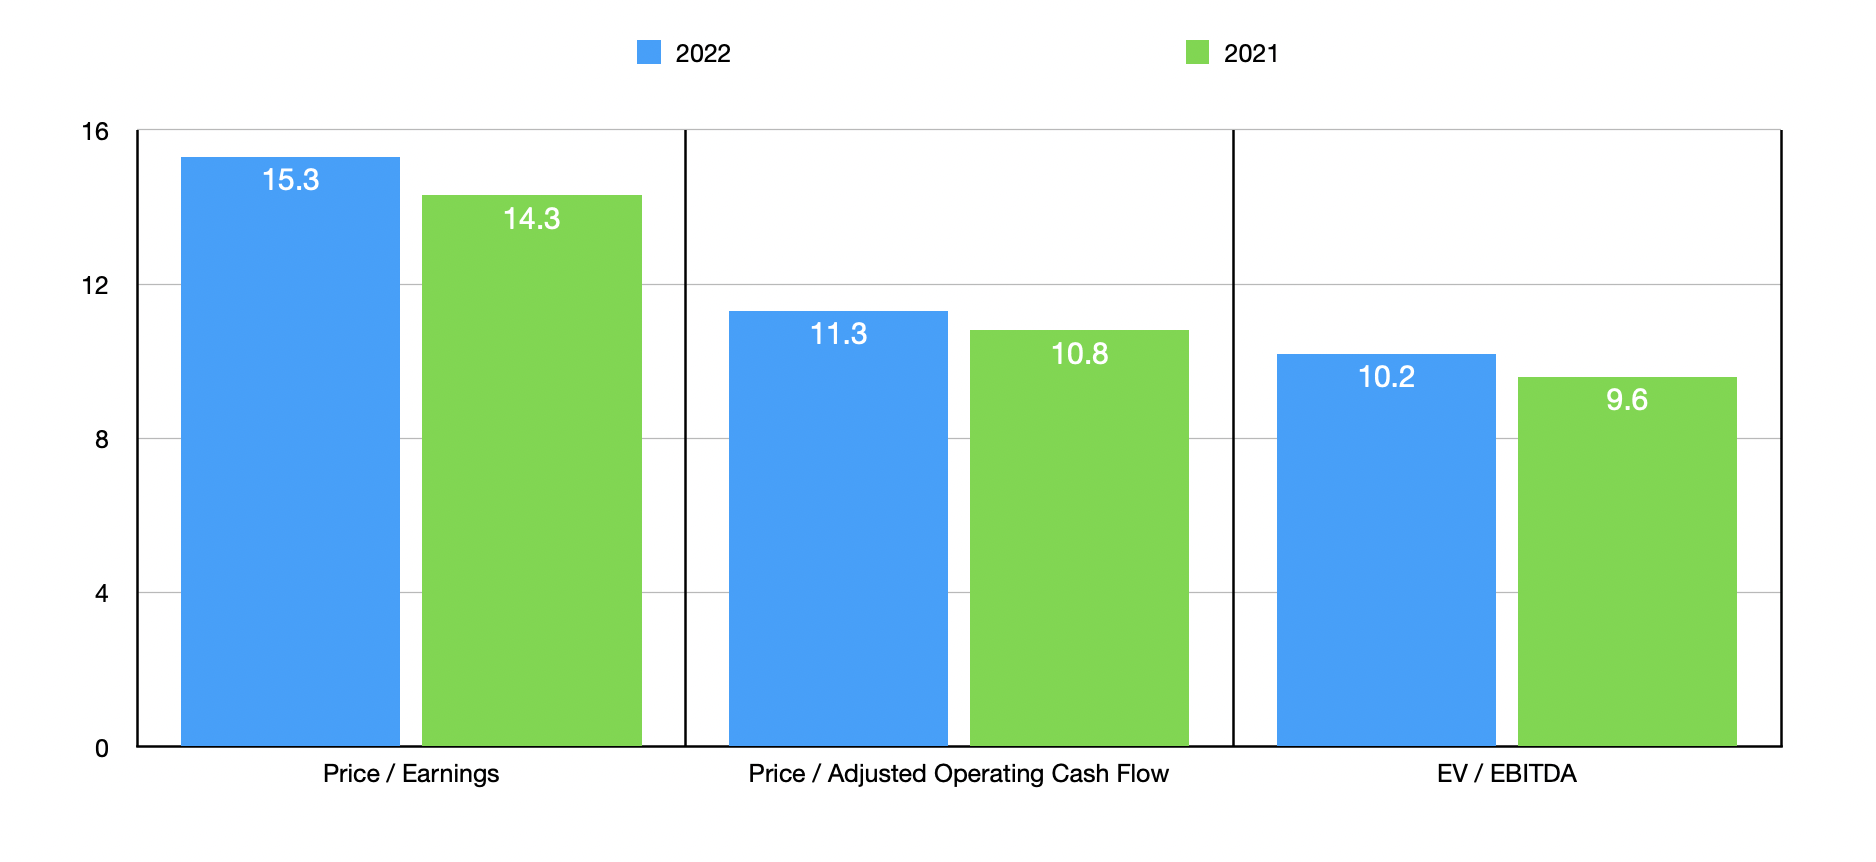
We don’t really know what the rest of the 2022 fiscal year will look like. But if we annualize results experienced so far for the year, we should anticipate net income of $55.9 million. Operating cash flow, on an adjusted basis, should be $75.9 million. And EBITDA should come in at $91.3 million. Using this data, we can definitely price the company. On a forward basis, the firm is trading at a price-to-earnings multiple of 15.3. This compares to the 14.3 multiple we get if we use our 2021 results. The price to adjusted operating cash flow multiple should be 11.3. That compares to the 10.8 reading that we would get using the 2021 figures. And the EV to EBITDA multiple should increase from 9.6 using the 2021 results to 10.2 using 2022 estimates. To put this pricing into perspective, I compared the company to five similar firms. On a price to operating cash flow basis, these companies range from a low of 2.3 to a high of 854.6. Using the EV to EBITDA approach, the range was from 2.9 to 303.2. In both cases, only one of the five companies was cheaper than our prospect. Meanwhile, using the price-to-earnings approach, the range was from 4.5 to 6,335.6. In this scenario, two of the five companies were cheaper than John B. Sanfilippo & Son.
| Company | Price / Earnings | Price / Operating Cash Flow | EV / EBITDA |
| John B. Sanfilippo & Son | 15.3 | 11.3 | 10.2 |
| Adecoagro SA (AGRO) | 4.5 | 2.3 | 2.9 |
| SunOpta Inc. (STKL) | 9.5 | 854.6 | 35.1 |
| Calavo Growers (CVGW) | 98.1 | 30.7 | 100.4 |
| Mission Produce (AVO) | 42.5 | 33.9 | 19.0 |
| Tattooed Chef (TTCF) | 6,335.6 | N/A | 303.2 |
Takeaway
All things considered, I find John B. Sanfilippo & Son to be an interesting business. I like simple companies that have either a singular focus or something close to it. I would have liked to have seen revenue and profitability rise consistently year after year, but the overall picture does look promising, nonetheless. I wouldn’t call shares extremely cheap by any means, but they definitely are on the cheap side of the spectrum. This is true on both an absolute basis and relative to similar firms. Due to all of these factors, I have decided to rate the business a soft ‘buy’ for now.
Be the first to comment