

winhorse
On Oct. 25, 2022 I wrote an article on the JPMorgan Equity Premium Income ETF (JEPI). I concluded that this was a good way to hold a position in low-volatility, high current income stocks. If you haven’t read that report, I suggest you do so first. If not, I’ll try to summarize where needed.
JEPI targets a low vol approach to the broad market. But there’s no reason that this approach can’t be used for other purposes. In fact, this is just what JPMorgan has done with the JPMorgan Nasdaq Equity Premium Income ETF (NASDAQ:JEPQ). This launched in May 2022. The difference is that JEPI targets the broad market while JEPQ targets the growth sector, the NASDAQ.
Like its sister ETF, JEPQ lowers the vol and increases the income of its portfolio in two ways:
-
It actively picks a portfolio of stocks within the NASDAQ that has lower vol than the overall index.
-
It writes covered calls on the overall index for about 15% (currently) of its assets.
JEPQ started in May of 2022, so there’s not much history to go on. I won’t be doing the concentrated statistical analyses of the JEPI article. But here are the basic facts:
JEPQ is a much smaller ETF, with about $600 million in assets. That’s still pretty good for a new launch, and I think it shows the demand for this type of vehicle. It is also probably riding on the popularity of JEPI.
The dividend yield right now is 10.4%. The reason this is so much higher than the yield on the NASDAQ is the income from call writing. BTW, Some websites quote the SEC yield of 19.9%. I called JPMorgan, and they said to use the lower number.
So let’s go into the portfolio and see if it really does provide a low vol approach to the growthy NASDAQ. There are two elements to it.
First is the covered call writing. JEPQ, like JEPI, does this with privately negotiated exchange traded notes rather than clearinghouse options. I believe there is a tax advantage within the fund structure to doing this. These account for about 15% of net assets. On the face of it, this should be even better than JEPI, since the implied volatility of NASDAQ options are greater than the S&P500. Higher implied vol’s directly translate into higher option premia. Here’s a table of the two vols:
| VIX (S&P) | VXN (NASDAQ) | |
| Last 1 Year | 25.2 | 31.2 |
| Last 5 Years | 20.9 | 25.3 |
| Last 10 Years | 17.9 | 20.9 |
Source: Yahoo data, author’s calculations
So the VXN is consistently higher than the VIX. This will lead to greater premium income from JEPQ vs. JEPI. Now, sophisticated readers know that the alpha you make from writing options is actually the difference between implied and realized vol. Here’s a table of these current values for the SPY ETF and the main NASDAQ ETF, the (QQQ):
| Implied Vol. (Current) | Realized Vol. (Since 1999) | |
| SPY | 20.0% | 15.3% |
| QQQ | 26.3% | 23.9% |
Source: Yahoo data, author’s calculations
So both funds have implied vol’s higher than realized vol’s. This should lead to positive alpha as well as higher income.
Second is the composition of the portfolio. Net of the ETN options, JEPQ has 85% of the portfolio to work with. Most of the reduction versus the NASDAQ index is from information technology and communications services. Here’s a table of percent of the portfolio of JEPQ vs. QQQ (the main NASDAQ index ETF):
|
Sector |
JEPQ |
QQQ % |
JEPQ – QQQ |
|
Information Tech. |
41.1% |
55.0% |
(13.9)% |
|
Communications Serv. |
11.8% |
15.5% |
(3.7)% |
Source: fund documents
Moreover, JEPQ’s risk reduction is concentrated in the familiar FAANG names. Here’s a list of JEPQ’s top ten single names as percent of the portfolio vs. QQQ.
|
Name |
JEPQ |
QQQ |
JEPQ-QQQ |
|
Apple |
10.40% |
13.4% |
-3.00% |
|
Microsoft |
8.6% |
11.0% |
-2.4% |
|
Alphabet |
6.0% |
6.4% |
-0.4% |
|
Amazon |
4.7% |
5.6% |
-0.9% |
|
Tesla |
2.5% |
3.3% |
-0.8% |
|
Nvidia |
2.4% |
3.2% |
-0.8% |
|
Meta |
1.9% |
2.2% |
-0.3% |
|
Cisco |
1.7% |
not in top-10 |
|
|
AMD |
1.5% |
not in top-10 |
|
|
Comcast |
1.3% |
not in top-10 |
Source: fund documents
So if you think that the mega-cap FAANG are going to continue to become greater percentages of the economy, this may not be the fund for you. I’m of the opinion that the superfast growth in FAANG is over. They have simply gotten too big to grow fast. Some markets, like digital advertising, are pretty much entirely captured. Also, there’s a lot of political pushback around the world about their power. So I like the portfolio.
Given the short track record, statistics may not have much value. However, the fund has performed very well in the six months it has been open. Here’s a graph of the alpha it has produced. NOTE: If you are not familiar with this type of chart, see my previous article.
JEPQ Alpha vs. S&P (Yahoo Data, Author’s Calculations)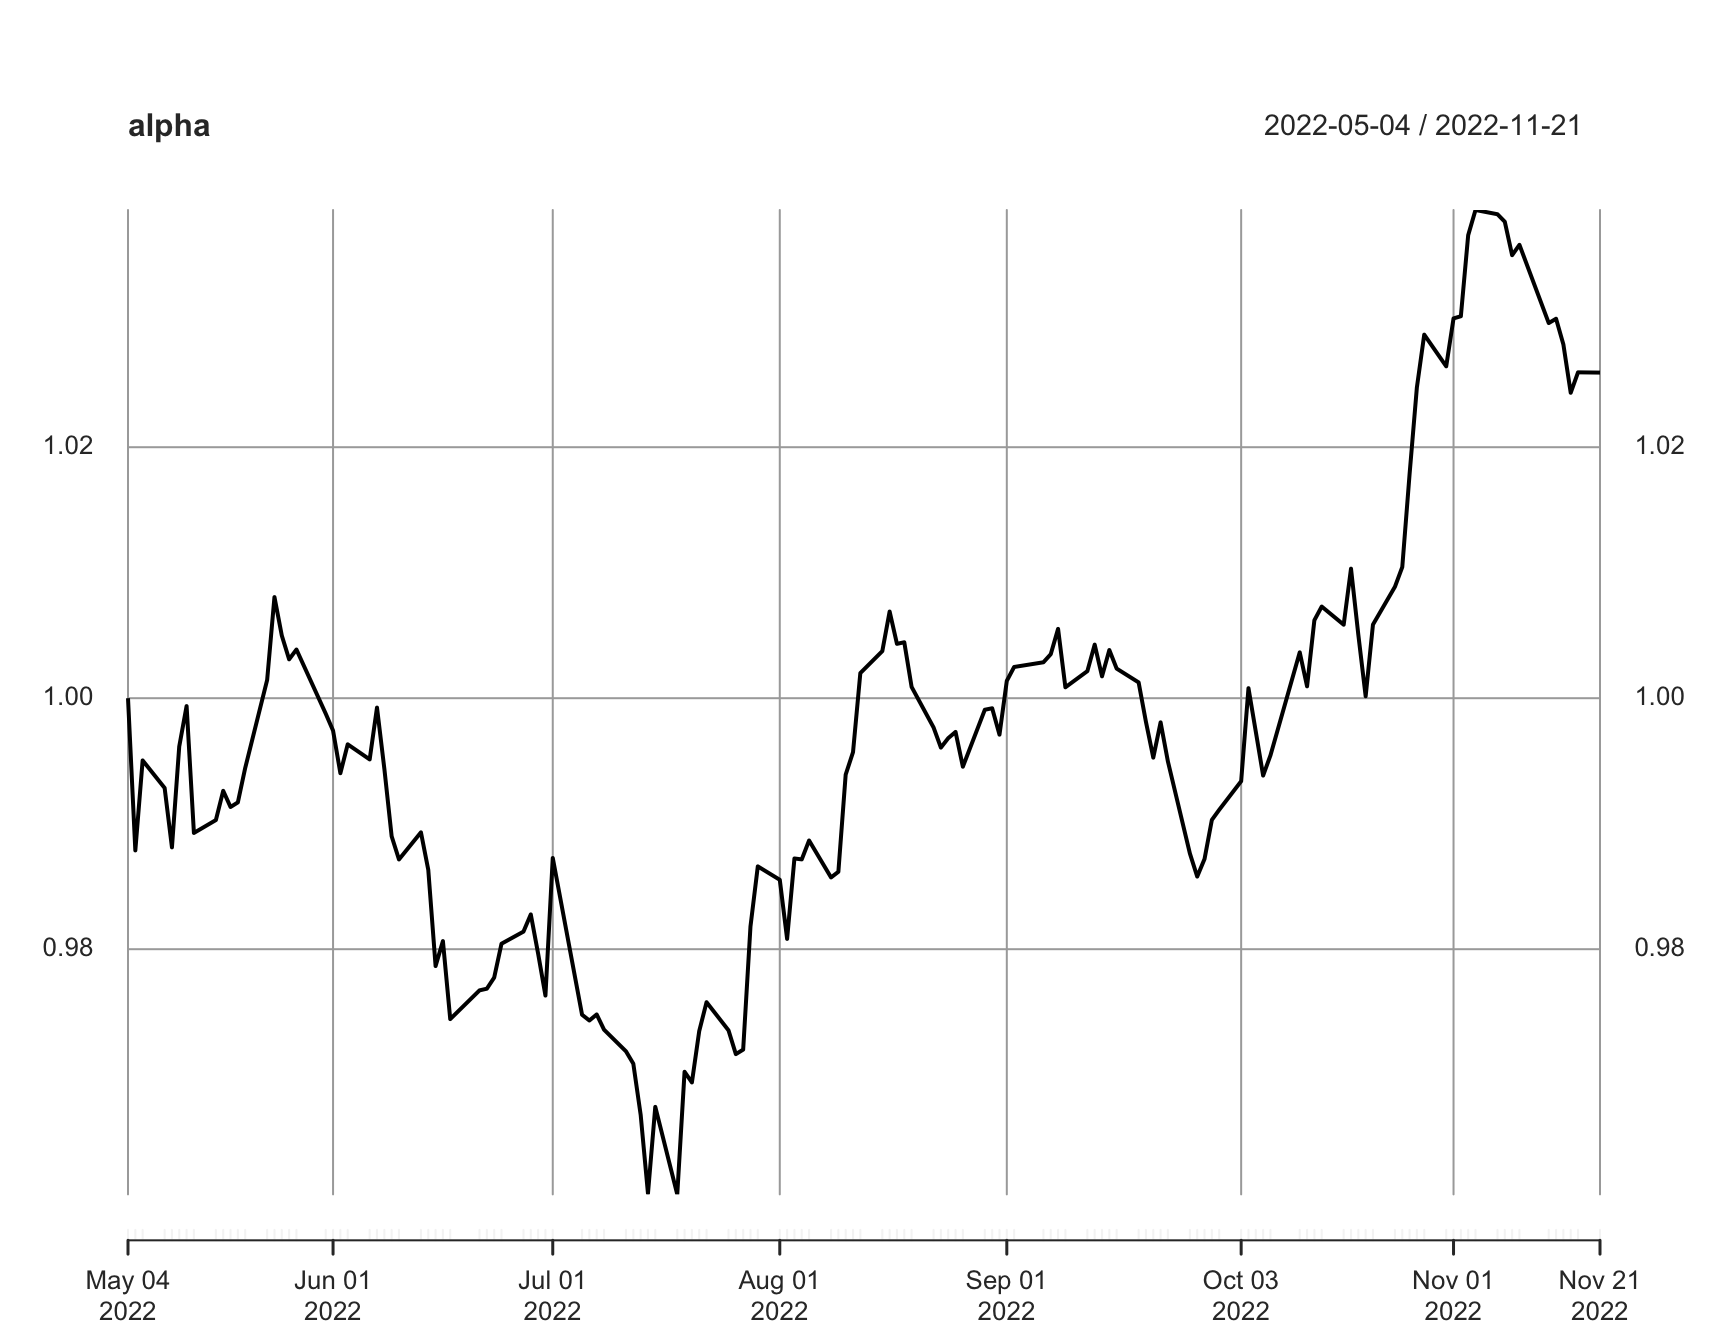
This is quite good, but it has come in a time of a 10% decline in the market. We will have to see whether it will continue to be an alpha generator in bull markets. Beyond the alpha, one should expect that this fund will overall underperform in bull markets and vice versa. That’s what it was designed to do.
Recently, I put 2.5% of my trading capital into JEPQ. That’s the minimum I put into any fund. It’s not worth the analytical effort to do less. It’s my only material growth position.
The reason I’m underweight growth is my view of interest rates. I believe the 1980 – 2021 secular decline in rates is over. We will be in a long period of steady or somewhat increasing rates. Growth is inversely correlated to rates, since growth by definition has its greatest earning power in the future.
Nonetheless, growth has taken a big hit in 2022, and it is possible that it’s worth wading back into it. That’s where JEPQ comes in. If I change my view on the long term of interest rates, I will be adding.
Be the first to comment