

John Kevin
Looking for a way to harness volatility and add some defense to your portfolio? Maybe you should consider using covered call/buy-write funds in order to accomplish this.
This article will focus on S&P-500-based covered call funds, which seek to enhance yield and/or lessen volatility via covered calls.
The JPMorgan Equity Premium Income ETF (NYSEARCA:JEPI) is one of the more heavily-traded covered call funds. It’s a relatively new fund – it IPO’d in May 2020.
Profile:
JEPI:
“Seeks current income while maintaining prospects for capital appreciation. The fund seeks to provide the majority of the returns associated with its primary benchmark, the S & P 500 Total Return Index, while exposing investors to less risk through lower volatility and still offering incremental income.
JEPI usually invests at least 80% of its assets in equity securities, but it may also invest in other equity securities not included in the S&P 500 Index. The fund “generates income through a combination of selling options and investing in U.S. large cap stocks, seeking to deliver a monthly income stream from associated option premiums and stock dividends.”
(JEPI site)
JEPI & Other S&P Covered Call Funds:
There are many other S&P-based buy/write funds in the market. JEPI is the newest and largest of these funds, with a 5/20/20 inception date, assets of $17B, and daily average volume of 3.4M shares. JEPI also has the lowest expense ratio in the group, at 0.35%.
We have one other ETF, the Global X S&P 500 Covered Call ETF (XYLD), which was founded in 2013, and 4 Closed End Funds (CEFs) in this group, which were founded in 2004-2005:
- Eaton Vance Tax-Managed Buy-Write Income Fund (ETB)
- Nuveen S&P 500 Buy-Write Income Fund (BXMX)
- Nuveen S&P 500 Dynamic Overwrite Fund (SPXX)
- BlackRock Enhanced Capital & Income Fund (CII)
XYLD is the 2nd largest fund in this group, at $2B – it also pays monthly, has 505 holdings, a low 0.60% expense ratio, and daily average volume of 3.4M shares.
The BXMX CEF is the 3rd largest fund, with $1.3B in assets, 254 holdings, and 189K in daily average volume.
CII holds $763M in assets, with just 56 holdings, and 102K in average volume, followed by ETB, with $379M in assets, and 69K in volume, 172 holdings, and a 1.1% expense ratio.
SPXX is the smallest fund in the group, with $262M in assets, a .89% expense ratio, 528 holdings, and 47K in average volume.
BXMX and SPXX pay quarterly, while the other 4 funds pay monthly:
Hidden Dividend Stocks Plus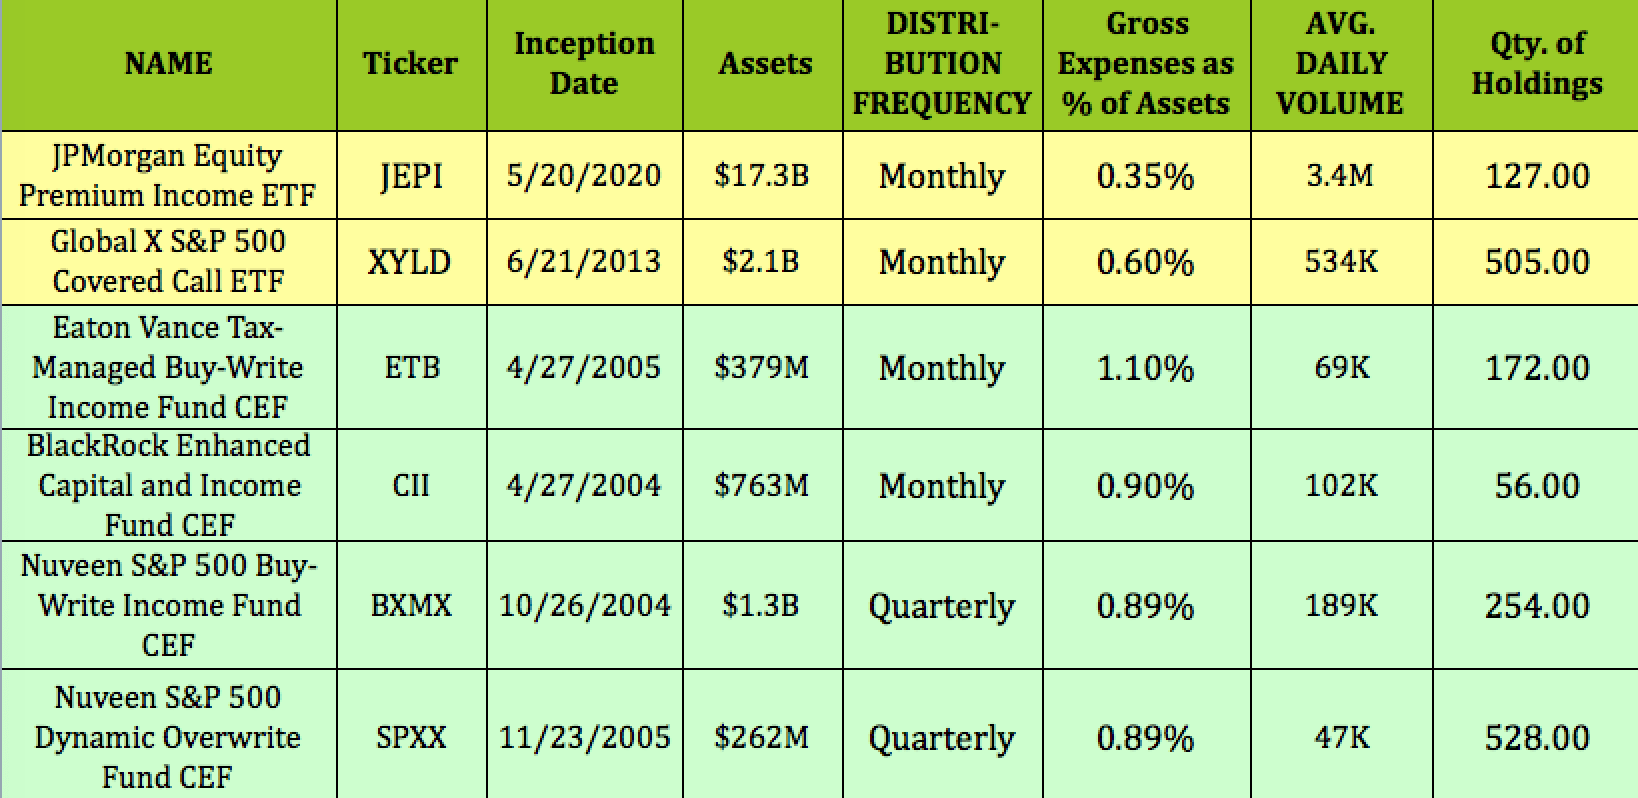
Dividends:
JEPI pays a variable monthly distribution, so we looked at its dividend yield on a trailing and forward basis. Its current trailing dividend yield is 10.57%, while its forward yield is much higher, at 13.38%. It should go ex-dividend next on ~2/1/22, with a ~2/4/22 pay date.
Hidden Dividend Stocks Plus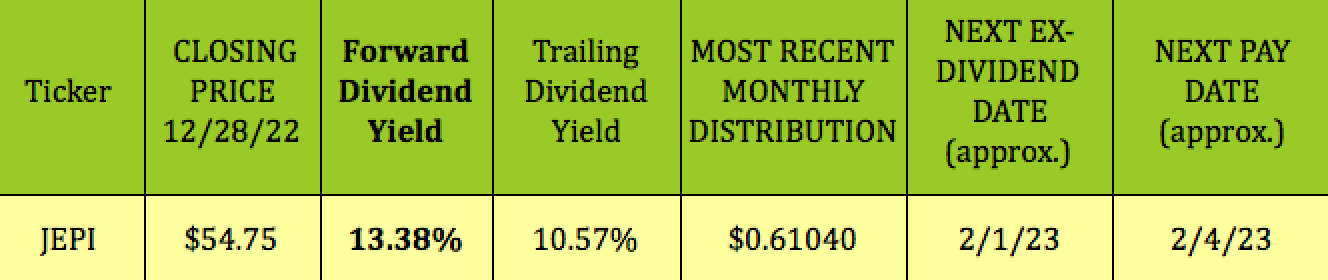
JEPI has the highest forward yield in the group, followed by XYLD, which has the highest trailing yield. ETB decreased its monthly payout from $.1080 to $.0932 in November 2022 – its forward yield is 7.54%, followed by SPXX, at 7.41%, BXMX, at 7.17%, and CII, at 6.49%:
Hidden Dividend Stocks Plus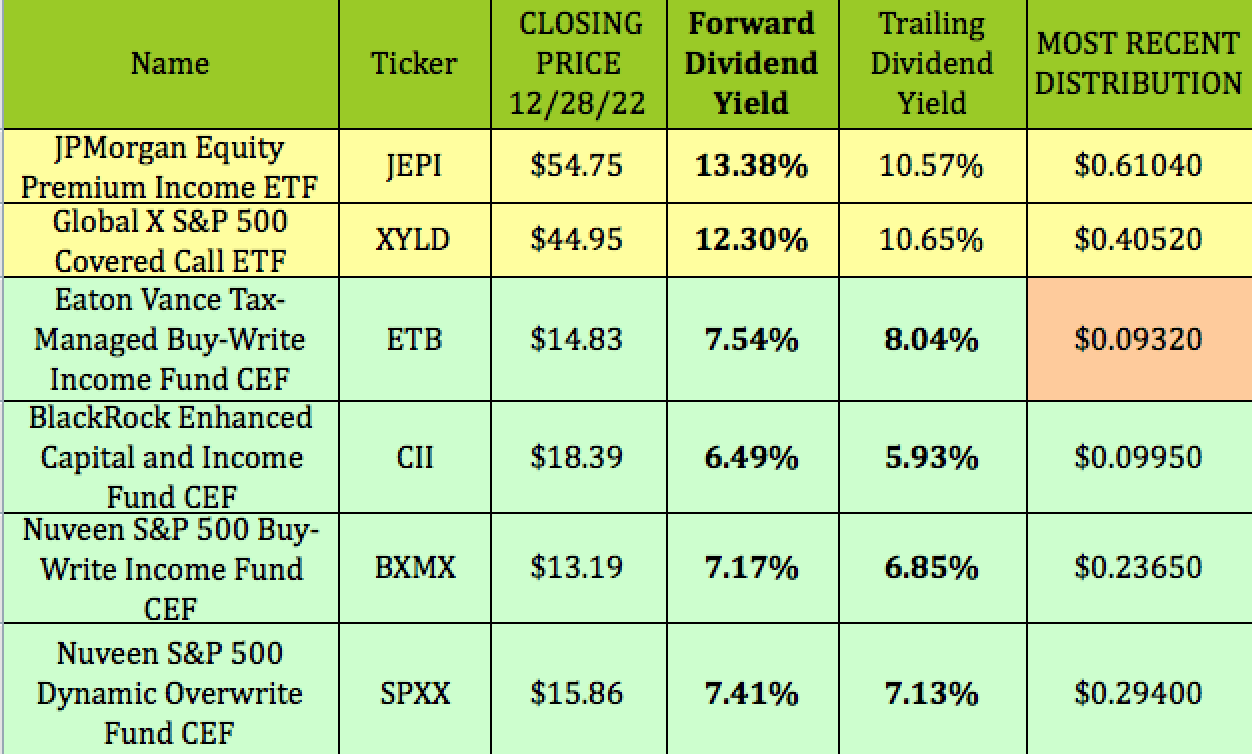
Performance:
The sector performance of the S&P 500 still shows Energy as the #1 sector in 2022, a slot it has occupied all year. Energy was up 39.6% in 2022. Utilities were #2, at -1.61%. Tech was a big loser, down ~34%.
Unfortunately, JEPI only has minimal, 2.7%, exposure to Energy. Its largest sector exposure is Industrials, at 13%, vs. an 8.6% Industrials weighting in the S&P. JEPI also had a heavier weighting in Consumer Defensive, at 11.9%, vs. 6.86% for the S&P, and Utilities, at 7.8%, vs. 2.78% for the S&P.
Those heavier-than-S&P sector weightings benefited JEPI, as those sectors outperformed the market.
On the flip side, JEPI was underweight Tech, but still held 11%, which hurt its performance, with Tech down -34%. Consumer Cyclicals, Communications Services were also underweight sectors for JEPI which fell -37% and -40%, respectively:
Hidden Dividend Stocks Plus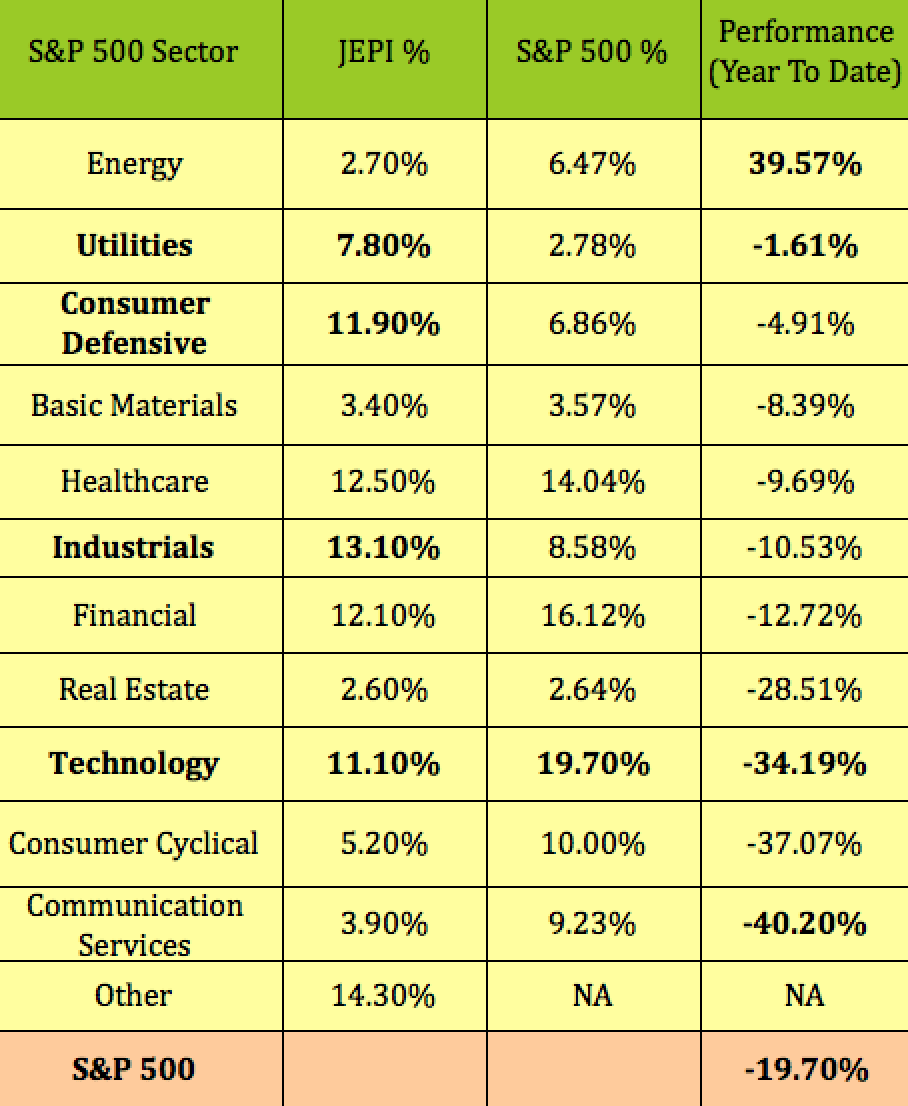
JEPI has held up the best in 2022 and over the past quarter, outperforming the market in 2022, but still down -12.49%, vs. -19.70% for the S&P, as of 12/28/22.
Hidden Dividend Stocks Plus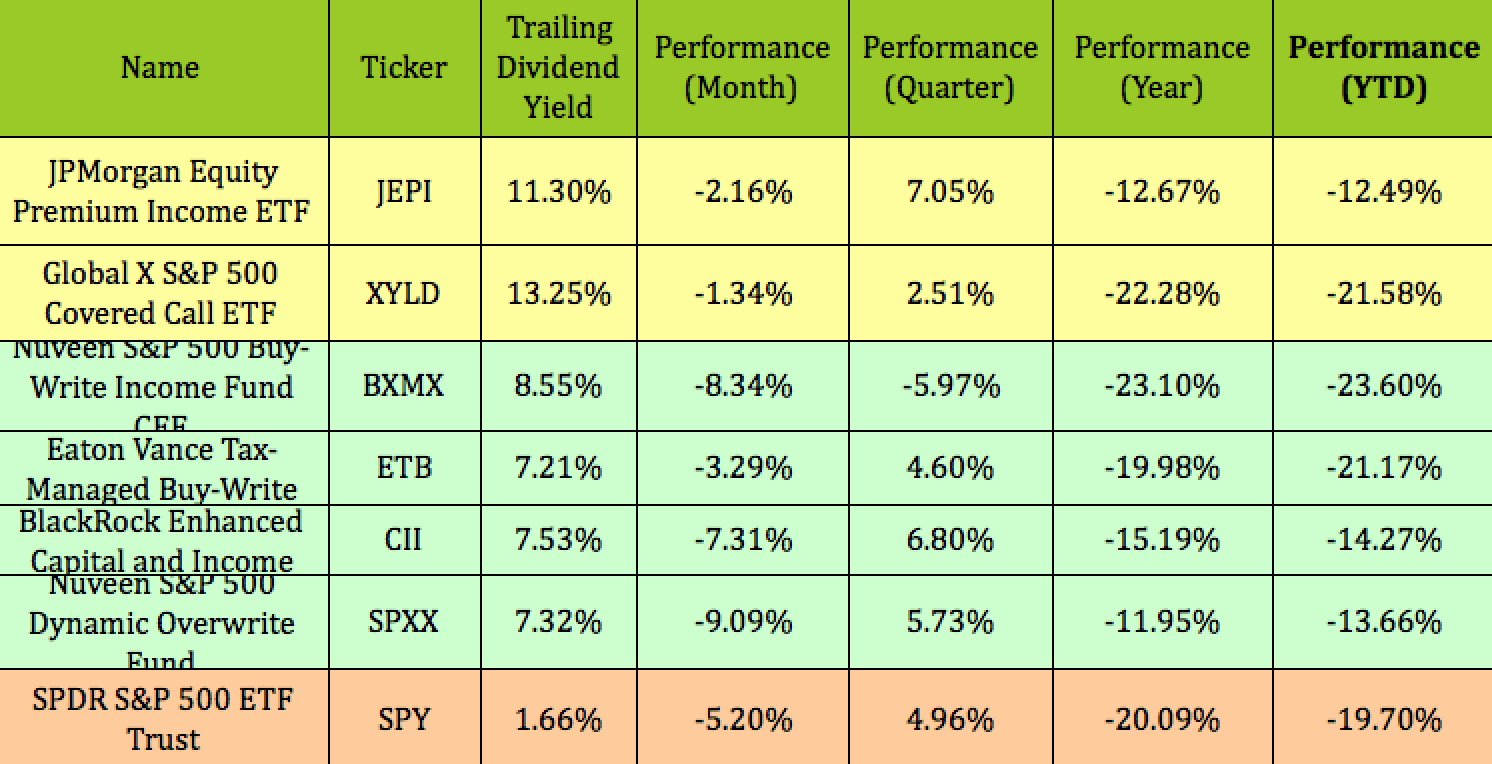
On an approximate total return basis, including its dividend yield, JEPI outperformed all of the other funds, returning ~-1.4%, vs. -18.4% for the S&P 500.
SPXX was #2, at -4.63%, followed by CII, at -7.66%, XYLD, at -9%, ETB, at -12.77%, with BXMX finishing last, at -14.55%:
Hidden Dividend Stocks Plus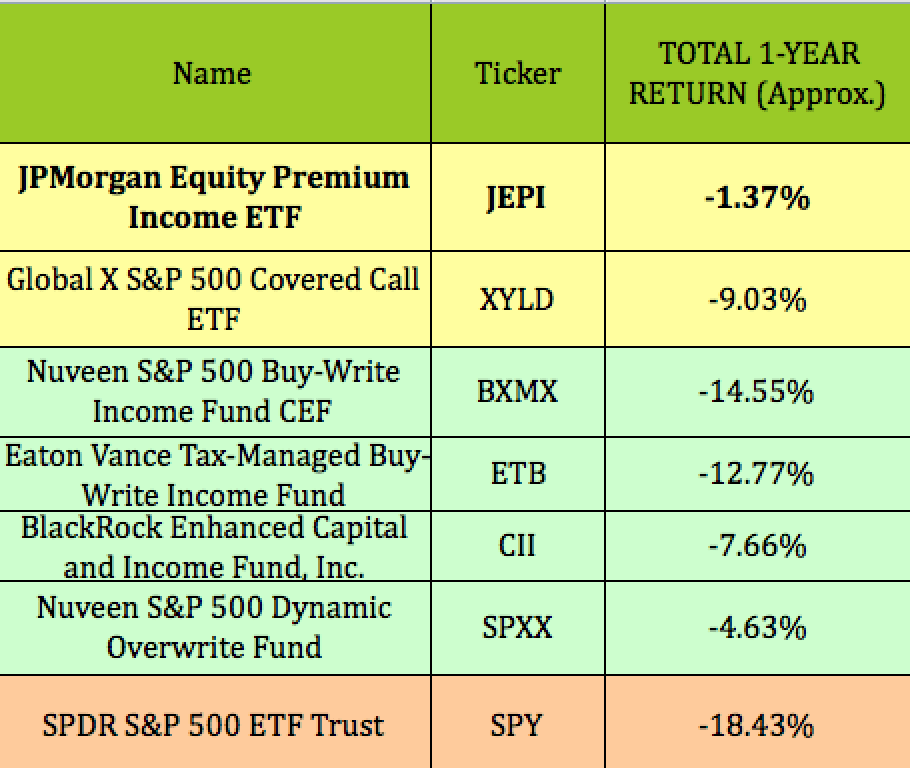
Holdings:
JEPI also invests in Equity-Linked Notes (ELNs), which it utilizes for income:
“The Fund may invest up to 20% of its net assets in ELNs. ELNs are structured as notes that are issued by counterparties, including banks, broker-dealers or their affiliates, and that are designed to offer a return linked to the underlying instruments within the ELN. ELNs in which the Fund invests are derivative instruments that are specially designed to combine the economic characteristics of the S&P500 Index and written call options in a single note form.” (JEPI site)
JEPI’s top 10 holdings include small amounts, 1.5% to 1.6%, of familiar large cap stocks AbbVie (ABBV), Bristol Myers Squibb (BMY), UnitedHealth (UNH), Progressive (PGR), Coca-Cola (KO), and Hershey (HSY), totaling ~15% of its total portfolio.
JEPI site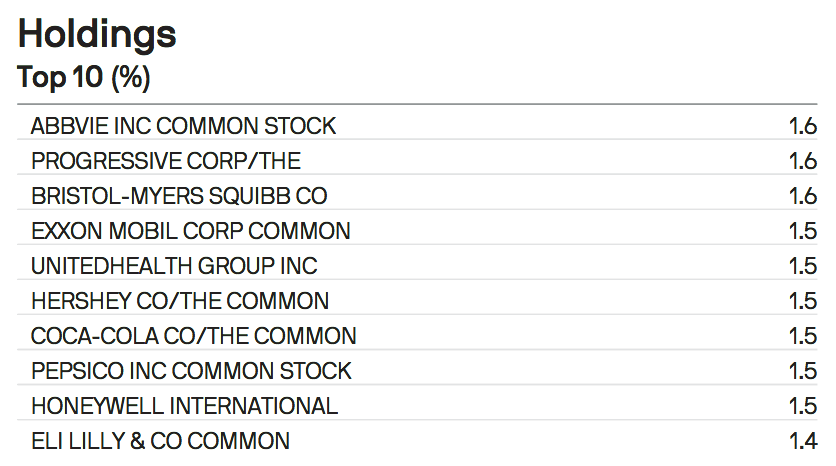
Valuations:
Unlike CEFs, ETFs generally sell at prices close to their NAV/share values, as you can see with JEPI’s and XYLD’s 12/28/22 Price/NAV.
Since CEFs can sell at wide discounts or premiums over the years, it can be a useful strategy to compare their current Price/NAV vs. their historical averages.
In this group, ETB has the biggest spread between its 12/28/22 Price/NAV of -0.31%, and its 1-, 3-, and 5-year premiums to NAV of 8.76%, 4.82%, and 4.23%.
Hidden Dividend Stocks Plus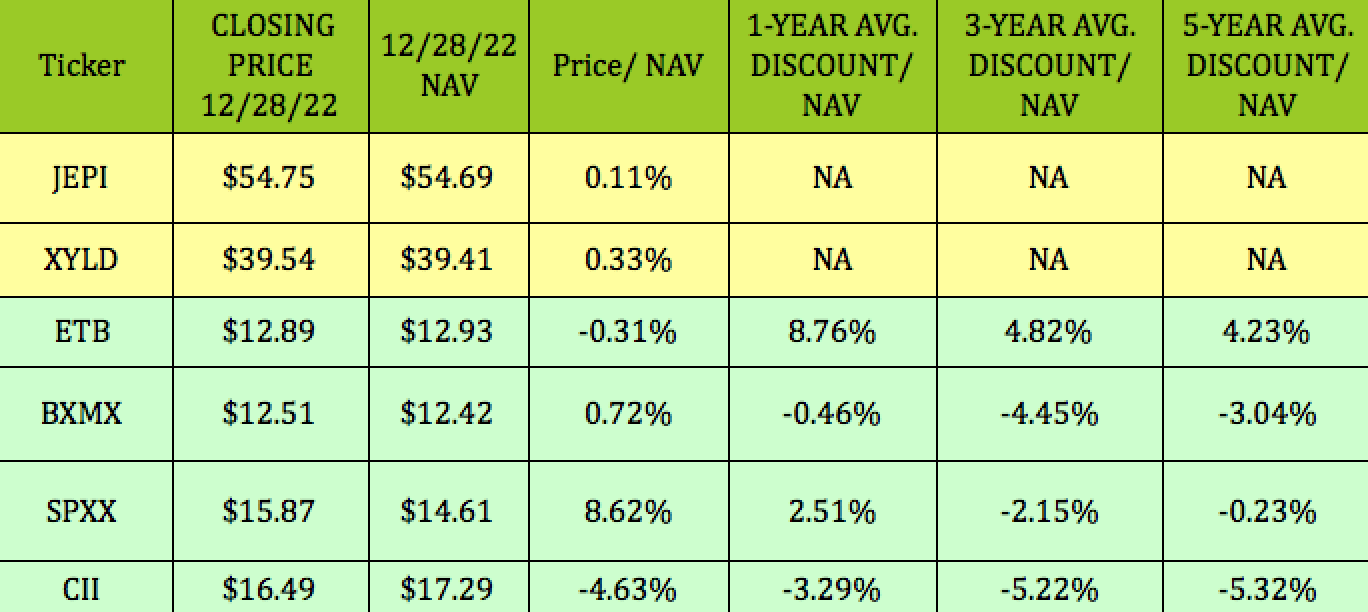
Parting Thoughts:
With the Fed looking to keep raising its rate in 2023, JEPI could be a useful tool for gaining some protection for your portfolio. However, if the Fed backs off in the 2nd half of the year, the S&P could rally, in which case, having S&P-based covered calls could crimp your upside potential.
If you have a current favorite Covered Call fund, we’d like to hear about in the comments section of this article.
All tables furnished by Hidden Dividend Stocks Plus, unless otherwise noted.
Be the first to comment