

Japanese Yen Talking Points:
Yen weakness has continued as one of the more obvious FX trends for Q4. As I had warned in the Yen Forecast the week of September’s FOMC rate decision, rates moving higher elsewhere could bring on more Yen-weakness, similar to what had shown in Q1 of this year. That theme has continued to build with both USD/JPY and GBP/JPY pushing up to fresh multi-year highs (USD/JPY to 3 year highs, GBP/JPY to five year highs). Even the Euro has gotten in on the trend with EUR/JPY gaining more than 375 pips so far this quarter, amounting to a move of 2.92%. And in AUD/JPY, the pair is re-testing a key psychological level that was already in play earlier this year, and it’s threatening a bullish breakout that could propel AUD/JPY up to its own multi-year highs.
USD/JPY
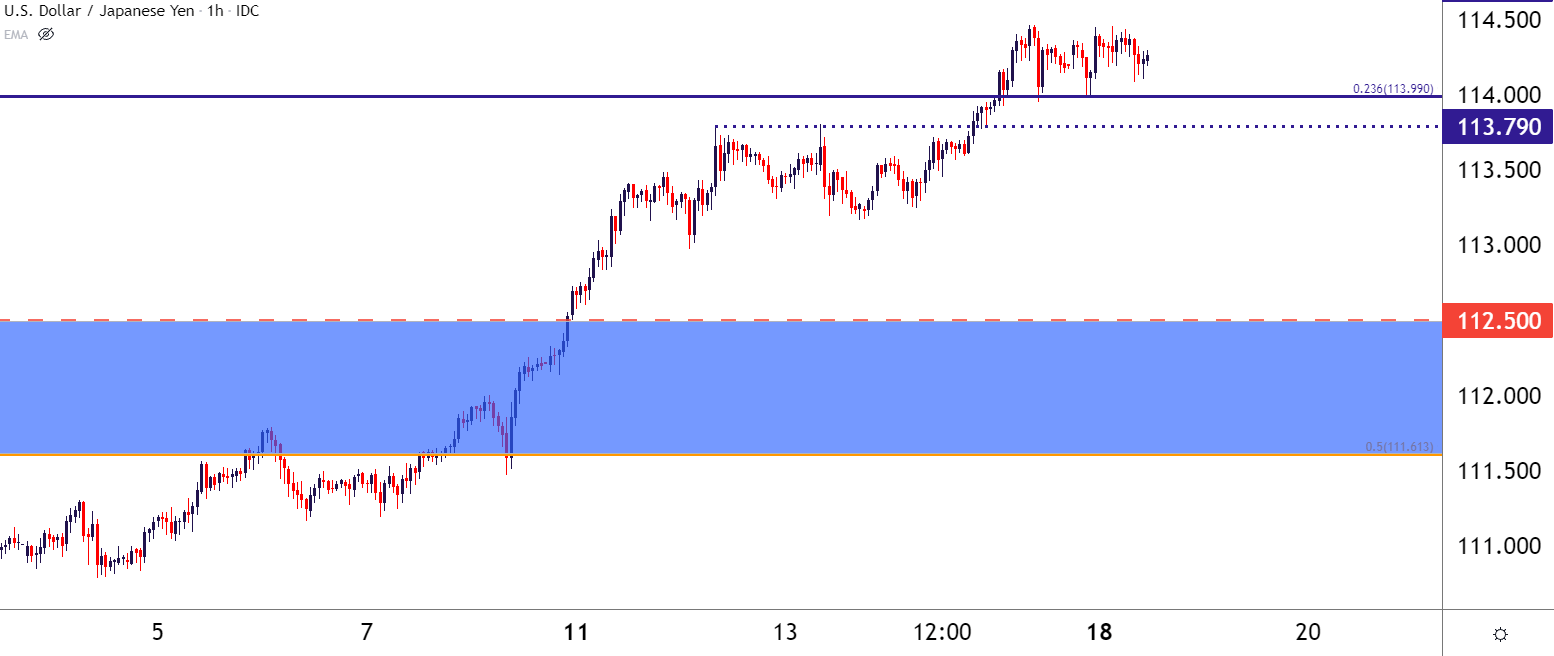
USD/JPY has gotten a lot of attention as the major pair has burst up to fresh three-year-highs. The pair has crossed a couple of major resistance zones along the way with only a minimum of slowdown in the trend, if any at all.
After that FOMC rate decision, I highlighted a resistance zone running from 111.61-112.50, and that was taken out last week. I then alerted to another area of resistance, around the 114.00 handle from which both a Fibonacci level and the three-year-high remained in tight proximity. But that, too, has already been taken-out, and on a short-term basis, we can even see buyers trying to hold short-term support at this level.
USD/JPY Hourly Price Chart
Chart prepared by James Stanley; USDJPY on Tradingview
There’s another resistance zone of note and this is one that hasn’t been broken yet: This is home of the current four-year-high, and it’s confluent with the psychological level at 115.00. This may be enough to stall the move for a bit, and there’s a couple of areas of possible support to work with.
For aggressive stances, the Fibonacci level at 114.00 can be spanned down to a prior point of swing resistance, plotted at around 113.79, and this can create a nearby zone of support potential. A bit deeper, however, is the big zone of prior resistance that hasn’t yet seen support, and this plots from 111.61-112.50. This zone held the highs in 2019, 2020 and for about three months in 2021.
USD/JPY Weekly Price Chart
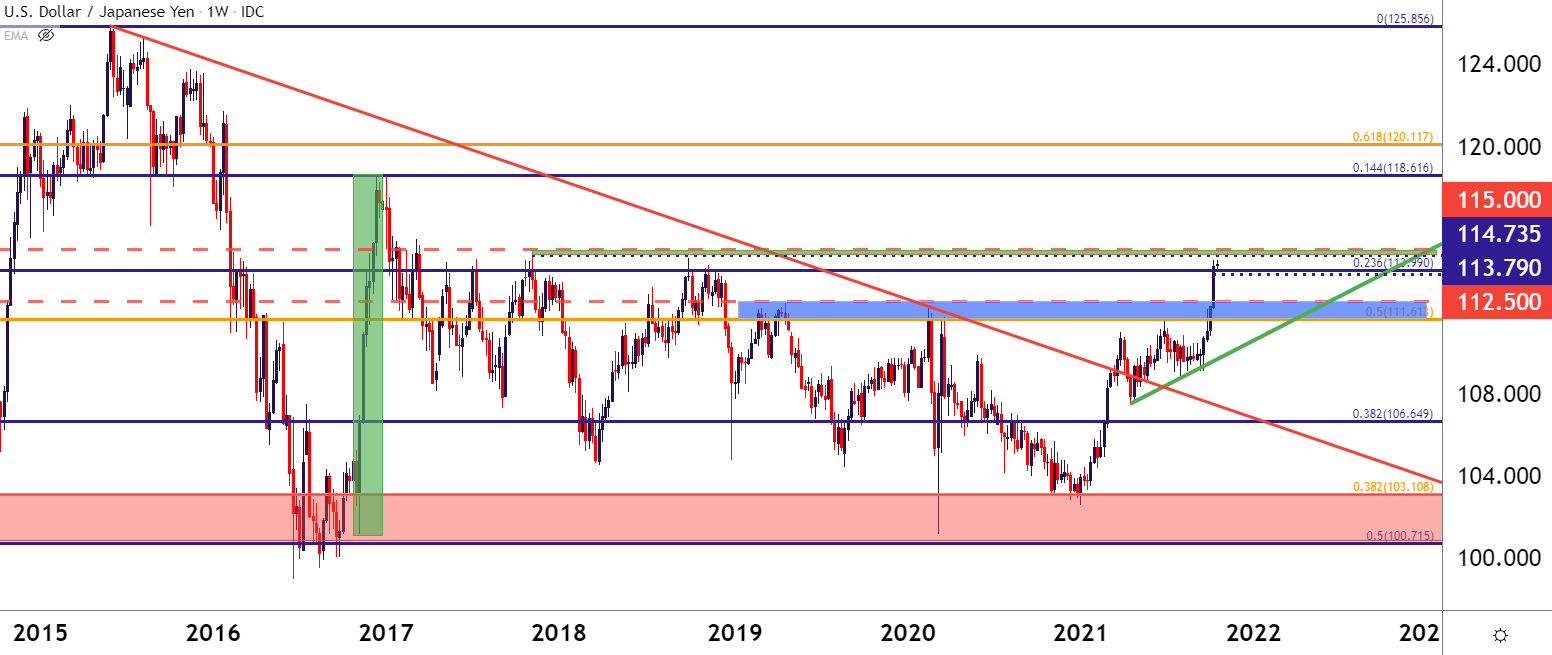
Chart prepared by James Stanley; USDJPY on Tradingview
GBP/JPY
While USD/JPY is trading at a fresh three-year-high, GBP/JPY is holding near recently established five-year-highs. There’s a very similar drive here, with the Japanese Yen being meshed up with a currency backed by stronger rates with the British Pound. Due to this rate theme, GBP/JPY was my Top Trade for Q4, looking for the bullish theme to breakout and then continue up to fresh highs, which has played out so far in the first few weeks of Q4.
Of recent, rate hike bets around the Bank of England have continued to soar, leaving even those from the FOMC in the dust as the Bank of England is expected to raise rates as many as four times before the FOMC even finishes tapering asset purchases.
This can keep GBP/JPY as an attractive topside candidate, perhaps even more so than USD/JPY which has resistance in its immediate path. For support potential, the prior 2021 high rests at 156.08 and this could function as a nearby zone, with a secondary zone a bit lower, spanning from a Fibonacci level at 154.68 up to the 155.00 psychological level.
To learn more about Fibonacci or psychological levels, check out DailyFX Education
GBP/JPY Daily Price Chart
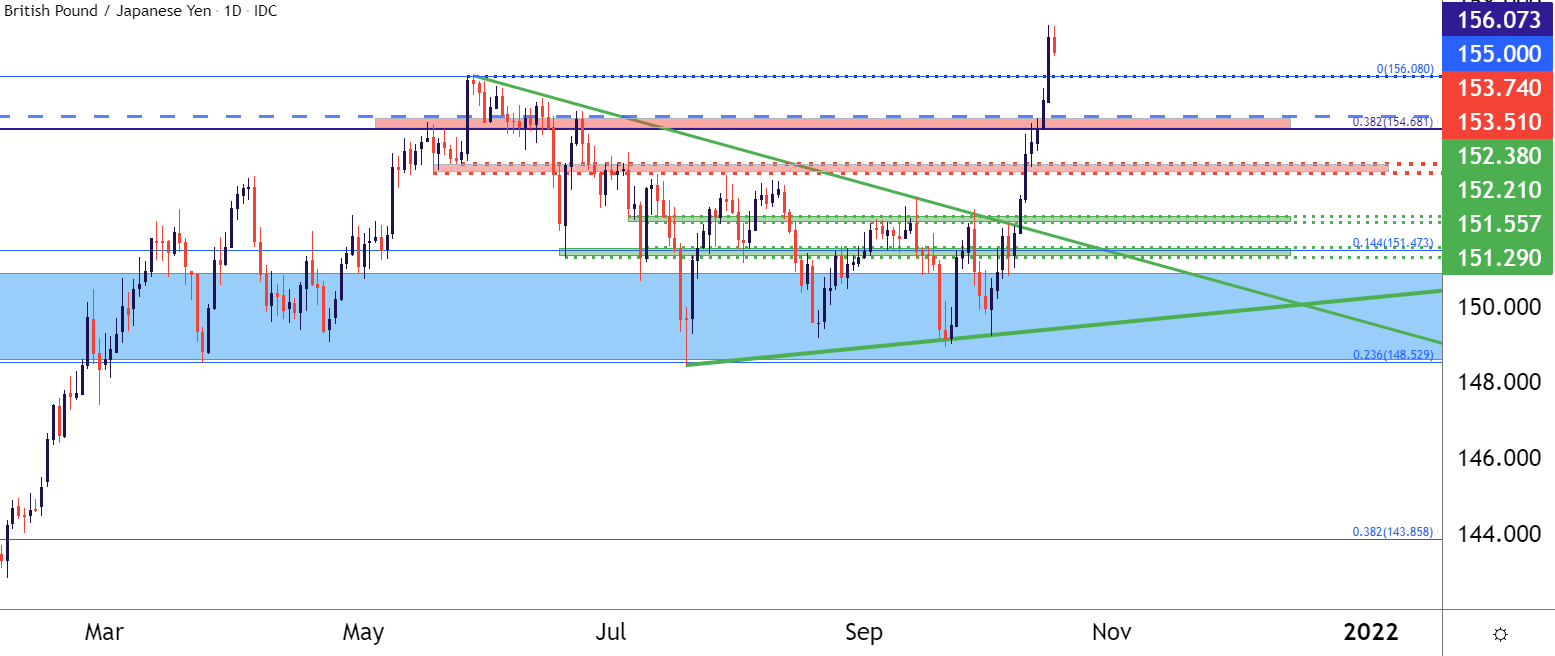
Chart prepared by James Stanley; GBPJPY on Tradingview
EUR/JPY
It’s been a pretty sour Q4 for the Euro against many major currencies. Not the Yen though, as JPY weakness has outpaced even that of the single currency.
This could, however, make for an interesting fade candidate for those that are looking for JPY-weakness to reverse. The pair had spent more than a month grinding at a big spot of long-term support, showing around the 128.52 Fibonacci level, which was confluent with a bearish trendline taken from 2008 and 2014 swing highs, and that’s led to a vigorous bounce.
EUR/JPY Monthly Price Chart
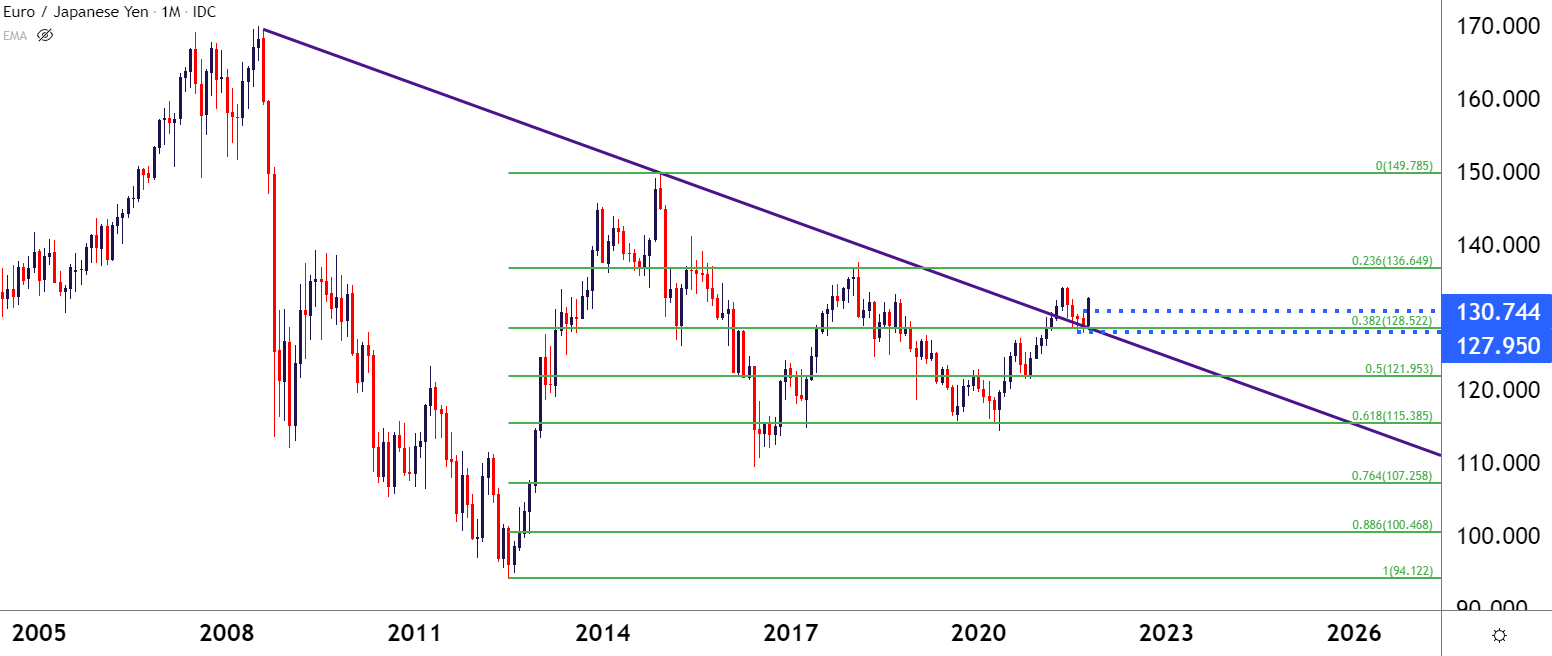
Chart prepared by James Stanley; EURJPY on Tradingview
While both USD/JPY and GBP/JPY have jumped up to fresh multi-year highs, EUR/JPY remains inside of the prior high that was set in May, and price action is right now at the 78.6% retracement of the May-August sell-off. There’s also a prior swing-low/high in the 132.67 area, and this can present some resistance that may be workable for pullback themes in this Yen trend.
EUR/JPY Daily Price Chart
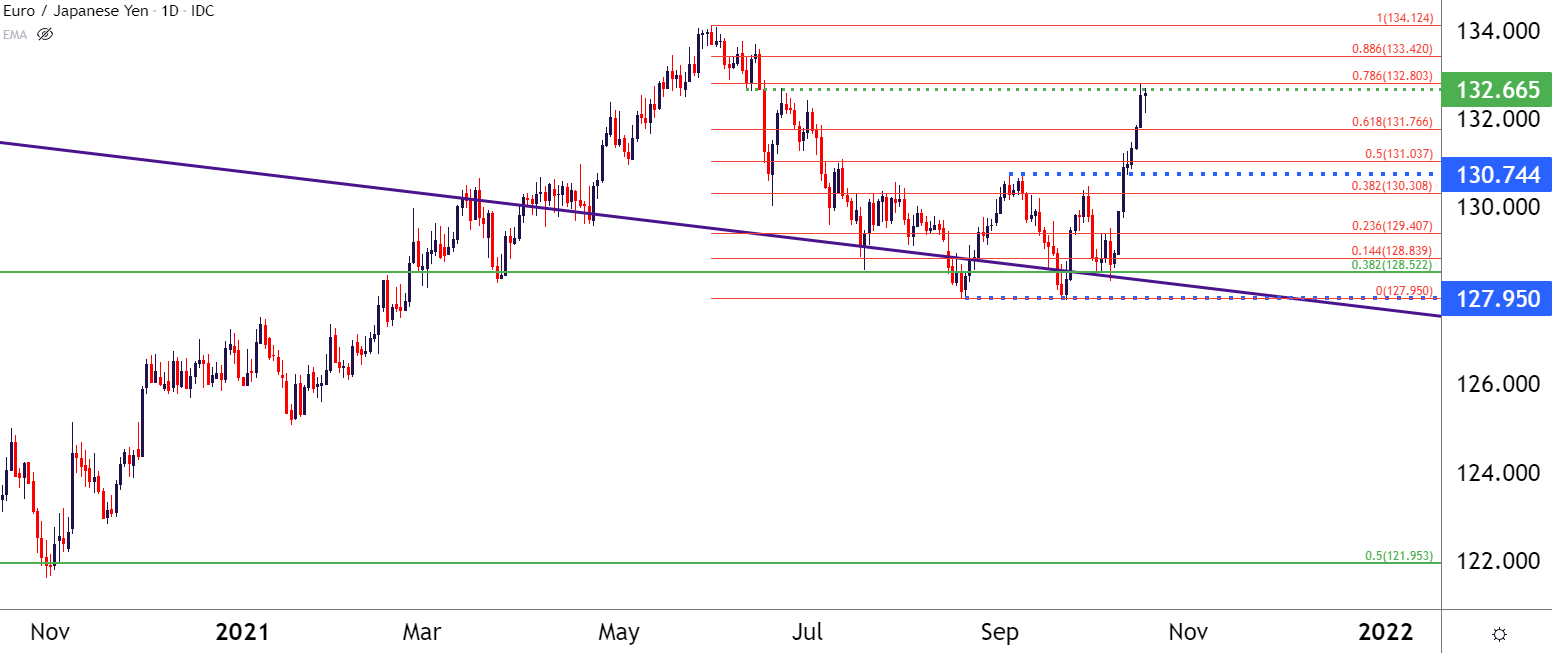
Chart prepared by James Stanley; EURJPY on Tradingview
AUD/JPY: Back for the Breakout
Back in February I had highlighted an inverse head and shoulders pattern brewing in AUD/JPY. At the time, the pair was testing resistance around the 80 level after having been unable to mount above that price over the prior few years.
This breakout was being driven by a similar rates theme in Q1, and that setup filled in with AUD/JPY jumping up to the next major psychological level at the 85-handle. That 85 level, however, was not ready to give way, and this showed up as resistance for four consecutive months before buyers threw in the towel and prices in AUD/JPY pushed all the way back down to the 78.00 level.
But, as JPY weakness has come back with aggression, AUD/JPY has shot right back up to the same 85-handle that bulls likely don’t remember so fondly. This does keep breakout potential in the pair, however, with a push beyond the 85.81 inflection point bringing on fresh three-year-highs to the pair.
AUD/JPY Weekly Price Chart
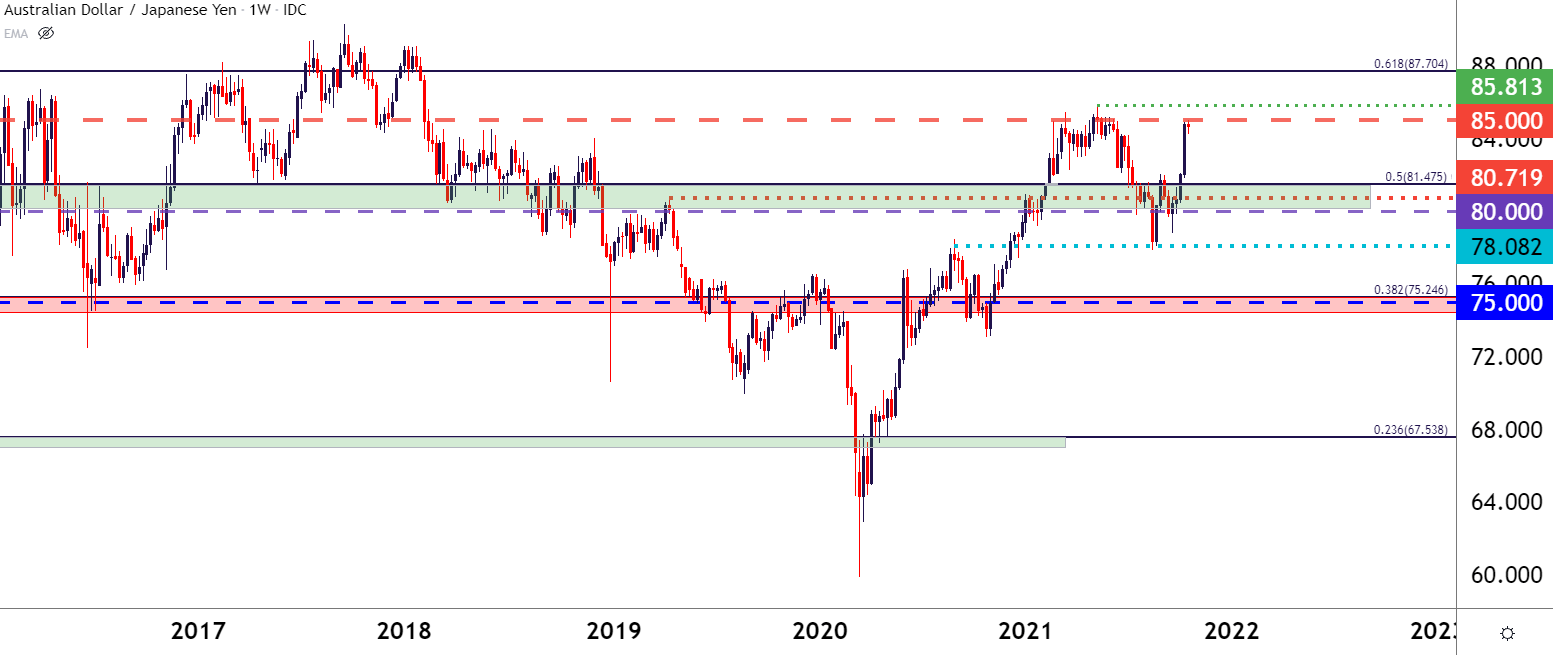
Chart prepared by James Stanley; AUDJPY on Tradingview
— Written by James Stanley, Senior Strategist for DailyFX.com
Contact and follow James on Twitter: @JStanleyFX
Be the first to comment