

Shahid Jamil
The United States is obviously home to some of the most innovative and profitable technology companies on the planet. However, when it comes to the semiconductor sector, the two leading companies – from a purely technological perspective – are based in Taiwan and Korea: Taiwan Semiconductor (TSM) and Samsung (OTCPK:SSNLF)(OTCPK:SSNNF), respectively. That being the case, today I will take a close look at the iShares Global Tech ETF (NYSEARCA:IXN) to see if it might be a good technology addition for investors looking to build and maintain a well-diversified portfolio.
Investment Thesis
It is important for investors to understand one of the primary difference that exists between companies lumped into the “semiconductor sector”. Some of these companies actually manufacture semiconductor chips (i.e. foundries), and some of these companies are “fabless” – that is, they specialize in chip-design and outsource the actual fabrication of the chips to foundries. A third category within the semiconductor sector is the semiconductor equipment companies.
The semiconductor industry was founded in the United States (one reason for the “Silicon Valley” moniker), yet over time the U.S. has outsourced more and more of its semiconductor needs to Asia. Indeed, today the U.S. produces only an estimated 10% of global semiconductor capacity. And from a technology perspective, TSMC and Samsung are arguably at the top of the pyramid and are currently fabricating and delivering the highest performance silicon for companies like Apple (AAPL) and Nvidia (NVDA), who are very much reliant on foreign semiconductor companies for their high-end products.
The good news is that the Biden administration recently pushed the “CHIPS & Science Act of 2022” through Congress and President Biden signed it into law. The CHIPS Act not only contains $52.7 billion to boost U.S. chip production over the next five years, but also an additional 25% investment tax credit for semiconductor plants that is expected to be worth an estimated $24 billion over the next 10-years. However, as most of you know, it takes years to build and bring a new state-of-the-art semiconductor fab online. Meantime, the sad fact is that Asia dominates semiconductor production:
Visualcapitalist.com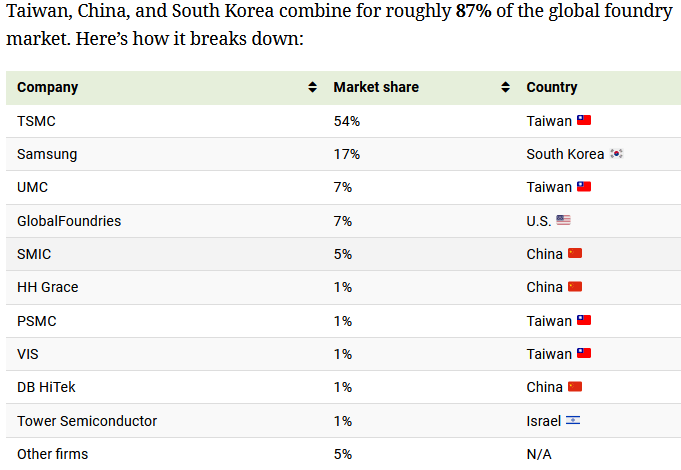
Source: VisualCapitalist.com
Semiconductors are obviously a very important sub-sector of technology, but there are many others as well (software, networking, IoT, clean-tech etc.). As a result, investors wanting a well diversified tech ETF might be interested in a tech fund – like IXN – that invests globally.
Today I will take a close look at the iShares Global Tech ETF to see if it might be a good tech addition for an investor desiring to hold a well diversified – and global – tech portfolio and how the ETF has positioned the investor for success going forward.
Top-10 Holdings
The top-10 holdings in the IXN ETF are shown below and equate to what I consider to be a relatively concentrated 59.3% of the entire portfolio:
iShares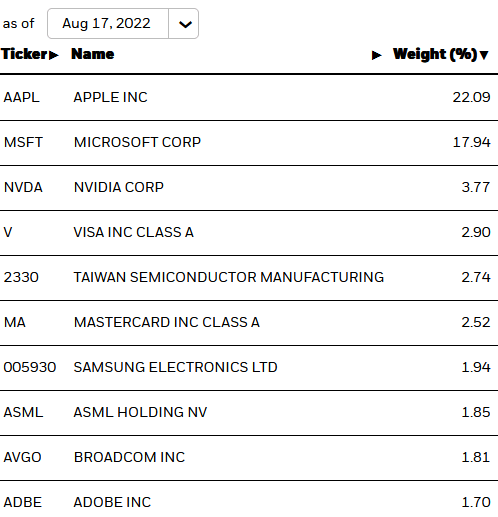
Source: iShares IXN ETF Webpage
Not surprisingly, the fund is well represented by U.S. companies and, in aggregate, the top-two holdings alone – Apple and Microsoft (MSFT) account for ~40% of the entire portfolio. That being the case, investors interested in diversifying their portfolio, and who already hold a significant stake in Apple and/or Microsoft, should probably take a pass on the IXN ETF. That said, it’s hard to argue with the long-term track record of either of these two companies, the significant free-cash-flow they continue to generate, and their very strong market positions.
The #3 holding with a 3.8% with is Nvidia, a fabless chip-designer (mostly in graphics, networking, and compute) that also has evolved into a leading provider of AI/ML technologies. Nvidia recently dropped ~50% below its 52-week high. Earlier this month, NVDA shares dropped sharply after its quarterly report showed a 19% yoy decline in revenue as its gaming-related business disappointed (-33% yoy). However, data center revenue rose 61% yoy to $3.81 billion. Nvidia typically orders its highest-performance chips from TSMC, but in July it was reported that the company wanted to reduce orders for TSMC’s 5nm wafers due to lower demand for its GeForce RTX 40 series GPUs.
Payment processors Visa (V) and Mastercard (MA) are the #4 and #6 holdings with an aggregate weight of 5.4%. Personally, I view these companies to be more in the financial sector than the technology sector, and would prefer to see more technology-centric companies in the top-10 holdings.
We finally get to the top semiconductor foundry company, TSMC, with the #5 holding and a 2.7% weight. For a “global tech ETF” to have such a small weight in arguably the most important semiconductor company on the planet is, well, irrational in my opinion. I feel the same way for the small 1.9% weight of #7 holding Samsung, which is arguably the semiconductor company that is closest on the heels of TSMC from a semiconductor process perspective.
The #9 holding is Broadcom (AVGO), which is one of my favorite companies in the technology sector – see Broadcom Cements Its Status As The Best Dividend Growth Stock. Broadcom has what I consider to be the best high-speed networking development platform (hardware & software), generates tons of free-cash-flow, currently pays a $16.40/share annual dividend, and has committed to $10 billion to share buybacks this year. Meantime, the company has made a bid for VmWare in order to continue diversifying and growing its high-margin enterprise software segment.
The top-10 holdings is rounded out by Adobe (ADBE), a global software provider that operates a SaaS-based business model though its Creative Cloud subscription service. Like many high-flying software companies, ADBE is significantly off its 52-week high (~40%) yet still trades at a relatively lofty forward P/E = 32x.
Overall, the IXN portfolio has the following allocation across the tech sector:
iShares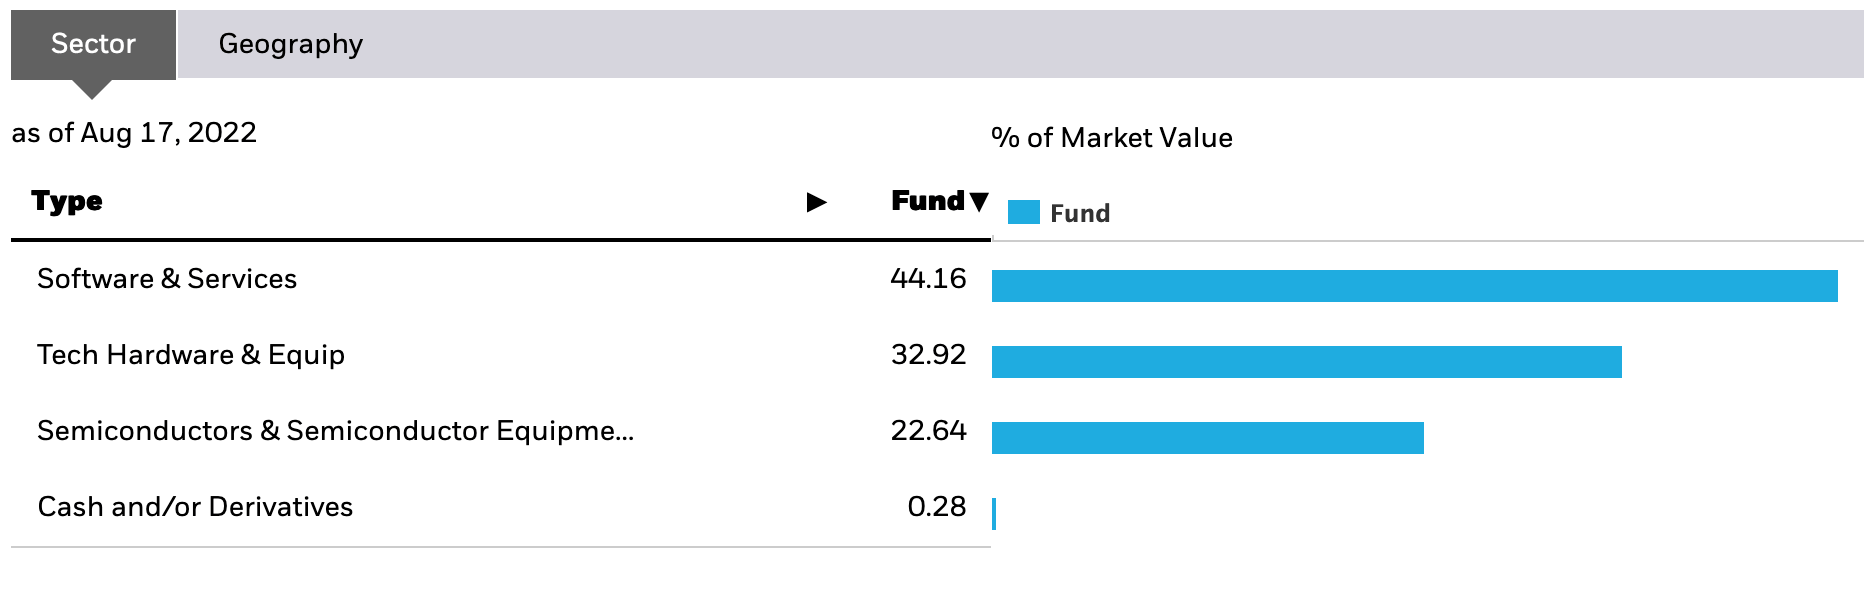
As can be seen in the graphic, the IXN ETF is heaving weighted toward the software sub-sector, while semis equate to only 22.6% of the fund.
The following ETF and valuation metrics were taken directly from the iShares IXN ETF webpage:
- Expense Ratio: 0.40%
- Net Assets: $3.55 billion
- # Holdings: 132
- 30-day yield: 0.64%
- P/E Ratio: 27.3x
- Price-to-Book: 6.95x
As can be seen, the fund’s expense ratio is relatively high as compared to the most cost-efficient funds, but not overly so considering the ETF invests directly in foreign companies on foreign exchanges. The fund holds 132 companies and – with $3.55 billion in assets – and is therefore relatively highly liquid. Considering the relatively low yield, the primary investment thesis in the IXN ETF is capital appreciation, not income. Lastly, and like most tech funds, the valuation metrics of the IXN ETF trade at a significant premium to the S&P500 (P/E=21.4x, P/B=4.2x).
Performance
The average annual total returns of the IXN ETF are shown below:
iShares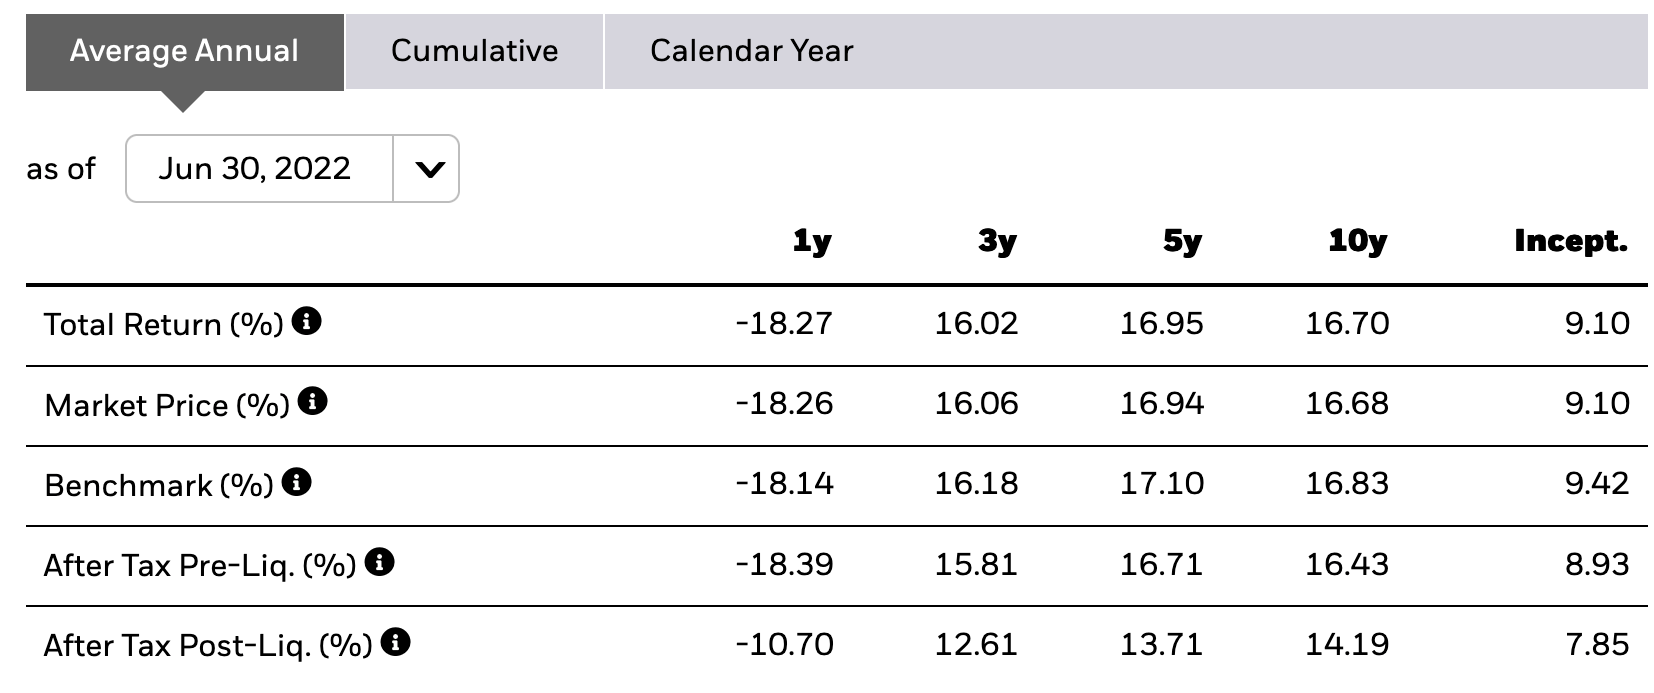
As can be seen in the graphic, and not unsurprisingly, the ETF has performed poorly over the past year and during the 2022 bear market, yet has a strong 16.7% average annual return over the past decade.
The graphic below compares the five-year relative price-returns of the IXN ETF against the broad market averages of the S&P500, DJIA, and QQQ as well as tech funds like the Fidelity MSCI Information Technology ETF (FTEC) and the VanEck Semiconductor ETF (SMH):
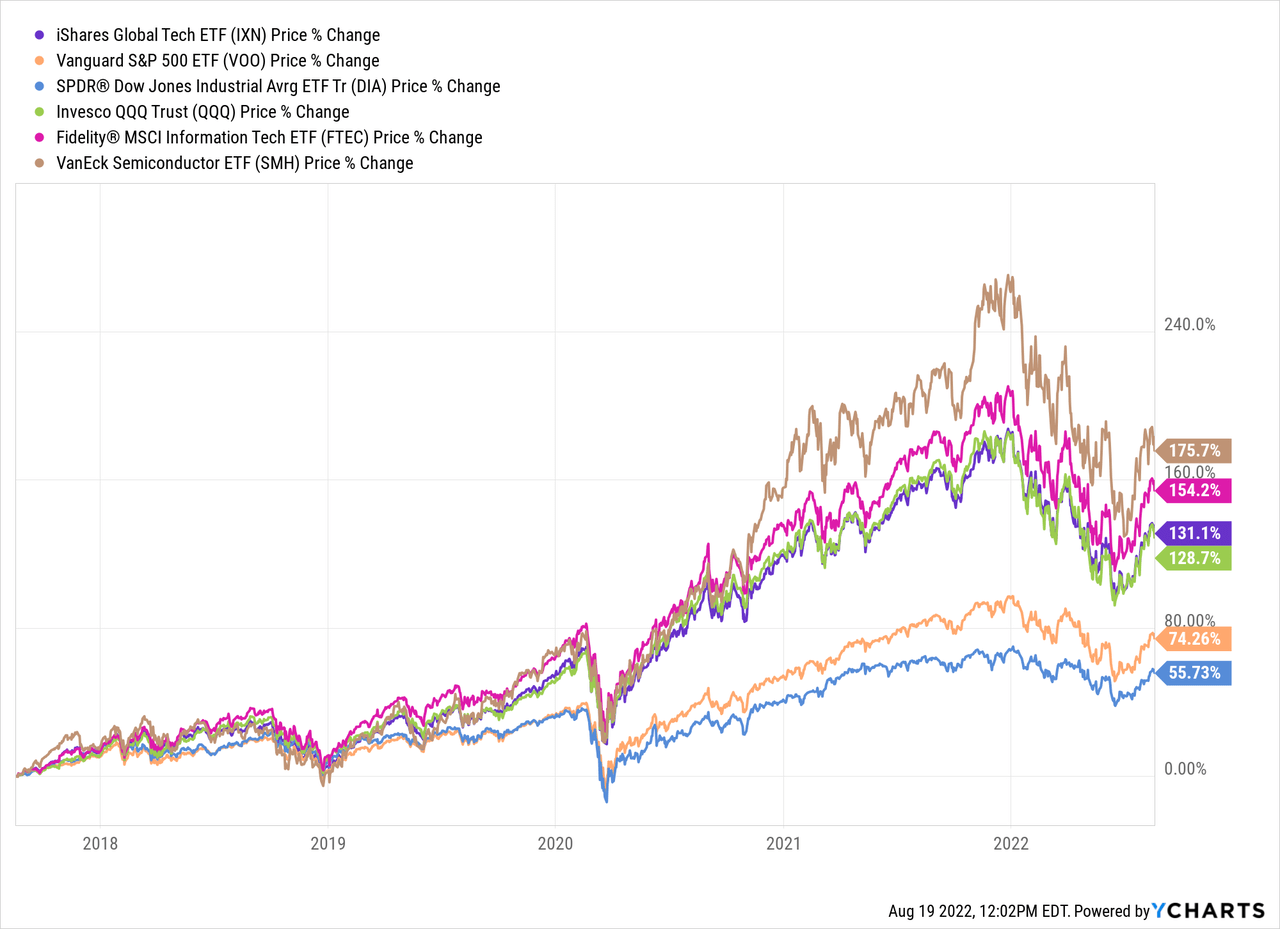
As can be seen from the graphic, while the IXN ETF compares very favorably with the broad market averages, it has significantly lagged the FTEC and SMH ETFs.
Risks
The IXN is certainly not immune to all the current macro-level investment risks: high inflation, the outlook for higher interest rates, and the impact of Putin’s horrific war-of-choice on Ukraine which has, effectively, broken the global energy & food supply chains. Any or all of these could cause a global economic slowdown and/or a global recession that would, obviously, put downward pressure on IXN shares.
IXN’s high allocation to the still highly-valued software sector represents a generally higher risk/reward opportunity as compared to the broader market as represented by the S&P500. That said, the high weighting in tech stalwarts Apple & Microsoft generally offsets much of that risk.
China’s increasingly militaristic stance is an on-going threat to countries in the region – like Taiwan and Korea – that are home to some of the best semiconductor fabs on the planet and owned by a couple of the companies in IXN’s top-10.
Summary & Conclusion
A global technology fund that can invests in the semiconductor sector in Asia seems like a good idea. However, the IXN ETF doesn’t allocate much capital to the leading semiconductor companies in Asia and although it has a solid long-term performance track record, it is not sufficiently differentiated from other technology funds to rationalize a purchase (at least not for me, personally). In addition, I don’t like the high weighting given to card payment companies like Visa and Mastercard. That being the case, I am going to stick with my main technology ETFs (FTEC & SMH) and take a pass on the IXN ETF. After all, FTEC has a significantly lower expense ratio (0.07%) while the SMH ETF currently has a 10.6% weight in TSMC and also a smaller expense ration (0.35%). Lastly, both of these funds have significantly outperformed the IXN ETF over the past decade. While the IXN ETF isn’t a good fit for my portfolio, and I can’t recommend investors initiate a position in the fund, if you already own shares, I would HOLD onto them, primarily for the rather large stakes in Apple & Microsoft.
Editor’s Note: This article covers one or more microcap stocks. Please be aware of the risks associated with these stocks.
Be the first to comment