


LunaKate/iStock via Getty Images
The iShares Micro-Cap ETF (NYSEARCA:IWC) has a straightforward investment strategy revolving around the smallest names in the U.S. equity universe.
To begin with, the allure of this vehicle is that the micro-size companies are oftentimes overlooked by the Street (e.g., they get little to no coverage from analysts) which together with soft liquidity results in a perfect amalgamation rich with mispriced opportunities. Value investors’ paradise, a seemingly perfect place to be amid the perfect storm the high-growth echelon has been engulfed in this year.
The flip side of this approach is that the quality discount is a serious threat in this universe, which easily outweighs the attractiveness of valuations. Micro-caps are so small for a reason, in most cases the one being lackluster financial performance and uncertainty over expansion prospects (which is especially acute in the case of early-stage biotechs). And here, I believe investing more time in research to find the best fish in this pond is needed to avoid exposure to the worst-quality stocks with risks of diminishing market value or even delisting (since we are talking about names that sometimes have just a few $10s million in market value). We will return to the value/quality question shortly.
The previous time I covered IWC was in May 2022, and there are a few reasons why this ETF deserves a second look today.
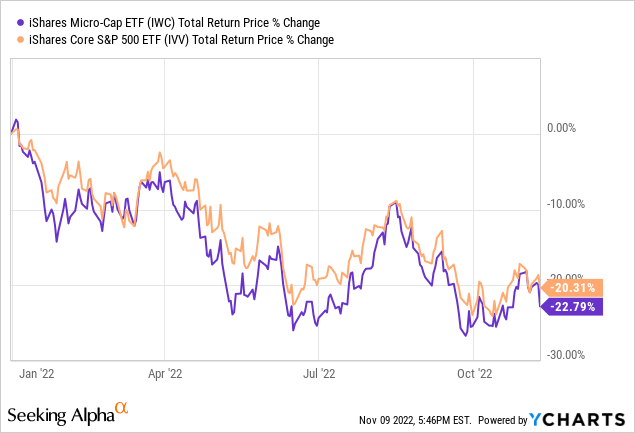
- First, since my note, IWC has somewhat surprised to the upside, declining by just 6.8% while the S&P 500 is down by 9.2%, even though I expressed a pessimistic view, expecting the capital scarcity issue (engendered by higher interest rates) to affect the micro-cap ETF to a greater extent than IVV. It is necessary to explain whether I should become more optimistic about the vehicle as a consequence.
- Second, IWC tracks the Russell Microcap Index, which is a mix of “the smallest 1,000 securities in the small-cap Russell 2000 Index” with “the next 1,000 smallest eligible securities by market cap.” It is rebuilt completely every year, together with other benchmarks from the Russell index family, with changes implemented in June (more details on this complex process are available on the FTSE Russell website). So it would be interesting to compare the portfolios from May and November to check whether meaningful shifts in exposure occurred upon the reconstitution.
Let us begin with the current portfolio composition. A few meaningful changes since May can be observed. More specifically, around 360 holdings with ~18.4% weight were added since then, while 357 were removed. The top ten additions (weights as of November 7) are as follows.
| Name | Weight, % |
| STELLAR BANCORP INC (STEL) | 0.360 |
| AMYLYX PHARMACEUTICALS INC (AMLX) | 0.260 |
| FRANKLIN BSP REALTY TRUST INC (FBRT) | 0.250 |
| WABASH NATIONAL CORP (WNC) | 0.250 |
| SUNOPTA INC (STKL) | 0.250 |
| RHYTHM PHARMACEUTICALS INC (RYTM) | 0.240 |
| PIEDMONT LITHIUM INC (PLL) | 0.230 |
| DIAMOND OFFSHORE DRILLING INC (DO) | 0.230 |
| CARS.COM INC (CARS) | 0.230 |
| VERVE THERAPEUTICS INC (VERV) | 0.230 |
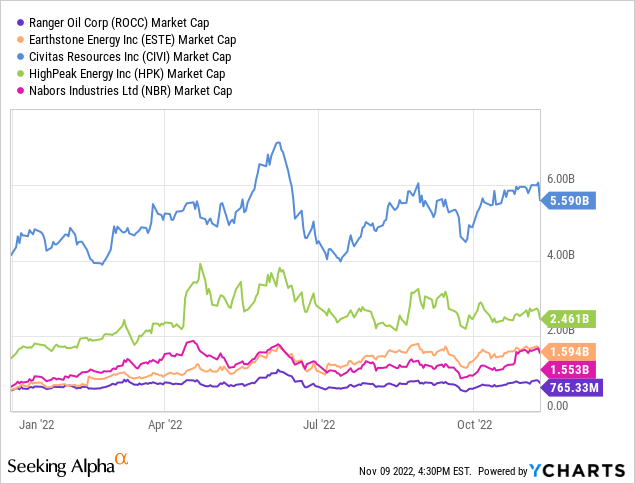
The next table provides the key ten removals; for better context, I have also added market caps (as of November 8) to illustrate that these players barely fit into a micro-size stocks portfolio, so their removal looks totally rational.
| Market cap, $B | Name | Weight, % |
| 4.17 | LANTHEUS HOLDINGS INC (LNTH) | 1.1 |
| 6.00 | CIVITAS RESOURCES INC (CIVI) | 0.78 |
| 3.07 | ALPHA METALLURGICAL RESOURCES INC (AMR) | 0.74 |
| 2.93 | ARCH RESOURCES INC CLASS A (ARCH) | 0.64 |
| 3.88 | PEABODY ENERGY CORP (BTU) | 0.55 |
| 1.55 | VERITIV CORP (VRTV) | 0.49 |
| 2.75 | NORTHERN OIL AND GAS INC (NOG) | 0.45 |
| 2.33 | CONSOL ENERGY INC (CEIX) | 0.44 |
| 1.96 | WARRIOR MET COAL INC (HCC) | 0.44 |
| 1.69 | TELLURIAN INC (TELL) | 0.42 |
I should also note that a few energy (exploration & production, oilfield services & equipment, and the like) names left the portfolio thanks to extremely supportive macro factors that supercharged the WTI price rally and catapulted their market values earlier this year. The examples of such players that IWC no longer holds are below.
In the current iteration, IWC is heavy in healthcare stocks (27.6%, principally owing to small-size early-stage biotechs) and financials (21.3%, the vast majority of which being regional banks). In May, financials had greater weight (20.9%), with healthcare in second place (~20%).
Turning to the size factor, the weighted-average market cap of the portfolio is currently around $689.8 million, with the median at $211 million. So the fact is, the portfolio is tilted toward small-caps, with the true representatives of the micro-cap league (market value south of $300 million) having just 21% weight. For context, the weighted average was ~$814 million in May.
Now, since we understand that the portfolio was recalibrated deeply, we should answer two other questions, on value and quality, the key ingredients of successful investing in the hawkish era.
In fairness, I would not say I am totally satisfied with IWC’s valuation. For example, less than 33% of the portfolio has a B- Quant Valuation rating or better; this is 4% lower compared to May. This is much better compared to bellwether vehicles like IVV, which invest principally in names valued at a premium, though still too small to say the basket is priced ideally. It should be noted that the weighted-average Price/Sales ratio of this portfolio is slightly below 1x, which is fairly attractive; to arrive at this figure, I divided the total market cap by the total revenues of all the holdings. Yet this is more likely the direct consequence of the low-quality discount.
And to corroborate, only 31% of IWC have a B- Profitability rating and better; For cash-focused investors, it should be additionally mentioned that 38% of the holdings (without financials, for obvious reasons), failed to deliver a positive net operating cash flow in the last twelve months, let alone FCF. Of course, this mix is too risky for my taste.
Performance: not that bright
As I said above, IWC has outperformed IVV since my May note, yet when looking at the bigger picture, the ETF does not look that successful.
This year, when inflation translated into higher rates and higher rates engendered the higher cost of capital and subsequent compression of multiples, it has not been unscathed. So since the beginning of 2022, it has trailed IVV.
Next, IWC’s past performance is barely supportive of a bullish view, since investors have not been rewarded for holding low-quality micro-size stocks since IWC’s inception. The CAGR the ETF has delivered during the September 2005 – October 2022 period is just 5.9% vs. IVV’s 9%. Other timeframes are barely supportive as the 10-year CAGR is at 9.6%, ~3% lower than IVV’s; the 5-year rate of 4.9% is 2.1x lower compared to the S&P 500 ETF and ~2.1% below the return the iShares Core S&P Small-Cap ETF (IJR) delivered.
Looking at annual performance, I still see no reasons for optimism, even though IWC outperformed IVV in 2010, 2012, 2013, 2016, and 2020 (surprisingly).
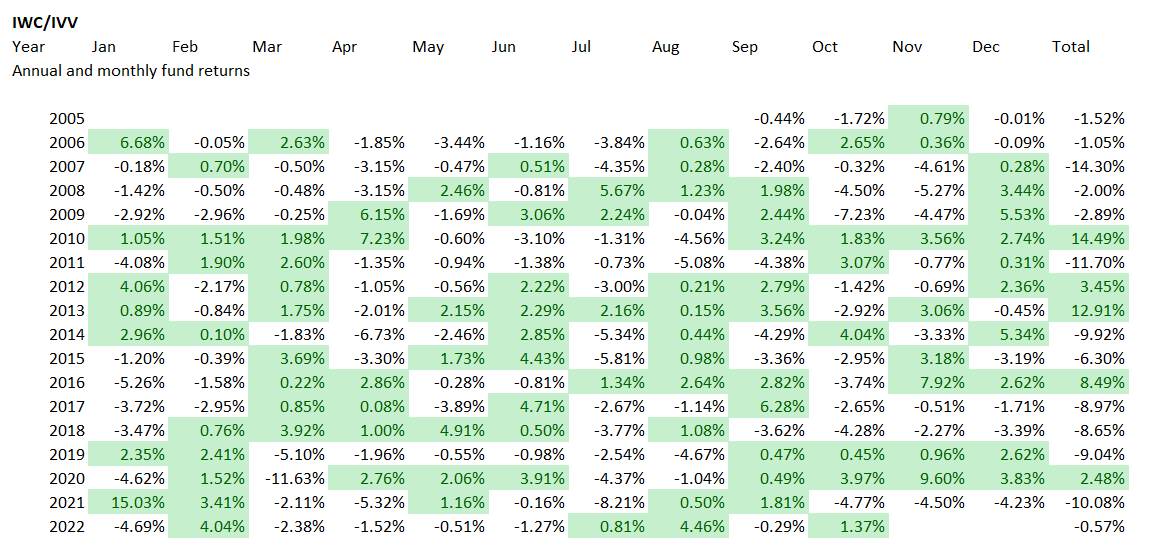
Created by the author using data from Portfolio Visualizer
Final thoughts
Anecdotal evidence suggests that micro-caps are an interesting high-risk mid-to-low quality story that could translate into steady long-term returns owing to them gradually amassing growth and quality premia.
I would be less enthusiastic here. In my view, IWC is a just quality-light ETF with comparatively high volatility and lackluster past performance.
That said, I see little reason for investing in a micro-size equities basket since it involves too much risk stemming from such portfolios being saddled with lackluster-quality companies. It does not mean micro- and small-caps are to be avoided. What is necessary is more research and more attention paid to fundamentals to fund value and quality. It is worth being pickier.
Be the first to comment