

Start of house construction in Florida kschulze
Introduction
I recently analyzed a residential homebuilder company called M/I Homes (MHO). It got me curious about the overall homebuilding sector. So in this article, I share my bullish opinion on the iShares U.S. Home Construction ETF (BATS:ITB), which tracks U.S. companies that build residential homes.
A Contrarian View
I notice that being bullish is quite a contrarian view as most Seeking Alpha authors have had ‘Sell’ and ‘Strong Sell’ ratings on ITB and the broader Homebuilding sector:
Bearish Sentiment of Seeking Alpha Authors (Seeking Alpha)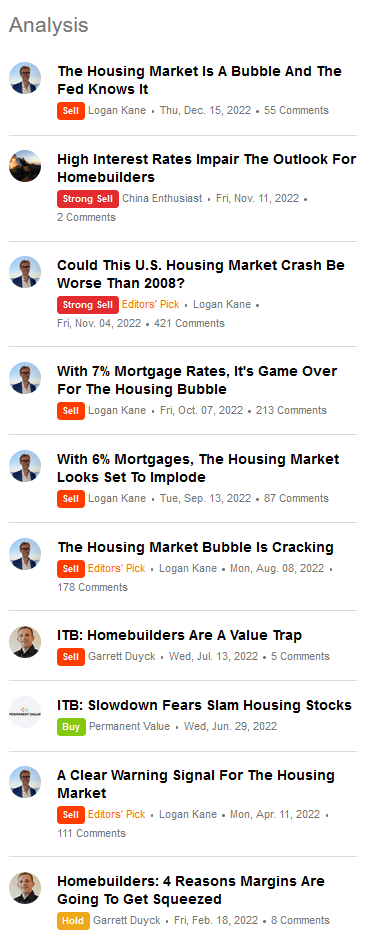
My view is more aligned with Seeking Alpha’s Quant Ratings, where ITB is ranked #1 in its subclass of Consumer Cyclical ETFs, with a Quant Score of 4.45:
Quant Ratings for Consumer Cyclical ETFs (Seeking Alpha)
ITB ETF Exposure Mix
Sector Mix
ITB ETF Sector Exposure (ITB ETF Website, Author’s Analysis)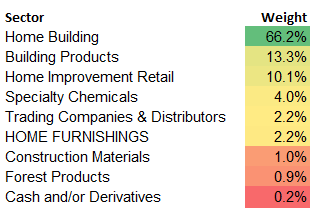
In addition to core Homebuilding (66.2%), ITB has some backward integrated exposure into industries that supply to homebuilders such as Building Products (13.3%) and Specialty Chemicals (4.0%). This would help mitigate some of the impacts of cost-side inflation. The ETF also has exposure to the home improvement retail sector (10.1%). This suggests that it benefits not only from new home sales, but also existing home sales and associated renovations.
Top 5 Holdings Mix
ITB ETF Top 5 Holdings (ITB ETF Website, Author’s Analysis)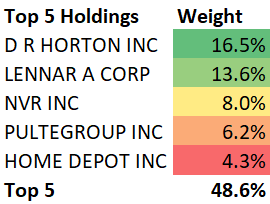
The top 5 holdings of ITB include D.R. Horton Inc (DHI), Lennar Corporation (LEN) (LEN.B), NVR Inc (NVR), PulteGroup Inc (PHM), and Home Depot Inc (HD).
The top 5 holdings contribute 48.6% towards ITB. Considering the specialist nature of the ETF, I believe this is a moderate level of concentration.
Fundamental Drivers of ITB
I deem borrowing costs, rent inflation and new home sales to be key drivers that impact the performance of ITB.
Peaking of Borrowing Costs
Bond yields dictate the prices of everything in the financial markets. To assess housing market activity, the 30 year government bond yield is a good proxy of mortgage borrowing rates:
US 30 year yields (TradingView, Author’s Analysis)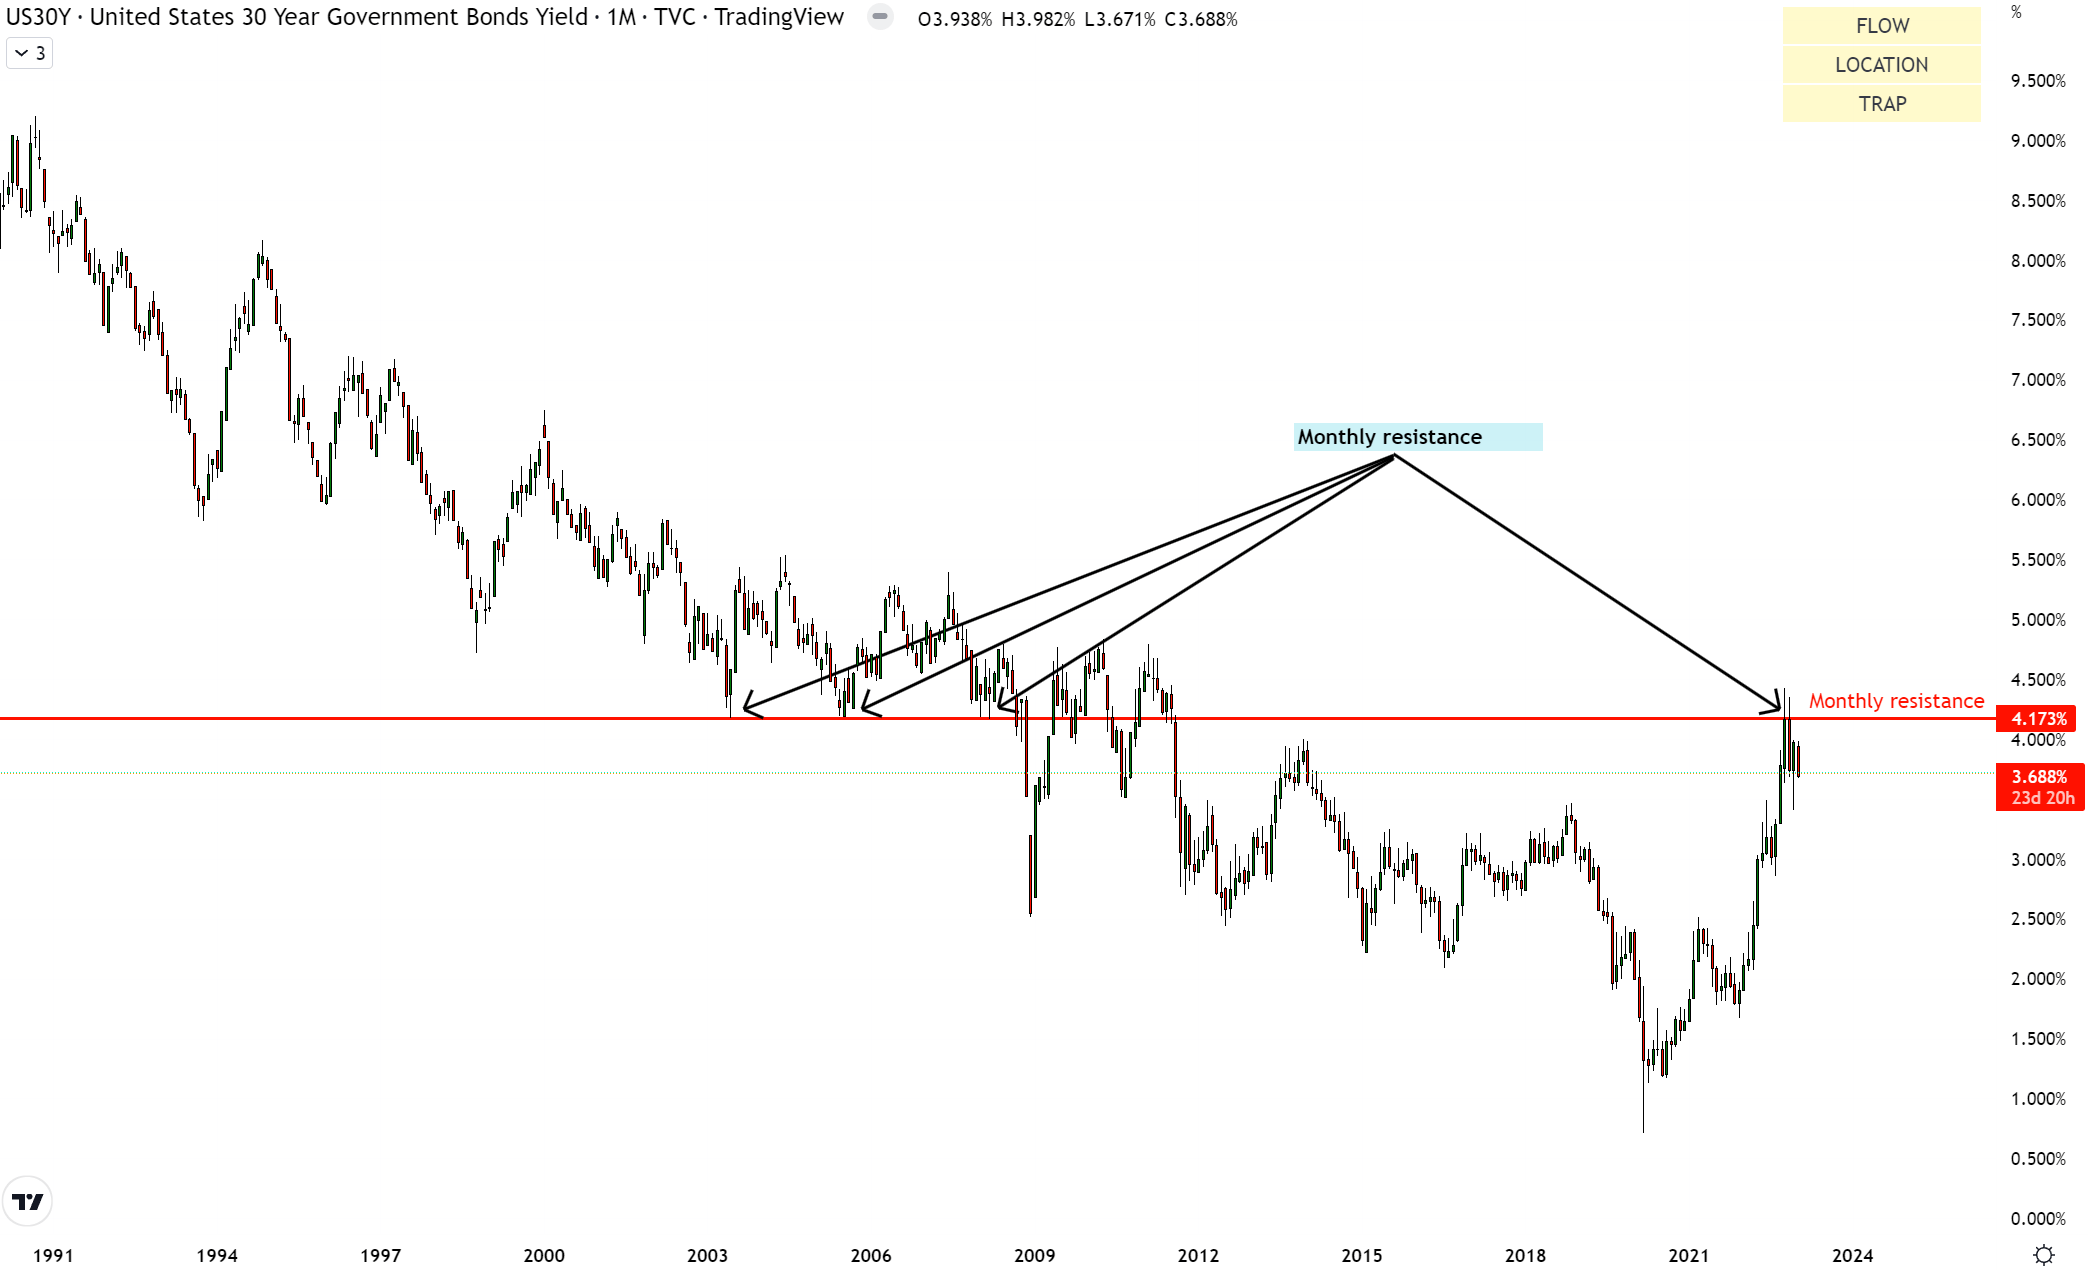
The United States’ 30 Year yields seems to be slowing down its upward movement as it hits a key level at 4.173%. This is a positive for homebuilding demand as the borrowing rates of loans become less expensive.
According to Robert Dietz, chief economist for the National Association of Home Builders:
The decline in mortgage rates could help bring confidence to the home building industry and result in more shovels in the ground starting over the next couple of years.
Positive Surprises on New Home Sales
US New Home Sales (myfxbook)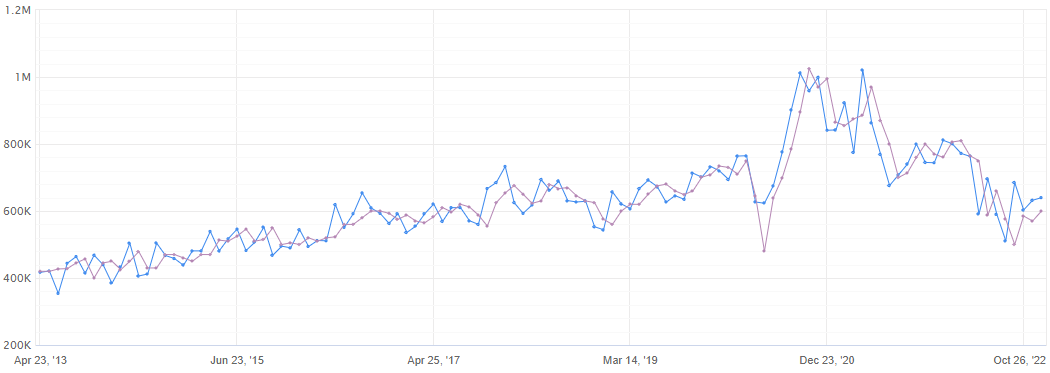
The blue data series depicts the actual figures. The purple data series depicts consensus estimates.
As can be seen in the chart above, new home sales have come back down to pre-pandemic normalized levels around 600 thousand. More importantly, for the past 4 quarters, there has been a consistent series of positive surprises to expected numbers, suggesting a better reality of new home sales activity than consensus views.
According to the National Association of Home Builders (NAHB) Chairman Jerry Konter:
Our latest survey shows 62% of builders are using incentives to bolster sales, including providing mortgage rate buy-downs, paying points for buyers and offering price reductions.
These initiatives may be what is driving better than expected activity in the homebuilding sector.
“The National Association of Home Builders reported this week that 62% of builders in December were using incentives to woo buyers, including providing mortgage rate buy-downs, paying points for buyers, and offering price reductions.
Multi-Decadal High Rent Inflation
US Rent Inflation (Trading Economics)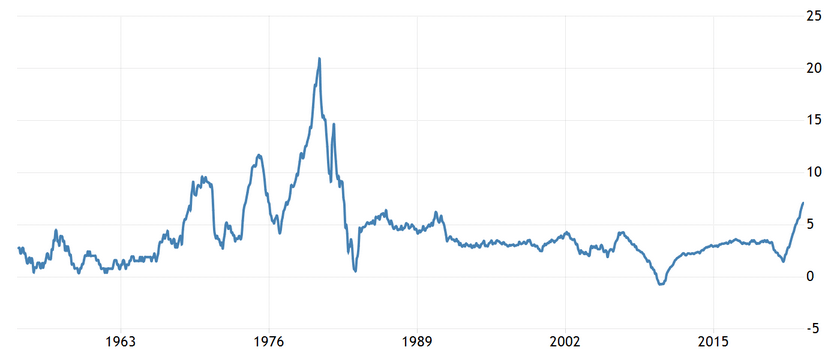
US rent inflation is at 30-year highs at 7.1%. Unlike headline inflation, which has started to peak, rent inflation is still on an upwards tear. Reuters noted that:
Rising housing costs were “by far” the biggest driver of the increase.”
This suggests that the alternative to buying purchases is also facing affordability challenges, reducing substitution risks for the homebuilders.
Technical Analysis
If this is your first time reading a Hunting Alpha article using technical analysis, you may want to read this post, which explains how and why I read the charts the way I do, utilizing the principles of Flow, Location, and Trap.
Relative Read of ITB vs S&P500
ITB vs SPX500 Technical Analysis (TradingView, Author’s Analysis)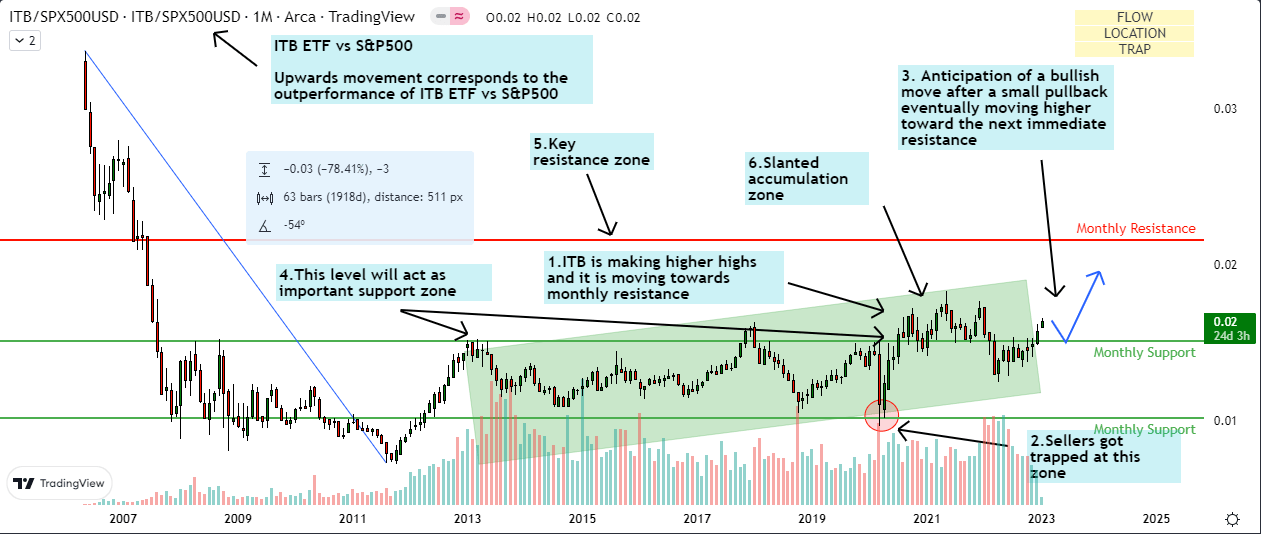
The relative chart of ITB/SPX500 above shows that the price is making higher highs and higher lows, suggesting an uptrend. The prices saw a sharp upmove after a bear trap in 2020. ITB is currently trading in a slanted accumulation zone. I anticipate a slight pullback toward the immediate support area and then a move up toward the next key resistance zone.
Standalone Read of ITB
ITB Technical Analysis (TradingView, Author’s Analysis)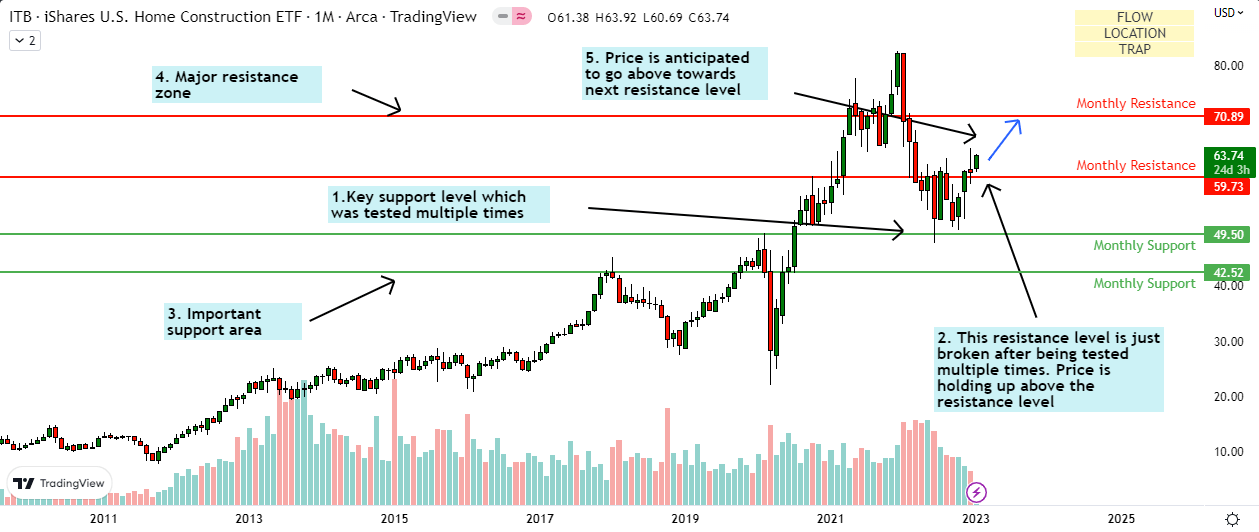
After a slight pullback in the last 2 years, ITB seems ready to restart its journey north. ITB tested the $50 zone several times and formed a strong base after which it has resumed its move up toward the next key resistance zone of $60. This level is now on the verge of breaking as it has been tested multiple times with no major reaction shown by the sellers. I now anticipate an upmove from this level toward the monthly resistance at $70.89.
Takeaway
Fundamentally, I will continue to monitor the mortgage rates, new home sales and rent inflation data. All three of these fundamental indicators are showing positive signs currently. The technicals are also aligning as they are pointing bullish. Overall. I anticipate ITB to generate absolute positive returns and also beat the S&P500, making alpha.
Be the first to comment