

designer491
(This article was co-produced with Hoya Capital Real Estate.)
On New Year’s Day, this article appeared on the Seeking Alpha site.
In brief, the article summarized the viewpoints, along with selected examples of detailed commentary, of Seeking Alpha authors who responded to an earlier solicitation to submit their outlooks for 2023.
Here, from that article, is a very nice graphic summarizing the combined views of the 34 authors who responded.
2023 Forecasts: Summary From 34 SA Contributors (Seeking Alpha)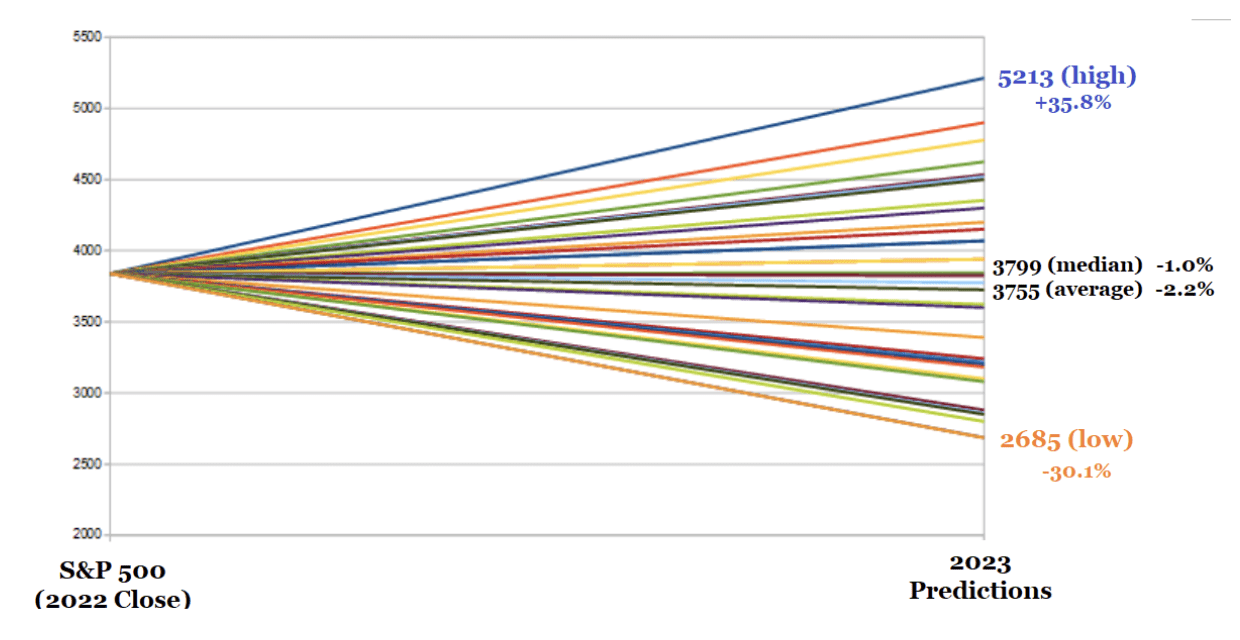
I hope to return in the reasonably near future with my full-year report on the ETF Reliable Retirement Portfolio, along with my own thoughts on the outlook for 2023. However, for the purposes of this article, I believe the results from this multi-author perspective offer a nice foundation.
Here is how the article summarized the views of the authors that led to the graphic reproduced above.
On average, contributors are expecting a small decline in the S&P 500 in 2023.
The most optimistic forecast for the S&P 500 for 2023 is for a rise of +35.8%. The most pessimistic contributor who submitted a prediction for 2023 expects the index to close at 2685, or -30.1% lower, in 2023.
With the S&P 500 index closing 2022 at a value of 3,839.50, it can be seen that both the median and average results from the above survey project a market that is more or less flat in 2023. Just eyeballing the graphic, it appears to me that the bulk of the outlooks fall between a high end forecast of roughly 4,500 and a low end forecast of roughly 3,250, with a few outliers on either side.
In this article, I will take my first ever look at iShares Select Dividend ETF (NASDAQ:DVY). Specifically, I will be thinking in terms of how this ETF may perform in the environment most typically expected for the coming year. I will briefly compare it with two other options that could be considered, depending on one’s personal viewpoint.
iShares Select Dividend ETF – Digging In
First of all, a few basic facts about the fund. With an inception date of 11/03/2003, the fund is less than a year away from its 20th anniversary. As of December 30, 2022, according to DVY’s web page, it sports AUM of $22.974 billion. Both those numbers speak to a well-established ETF, with a long track record and significant ownership.
Let’s get the part I don’t like out of the way. With an expense ratio of .38%, DVY is a relatively expensive fund. As a comparison, the two alternate ETFs I will reference a little later both sport expense ratios of .06%, which means that DVY has to outperform by roughly 1/3 of one percent to break even.
For that slightly higher fee, then, what is DVY offering that differentiates it from its competitors? For some answers, let’s dig in a little to its summary prospectus. There, we find that DVY seeks to track the investment results of the Dow Jones U.S. Select Dividend Index, which measures the performance of the U.S.’s leading stocks by dividend yield.
Here, quoted directly and slightly reformatted with bullet points for clarity, are the requirements for inclusion in DVY:
To be included in the Underlying Index, each security
- must have a dividend per share greater than or equal to its five- year average dividend per share;
- must have a five-year average dividend coverage ratio of greater than or equal to 167%;
- must have a three-month average daily trading volume of 200,000 shares (100,000 shares for current constituents);
- must have paid dividends in each of the previous five years;
- must have a non-negative trailing 12 month earnings per share;
- must have a float-adjusted market cap of at least $3 billion ($2 billion for current constituents).
Let me first feature the last bullet point from the list. As can be seen from the rather low market-cap requirement, DVY’s underlying index includes large-, mid- and small-capitalization companies. While excluding REITs, this opens the door to a wider scope of companies than many competitors, which may stick to large-cap companies.
Another variance from many competitors which are market-cap weighted is that DVY then weights its constituents by dividend. The end result is that, while not strictly evenly-weighted, one could reasonably view it as “quasi evenly-weighted.” As a result, it is slightly less dependent on the performance of a few top stocks for its overall results.
How is this all playing out in practice, at this point in time? I love this particular section from Seeking Alpha’s home page for each ETF, as it captures so much helpful information in one snapshot. Here it is for DVY:
DVY: Key Data Points (Seeking Alpha)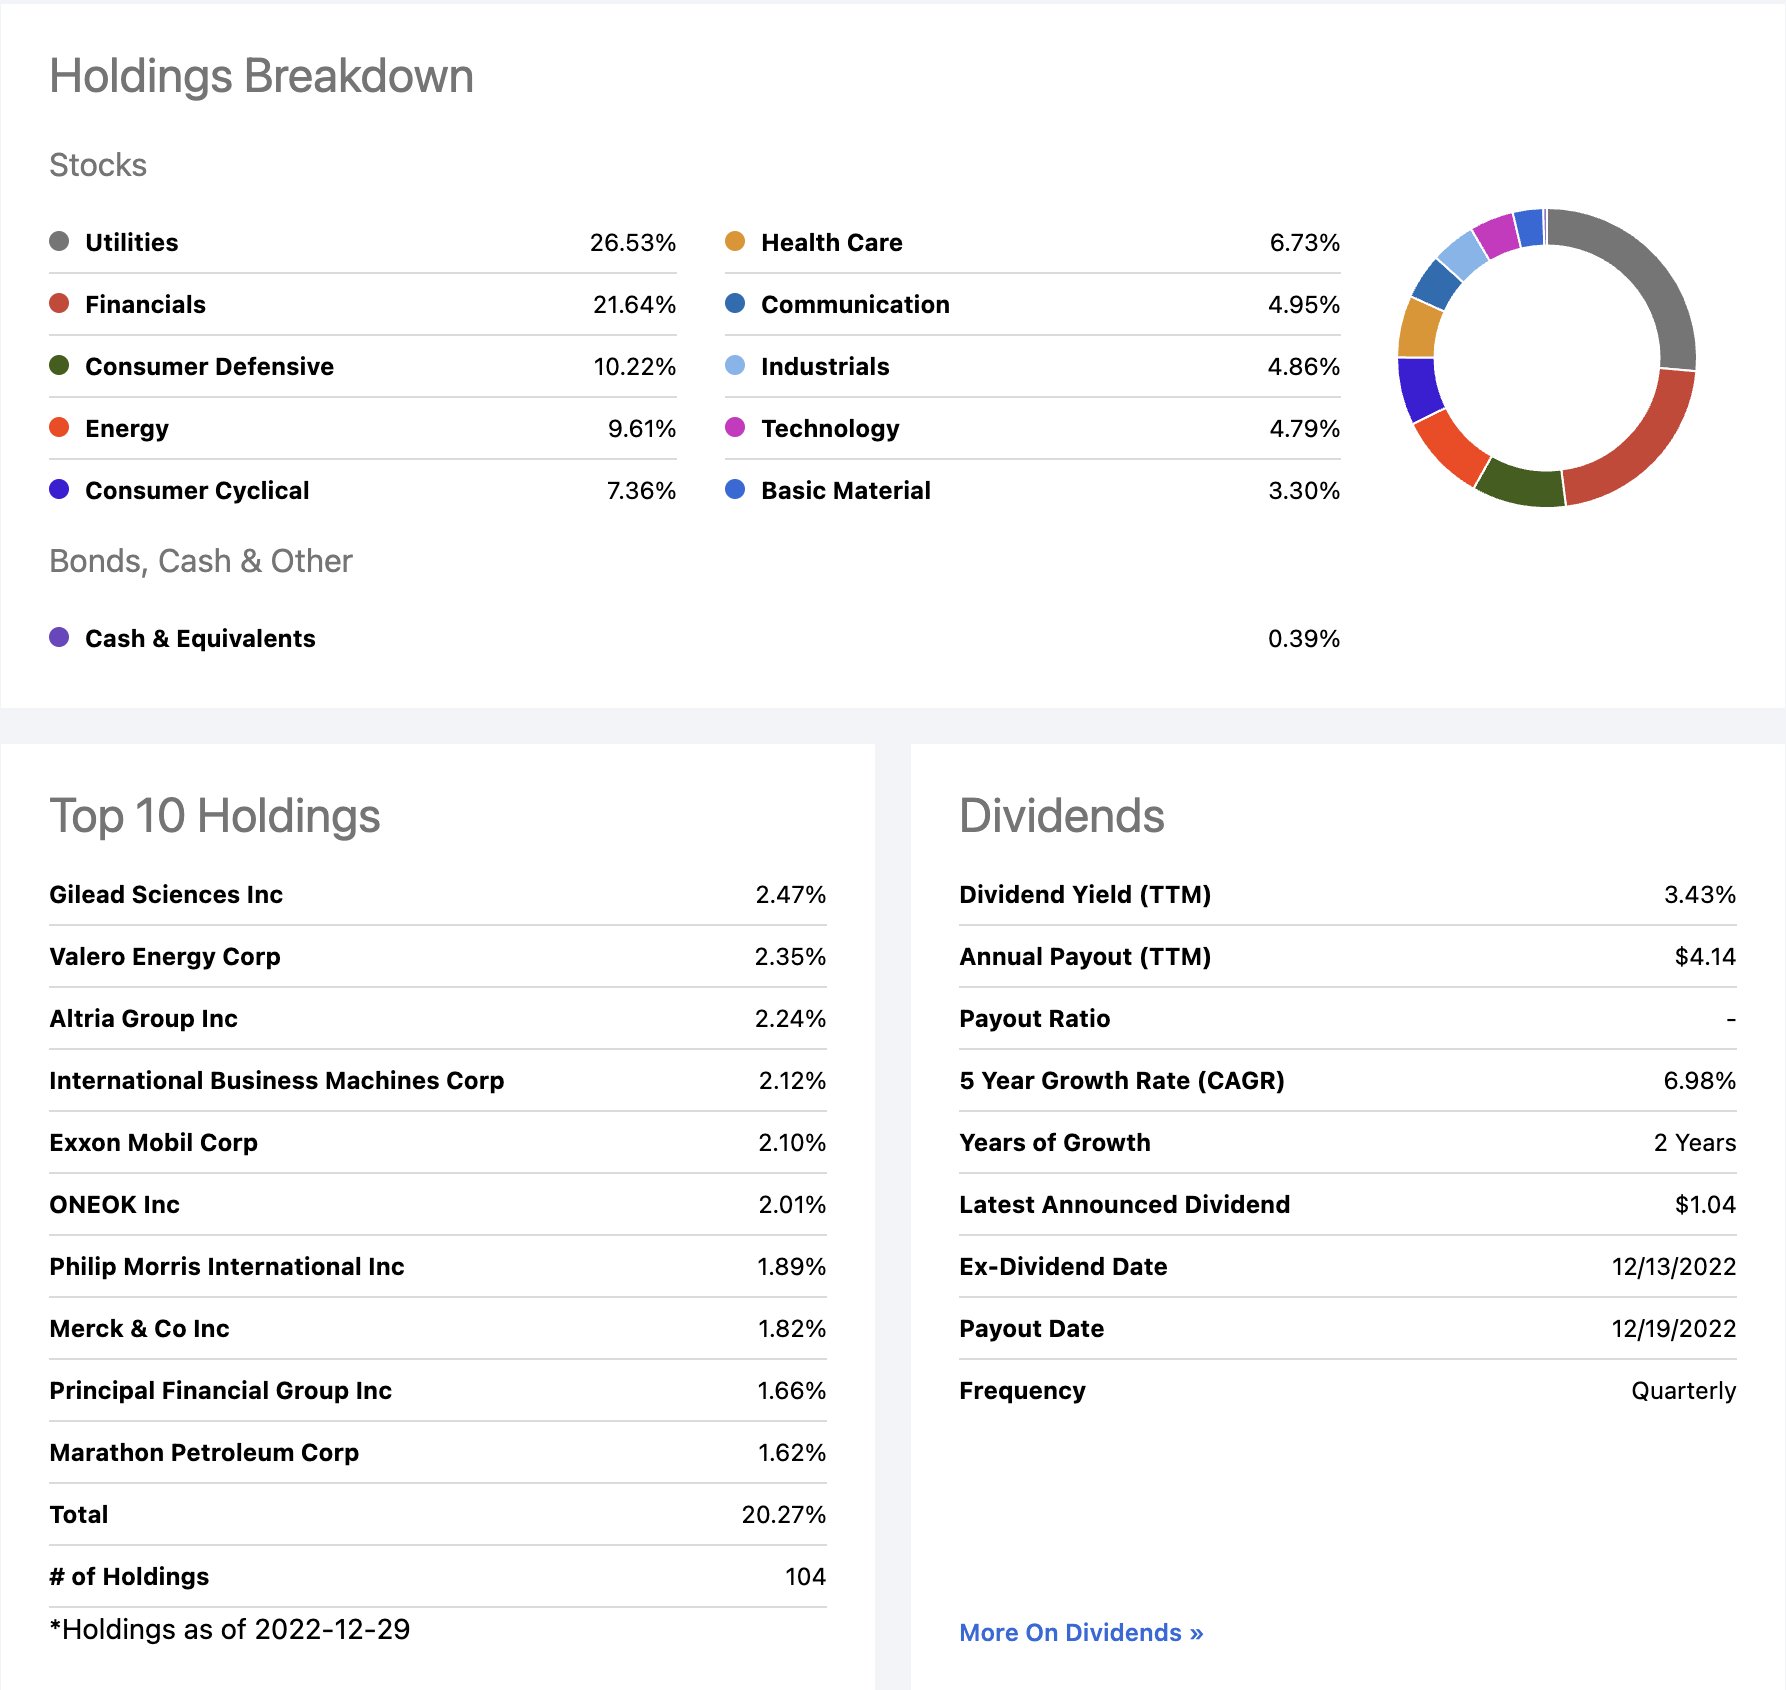
What can we derive from this? Let me start with a small additional excerpt from the summary prospectus. After noting that the Underlying Index is reviewed quarterly and rebalanced annually, the document goes on to note:
[Due to the fund’s selection criteria, the constituents] may change over time. As of April 30, 2022, a significant portion of the Underlying Index is represented by securities of companies in the oil & gas and utilities industries or sectors. The components of the Underlying Index are likely to change over time.
Starting with that April 30, 2022 time marker, one can already see that this has somewhat changed as of the end of the year. Utilities are still the top sector, but energy has slipped to 4th place. Still, those two sectors make up over 36% of the fund. In addition, Consumer Defensive (aka Consumer Staples) and Health Care, two sectors that I have already earmarked for possible outperformance during 2023, comprise an additional 17% of the fund.
Moving to the bottom section of the above graphic, take a look at the Top 10 holdings. You’ll see what I referred to above as “quasi even-weighting.” At 20.27% of a fund with roughly 100 holdings, this fund doesn’t have a top-heavy bias.
How Might This Play Out In 2023?
As far as Consumer Staples and Health Care, please see the links above if interested in the positive outlook I set forth for either or both of those sectors.
With respect to Utilities and Energy, I took a look at a 2023 Sector Outlook from Fidelity Investments to check my own perspective. In brief, here is what Fidelity has to say in each case.
Utilities – Fidelity believes that the sector’s defensive characteristics could continue to look attractive to investors seeking shelter during market and economic choppiness. At the same time, there appear to be opportunities for growth. The Inflation Reduction Act, recently signed into law by President Biden, offers multiple initiatives and tax subsidies that could accelerate the transition away from fossil fuels to renewable resources for energy generation within the US-hastening that move from petro-economy to electro-economy.
Energy – Fidelity believes that, despite recessionary risks, demand for oil and gas is expected to grow in 2023 as economies continue to recover from the pandemic. Further, refining capacity continues to look tight for 2023, given limited capacity and the long lead time it takes to bring new capacity online. This is likely to result in another strong year for the profitability of companies with refining operations. And energy services companies could experience strong earnings growth, as spending on exploration and production increases.
Finally, one of the themes that I anticipate developing in my personal 2023 outlook is that, in general-and this includes allocations to cash and bonds-investors may not need to go to extremes on the risk spectrum to generate competitive returns.
And it is for exactly this reason that I believe DVY could prove to be a solid holding for 2023, particularly for conservative investors.
A Brief Comparison – And Concluding Thoughts
To conclude, let me feature a couple of competitive ETFs you could consider if you find DVY to be of interest. The first is Vanguard High Dividend Yield ETF (VYM), the second is Schwab US Dividend Equity ETF (SCHD).
As a very high-level overview some key data points, have a look at this compact, yet comprehensive graphic, courtesy of Hoya Capital Income Builder.
DVY/VYM/SCHD: Selected Data Points (Hoya Capital Income Builder)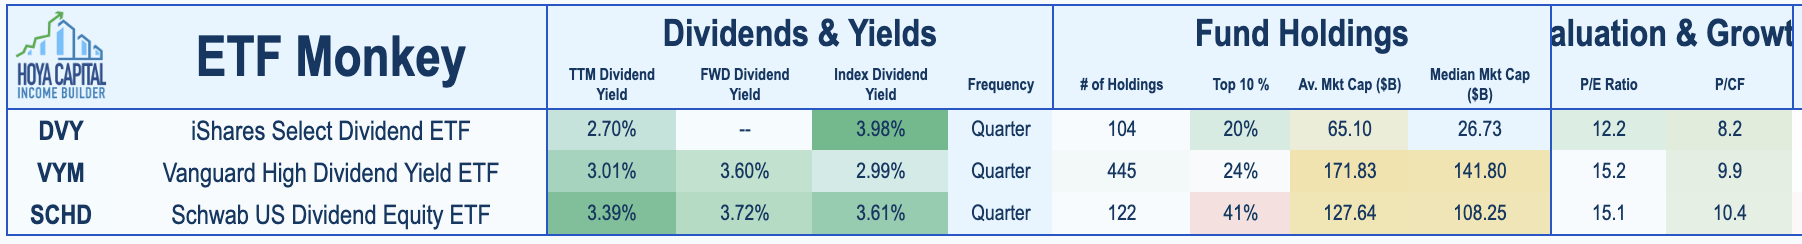
First, you will notice that dividends for all 3 funds are strong. While both VYM and SCHD are slightly higher at this point, the three have been relatively consistent in this area when viewed over a longer period of time.
In the Fund Holdings section of the graphic, let me point out two things. First, that the concentration of DVY’s Top-10 holdings is less than the other funds, even though it has a lower number of total holdings. Secondly, that DVY’s average market cap is smaller, due to its inclusion of medium- and small-cap stocks.
Finally, please take note of the fact that, from a valuation standpoint, DVY is relatively cheap at this point.
However, while I suggested above that DVY could be a solid holding in the particular environment we may face over the next few months, I don’t necessarily feel the same way about its value over the long term.
Take a look at how things have played out over time for DVY when compared against VYM and SCHD. To be honest, I don’t see anything to justify the higher expense ratio charged by DVY.
DVY vs. VYM vs. SCHD: 2012-2022 Backtest (PortfolioVisualizer.com)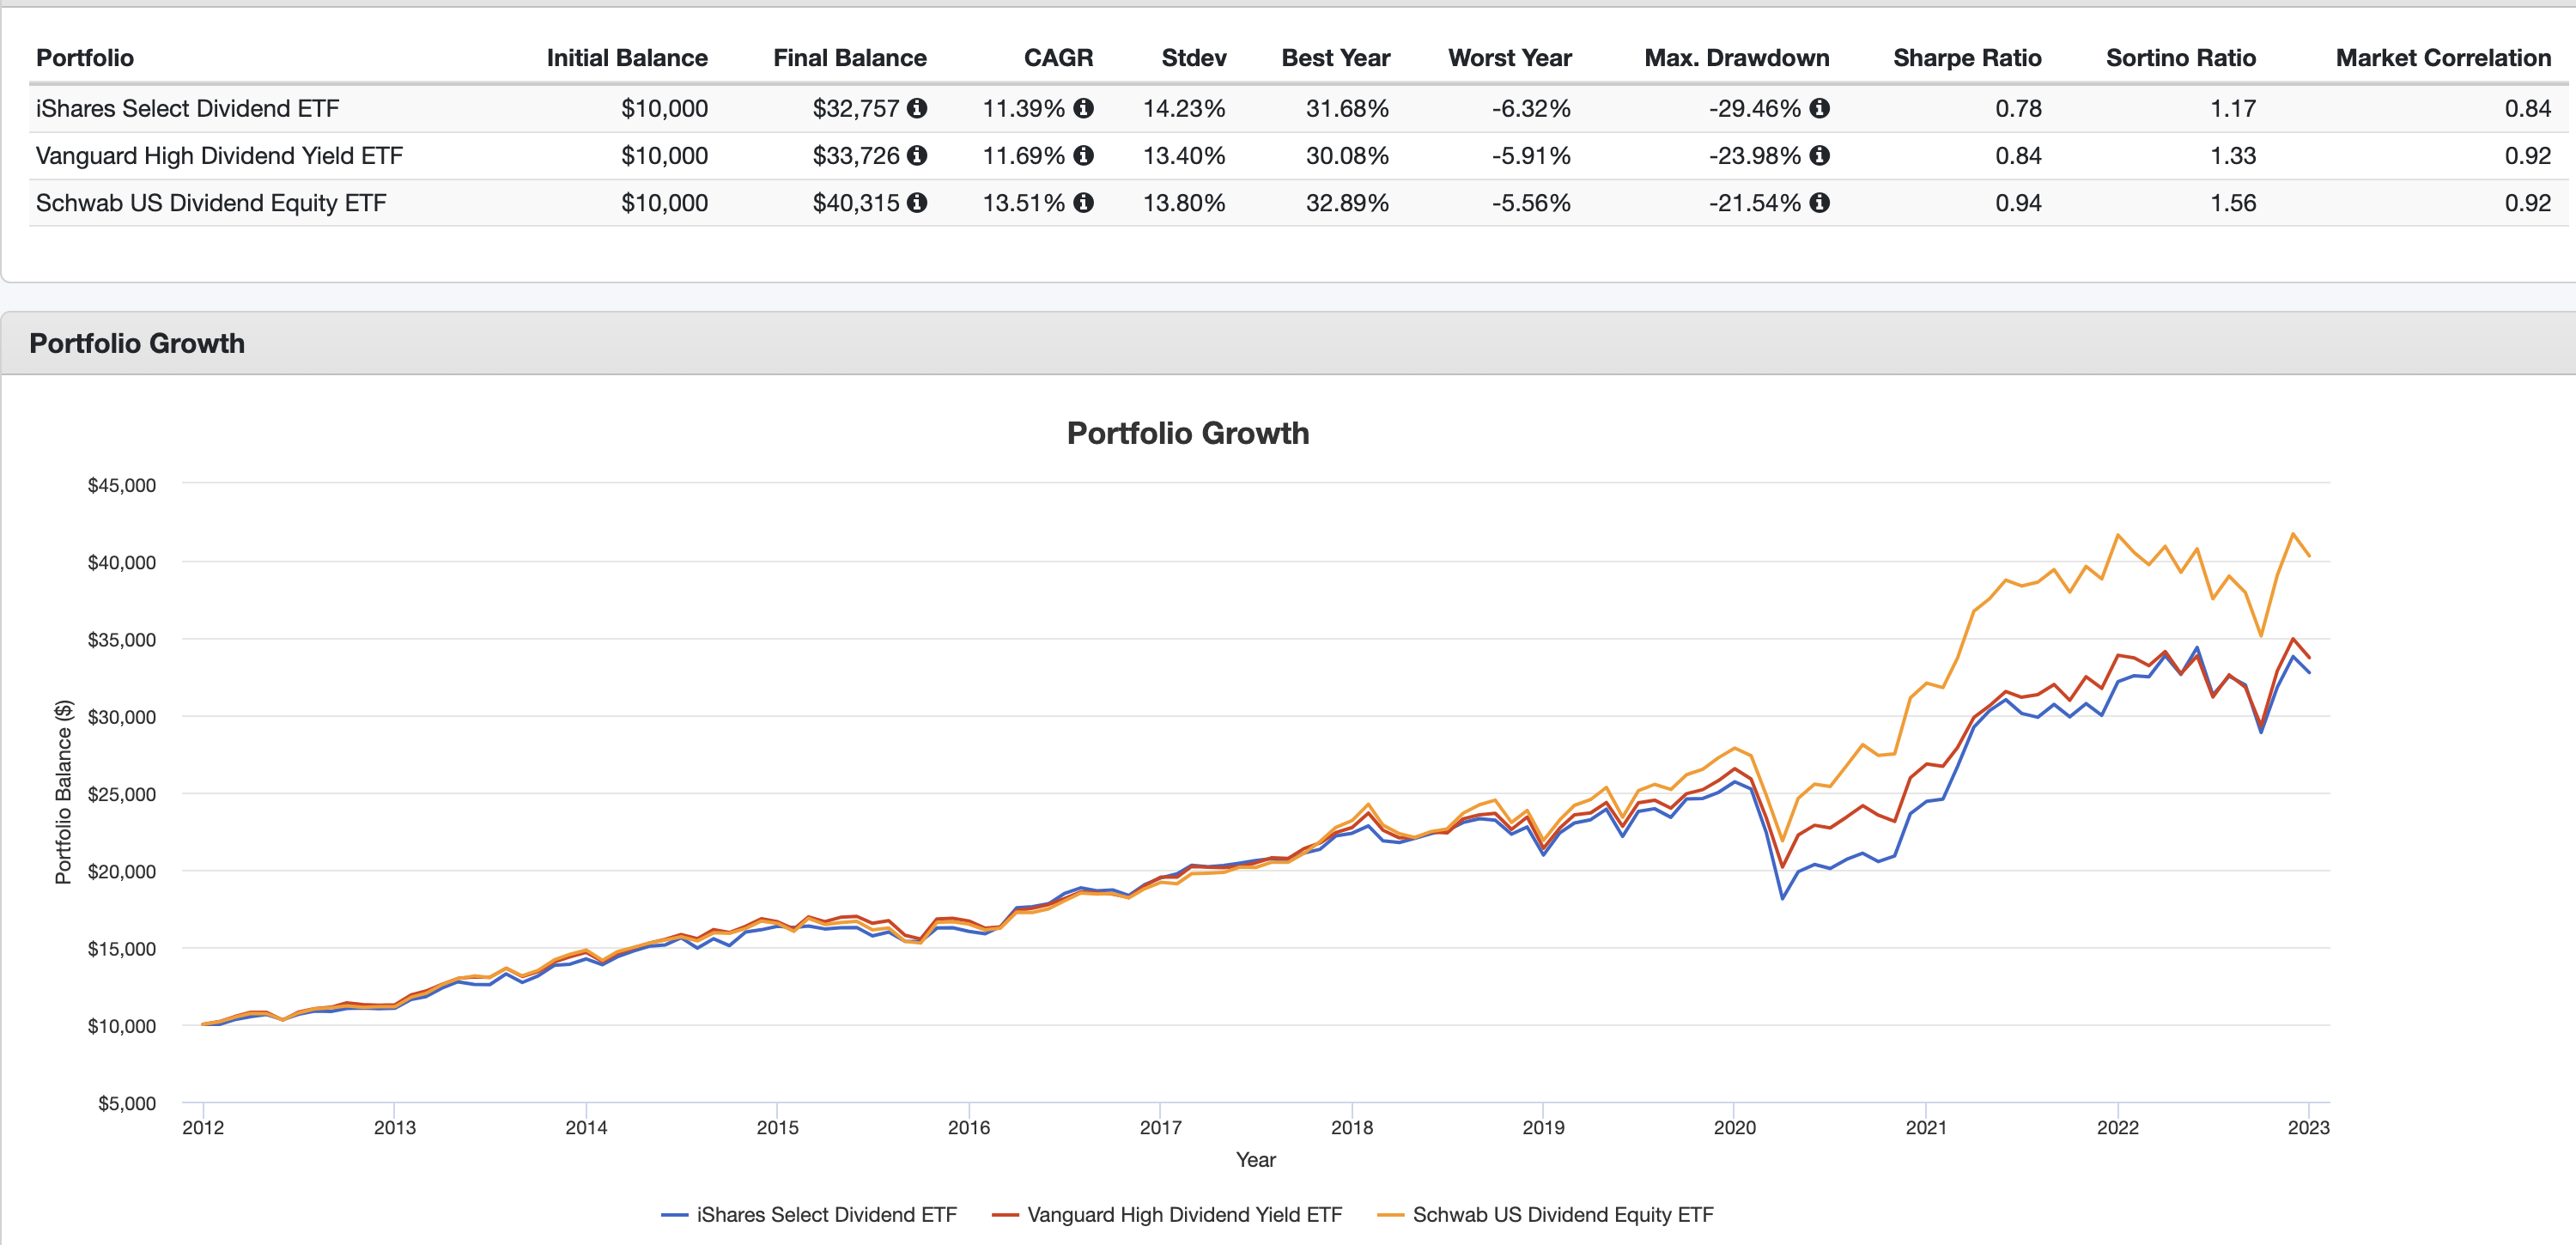
In this backtest, covering some 11 years, DVY comes up a little short against both competitors. I won’t belabor the numbers, you can enlarge the graphic and analyze it for yourself.
To go all the way back to the start, then, if you tend to subscribe to the view that the market may end 2023 significantly lower than 2022, DVY might just be a candidate to maintain a reasonable allocation to stocks in your portfolio. If you tend to side with the Seeking Alpha contributors who have a more positive outlook, than either VYM and, in particular SCHD, may be better choices.
And longer term? For my personal portfolio, I think I would go for either SCHD or VYM, in that order, before sticking with DVY.
Thanks for reading, and I hope to hear from you in the comments section below!
Be the first to comment