

jetcityimage
The PGIM High Yield Bond Fund (NYSE:ISD) is a closed-end fund that seeks to provide high levels of current income by investing in junk bonds.
While I am hesitant to invest in a credit fund ahead of a potential recession in 2023, I am intrigued by ISD’s historical performance, which had been unblemished prior to 2022. The ISD fund has also outperformed my back-of-the-envelope estimate for YTD returns, suggesting superior security selection. Unfortunately, the ISD pays an overly high distribution yield which depletes NAV over time.
For those investors who stand by ‘income investing’, ISD may be a good choice to consider.
Fund Overview
The PGIM High Yield Bond Fund is a closed-end fund (“CEF”) that seeks to provide high levels of current income by primarily investing in non-investment grade fixed income instruments. The fund has over $460 million in net assets and $569 million in managed assets.
Portfolio Holdings
As of October 31, 2022, 88% of assets held in the ISD fund was non-investment grade (Figure 1). The portfolio had a leverage adjusted duration of 4.4 years.
Figure 1 – ISD fund attributes (pgim.com)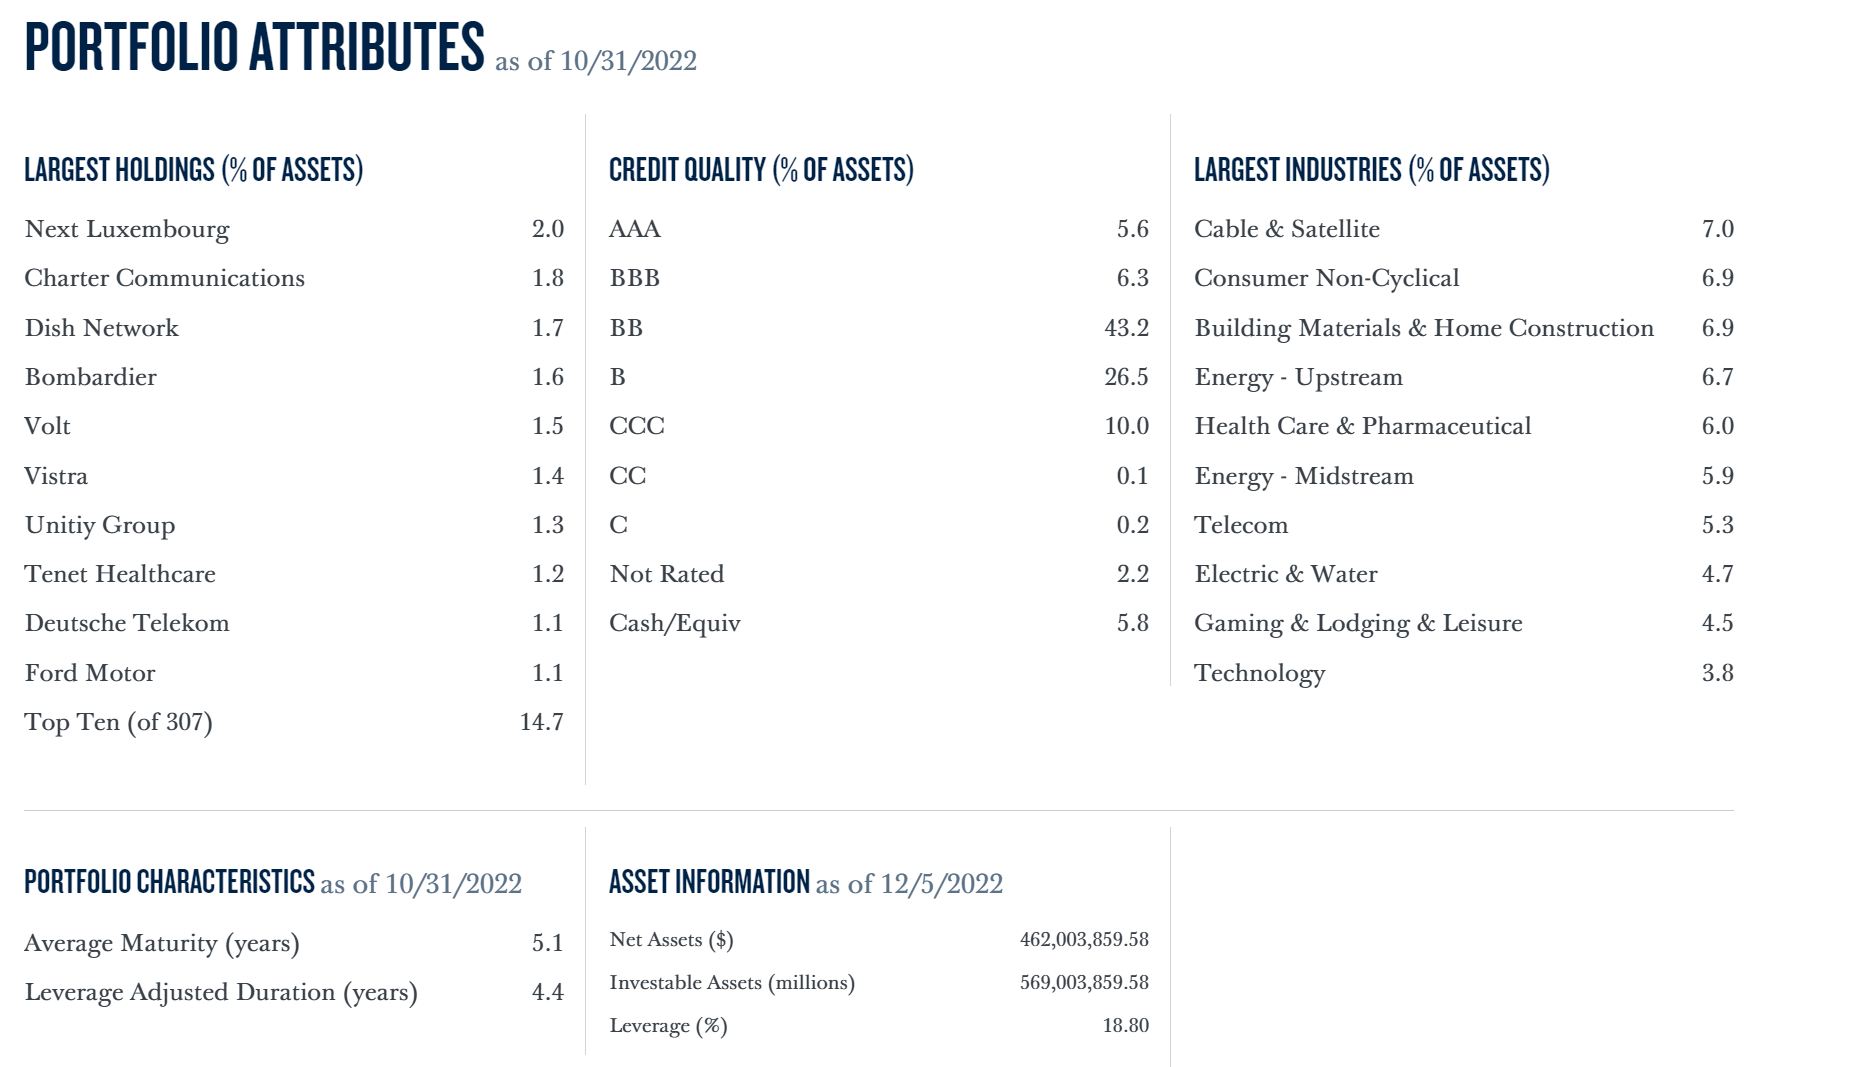
Returns
As of November 30, 2022, the fund had generated modest long-term returns with 3/5/10Yr average annual total returns of 1.9%/4.0%/4.6% respectively. YTD, the fund had performed poorly, with -12.4% total return primarily due to rising interest rates.
Figure 1 – ISD average annual returns (pgim.com)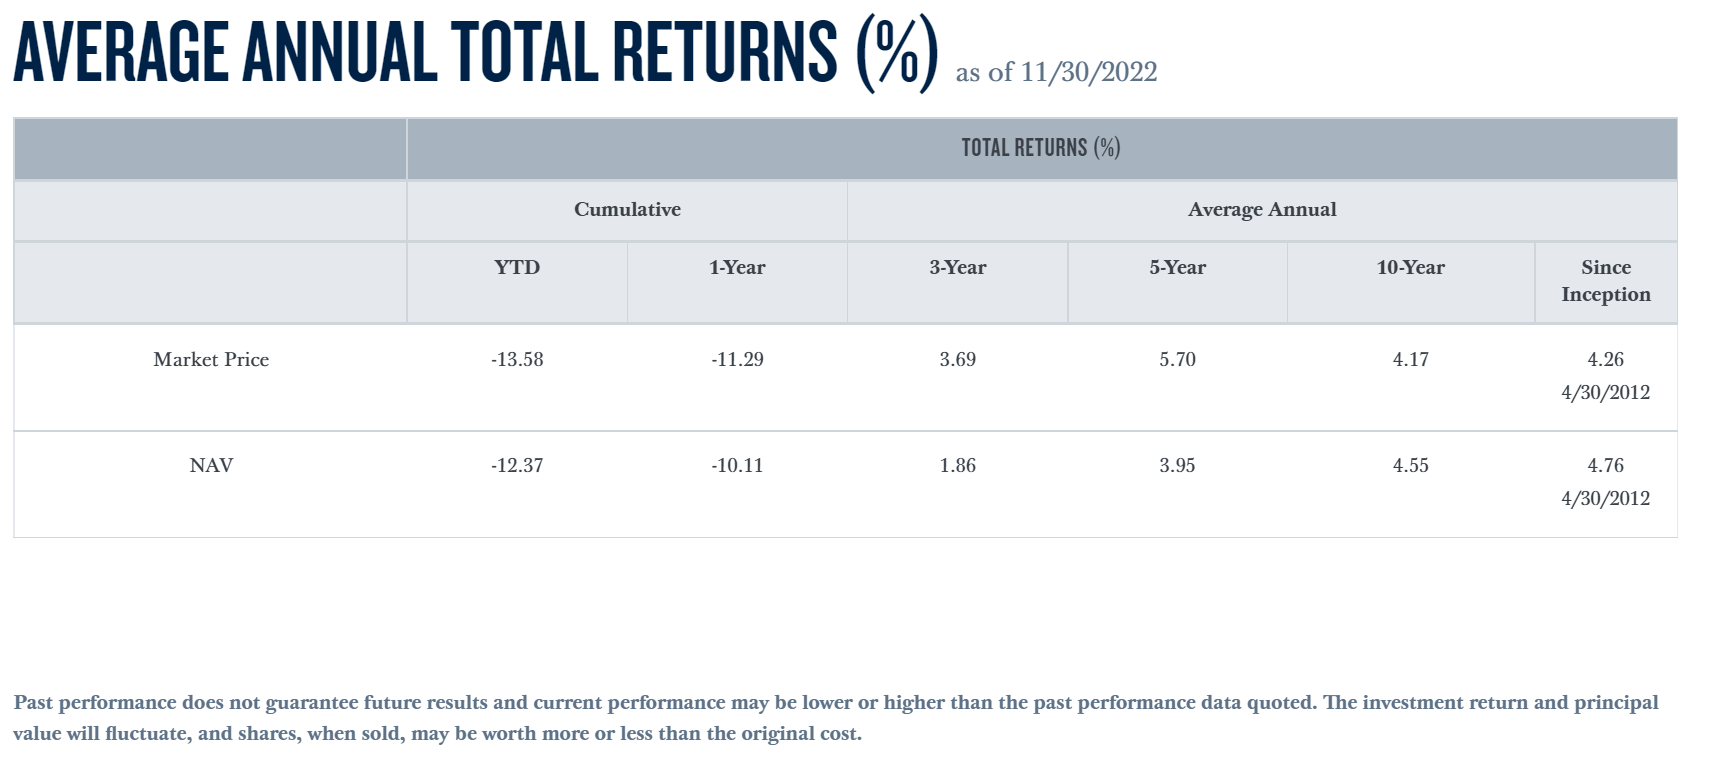
On an annual basis, 2022 was the only negative return year for ISD. From 2013 to 2021, the fund generated average annual returns of 6.6% (Figure 2).
Figure 2 – ISD annual returns (morningstar.com)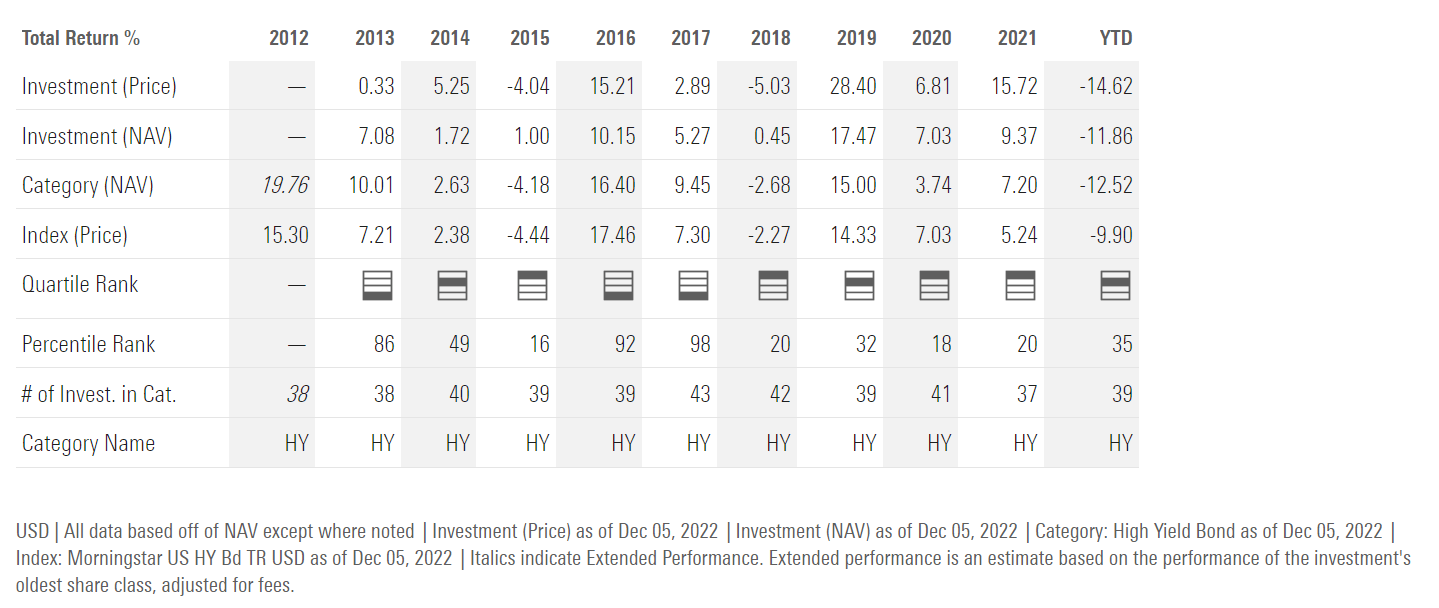
Distribution & Yield
The ISD fund pays a high monthly distribution of $0.105, which equates to a 10.0% current yield on market price. On NAV, the yield is 9.1%.
As of October 31, 2022, the ISD fund’s distribution coverage ratio is 80.0% (Figure 3).
Figure 3 – ISD distribution coverage (pgim.com)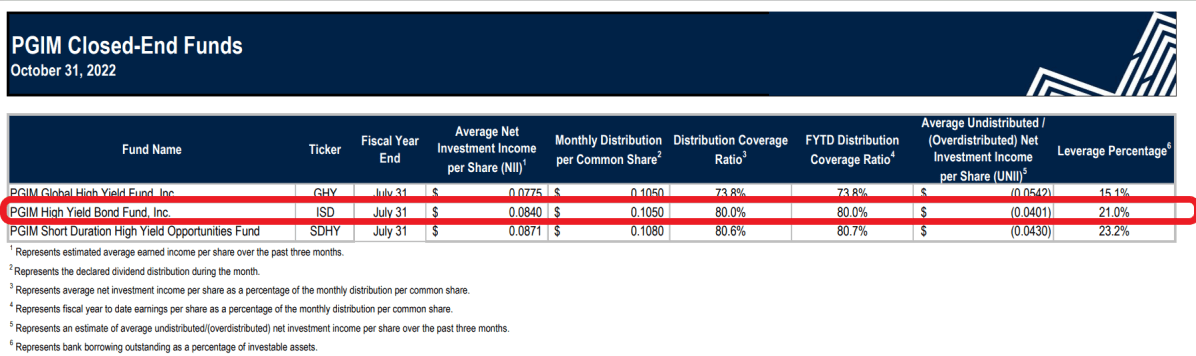
Although ISD’s distribute rate has fluctuated in the past, since mid-2019, the rate has been set at a monthly $0.105 (Figure 4).
Figure 4 – ISD historical distributions (Seeking Alpha)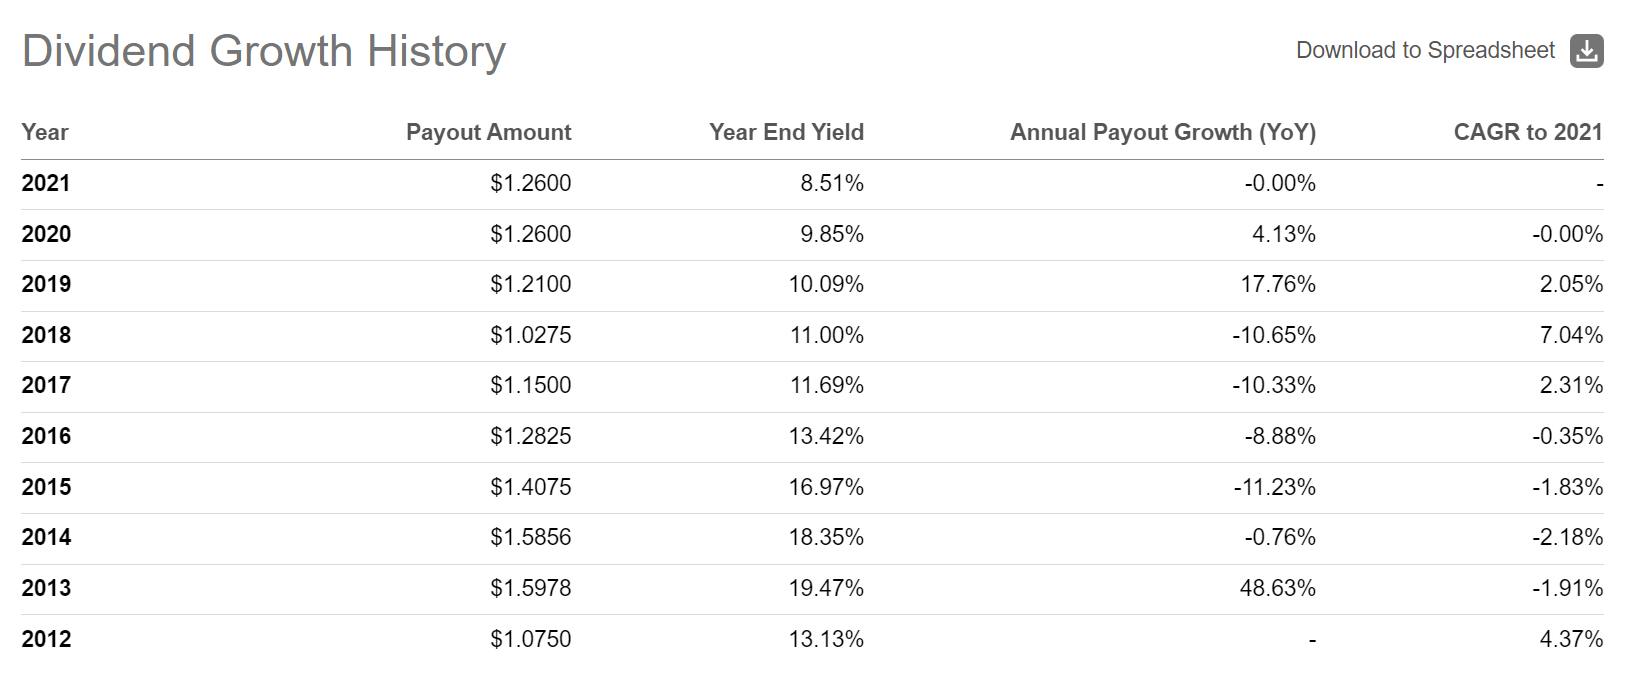
Given the ISD fund only earns an average return of 6.6% per year excluding 2022 but had been paying distribution yields in excess of 10%, I have to conclude that the fund is yet another example of a closed-end fund paying more than it earns. This leads to NAV decay over time, which negatively affects the ability of the fund to earn sufficient income to sustain future distributions.
Fees
The ISD fund charges total expenses of 1.48% of net assets.
ISD Does Have Several Redeeming Attributes
While I am critical of the ISD fund’s distribution policies, I have to admit the fund has several redeeming qualities. For example, the fund did not have a down year prior to 2022, which is rare, as many credit funds like the Blackstone Long-Short Credit Income Fund (BGX) had a tough time navigating 2015 (global growth slowdown, Chinese yuan devaluation).
I also like the fact that the ISD fund charges a relatively inexpensive 1.48% total expense ratio. Having analyzed many CEFs over time, this is one of the lower expense ratios I have seen.
Investment Performance Better Than Expected YTD
Finally, I believe ISD’s YTD performance has exceeded expectations. For example, we know that YTD November, 5 Yr treasury yields (I use 5 year treasuries to match ISD’s portfolio duration of 4.4 years) have increased 2.5%, from 1.3% to 3.8% (Figure 5).
Figure 5 – 5Yr treasury yields (stockcharts.com)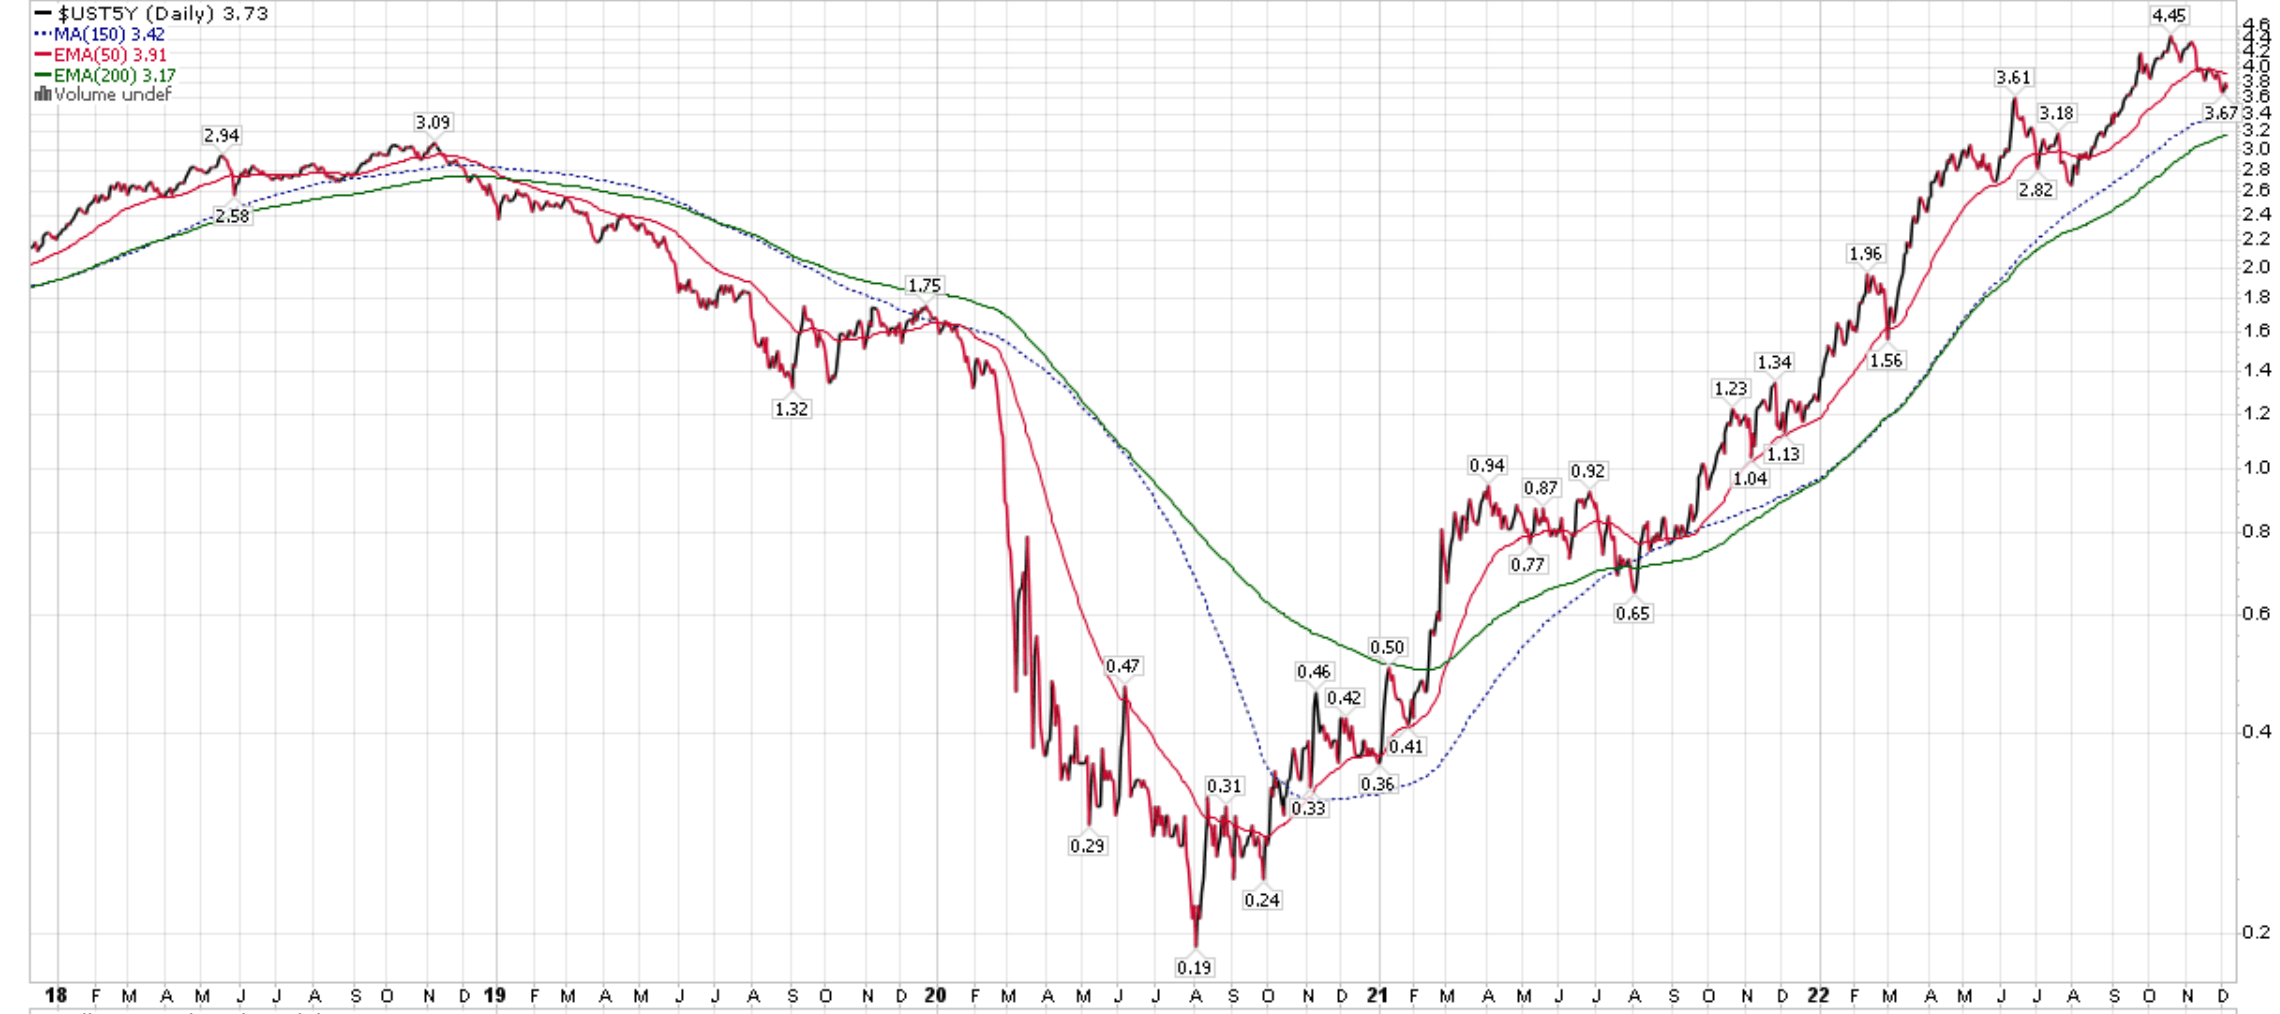
We also know that high yield credit spreads have increased moderately by 1.5%, from 3.1% to 4.6% (Figure 6).
Figure 6 – High yield credit spreads (St. Louis Fed)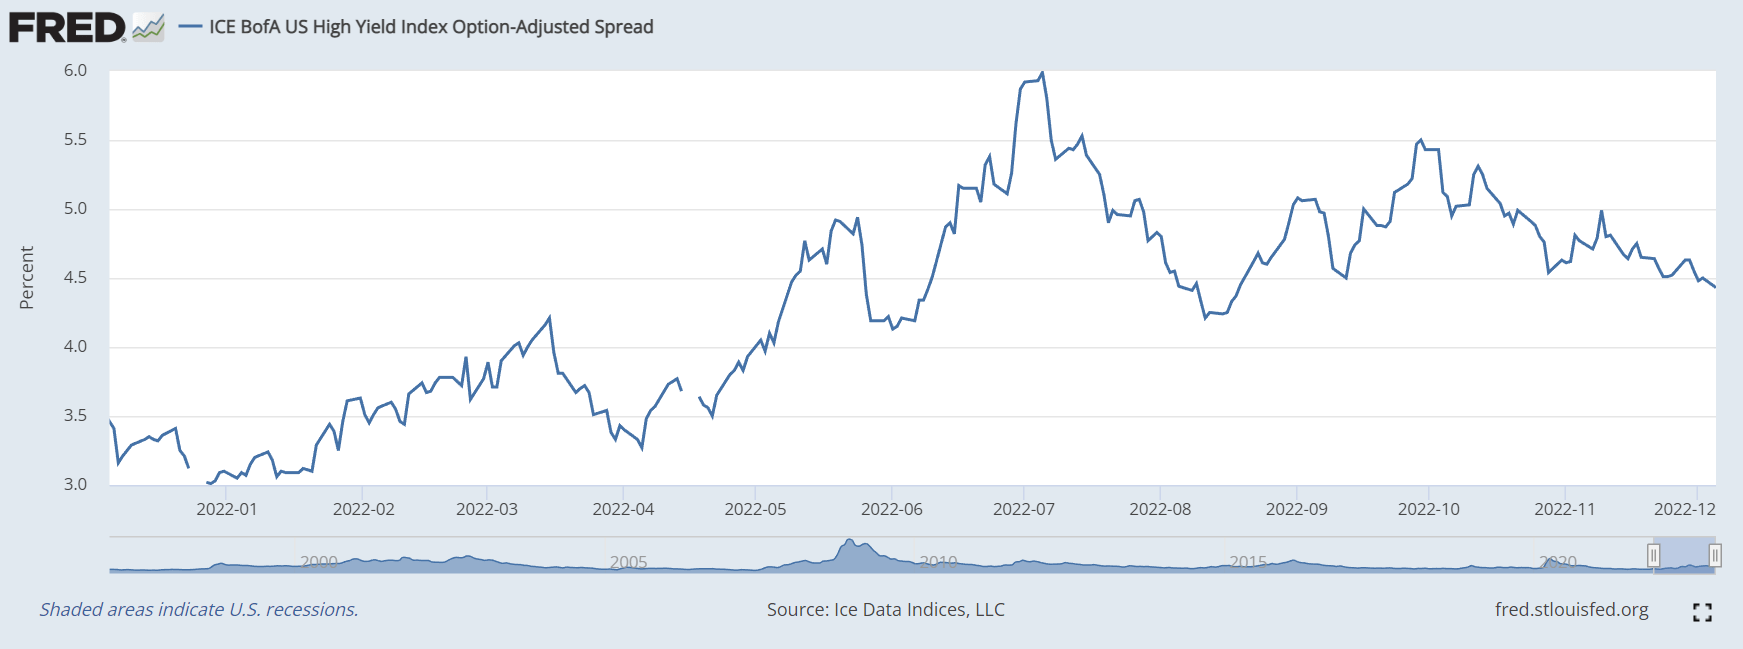
Using simple first order approximation (price change = duration x rate change), I would have expected the MTM price declines of -18.0% for ISD. In fact, YTD to November, ISD’s NAV declined from $16.95 to $13.81, or a decline of 18.5% (Figure 7).
Figure 7 – ISD NAV YTD performance (cefconnect.com)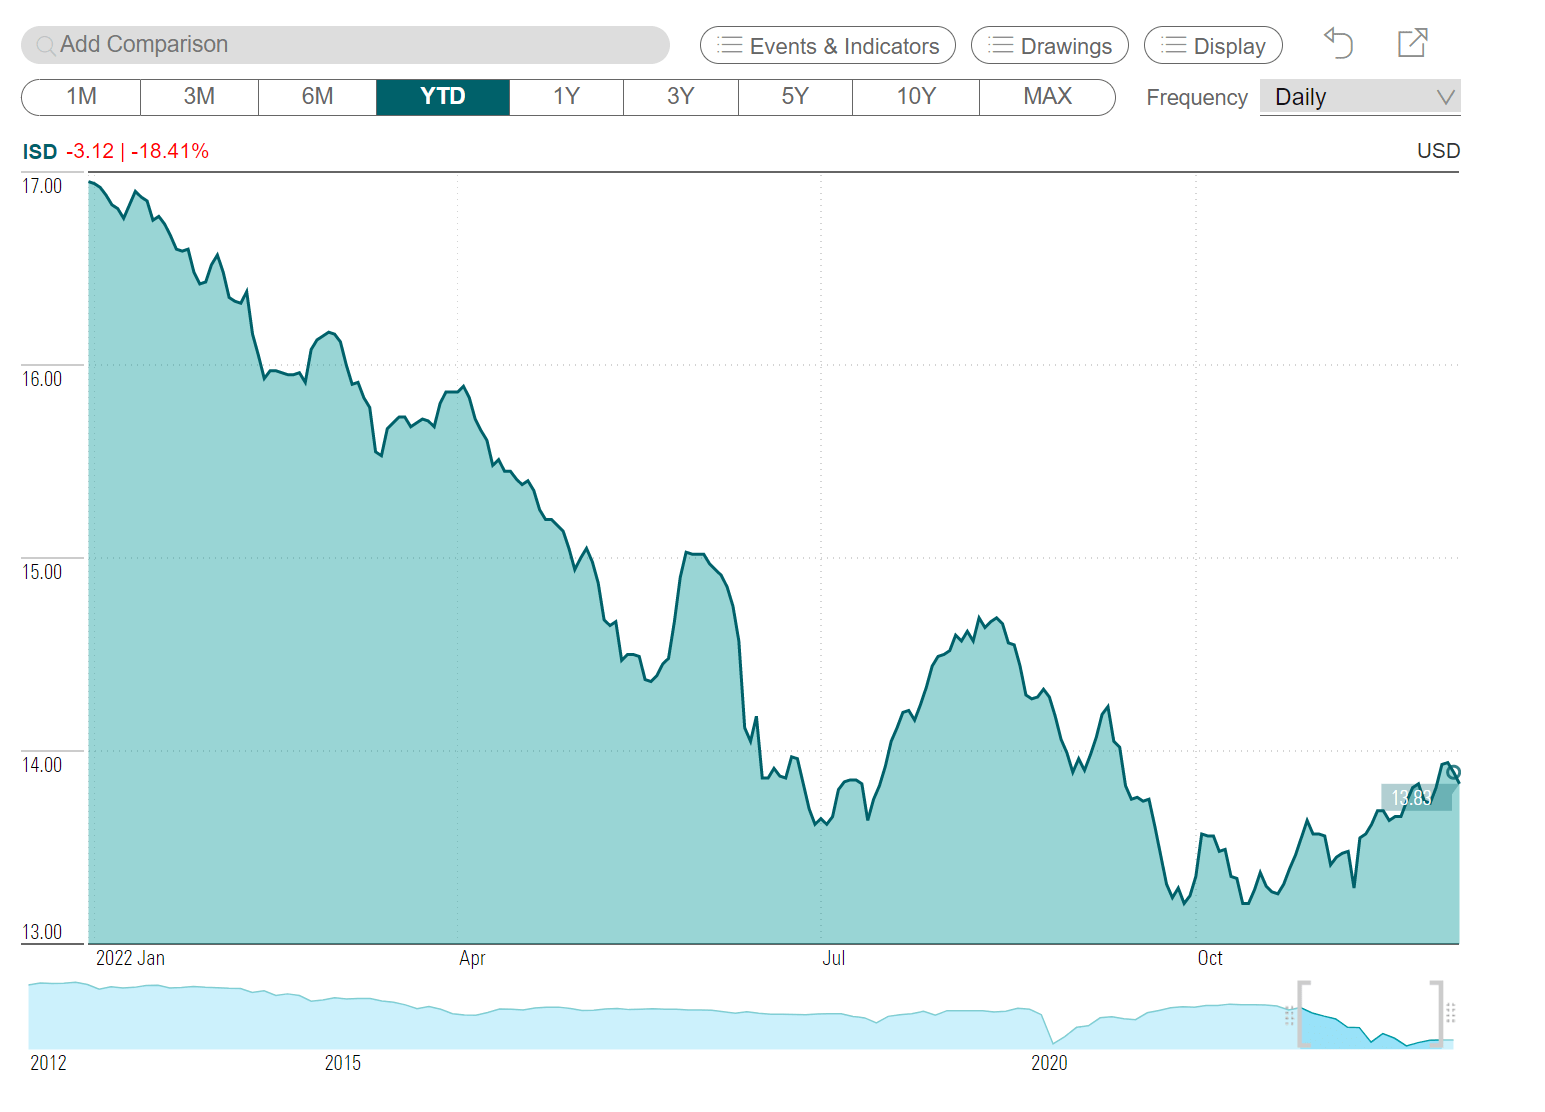
Bear in mind, this NAV decline also includes 11 months of fund expenses, which works out to 1.3%. In addition, from figure 3 above, we know that only 80% of the fund’s distribution was covered by income, so 20% or $0.252 per share would have come from the NAV. Therefore, the implied MTM price decline was only 15.7% (18.5% less 1.3% from fees and 1.4% from distributions), which is significantly better than my estimate.
Significant Discount To NAV
Speaking of the NAV, the ISD fund trades at a 9.1% discount to NAV at the moment (Figure 8).
Figure 8 – ISD trades at significant discount to NAV (cefconnect.com)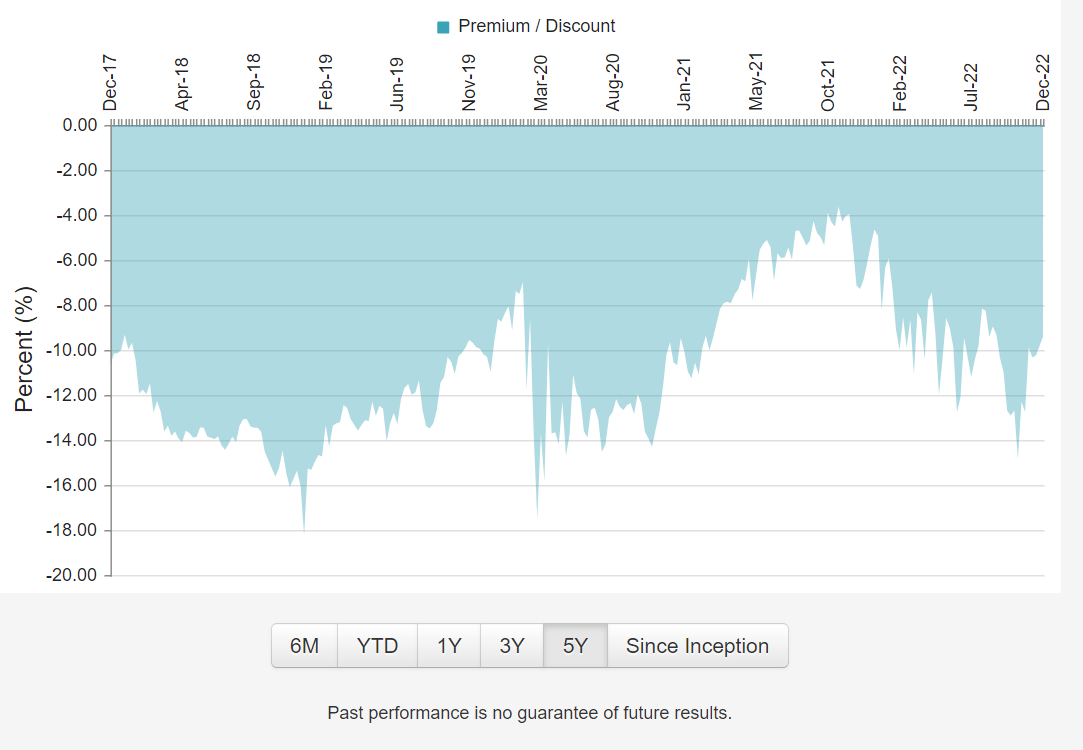
Conclusion
While I am hesitant to invest in a credit fund ahead of a potential recession in 2023, I am intrigued by ISD’s historical performance, with 9 consecutive years of positive returns prior to 2022. The ISD fund has also outperformed my expectations YTD, which suggests the manager has superior security selection. Unfortunately, another knock against the ISD fund is its overly high distribution yield, which depletes the NAV over time. For those investors who stand by ‘income investing’, ISD may be a good choice to consider.
Be the first to comment