


imaginima/E+ via Getty Images
With gas prices soaring, it’s not surprising that I was recently asked if the Energy Select Sector SPDR ETF (NYSEARCA:XLE) was a good ETF to buy right now. Would buying XLE now protect investors from rising oil prices and be a good way to hedge against our current, very troubling inflation?
XLE’s Holdings are a Small Subset of The Stocks in the Broader Energy Industry
As its name suggests, XLE is a sector ETF, which means it only holds stocks that are classified as being in a specific sector, in this case the Energy sector. But it’s very important to note that XLE doesn’t hold all the stocks found in the Energy sector. The word “Select” in its title is there because XLE only invests in some Energy-related stocks.
The XLE product page published by State Street Global Asset Management (SSGA), tells us that XLE only holds stocks that meet two criteria: they are defined as energy-related stocks using the S&P Global’s general industry classification system (GICS) and the stock is found in the S&P 500 index.
As I have written in previous articles about other ETFs that follow other GICS sectors, in particular the GICS Information Technology Sector, the GICS sector definitions can be somewhat arbitrary. They are the jointly held product of two large index providers, S&P Global and MSCI, whose goal is to keep them attractive to their clients, the fund and ETF providers who pay for use of their indexes. As a result, the GICS sector definitions are subject to change if one sector becomes more successful than others, as the GICS shifts stocks from one sector to another to try to keep the performance of the various sectors balanced.
The GICS Committee Attempted to Add Alternative Energy Stocks to the Energy Sector Last Fall But Were Rebuffed by Stakeholders
Last fall the committee that chooses which stocks go into what GICS sectors proposed major changes to the holdings of several sectors. Among those changes were to move the solar and other alternative energy stocks out of the then-highly-successful Information Technology sector where they then resided into the Energy sector which at the time was in the doldrums.
But while all the other changes they proposed for the Technology sector last fall were approved by their stakeholders, the fund and ETF providers, the Energy sector changes were not. Solar and other alternative energy stocks remain in the Tech sector for now. But it is quite possible they may be moved in a few years when the GICS people decide to change their classification system yet again.
So for now, XLE still only holds stocks held by the S&P 500 that are classified as being in either the oil, gas and consumable fuels sub-industry or the energy equipment and services sub-industry.
If you download the list of these stocks, you might be surprised to see how few stocks are held by XLE. As of June 17, 2022 there were only 21. Energy sector ETFs offered by competing firms hold many more stocks. The Vanguard Energy ETF (VDE) holds 111 stocks. It holds Energy sector stocks of all sizes and degrees of profitability, unlike those held by the S&P 500 which must be large cap stocks with a history of a year’s worth of positive earnings.
The iShares U.S. Energy ETF (IYE) holds 37. IYE tracks an index that does not use the GICS sector definitions to define what stocks belong in the energy sector. Only the Invesco S&P 500 Equal Weight Energy ETF (RYE) has a similar number of stocks as XLE — 22. That is not surprising as this equal weighted ETF’s index, like XLE, only holds energy sector stocks listed in the S&P 500.
So given how few stocks XLE holds we already know that XLE is less diversified than other Energy sector ETFs, that it’s tilted towards the very largest companies in the GICS-defined energy sector, and that it excludes alternative energy stocks.
XLE’s Performance Compared to Other Energy Sector ETFs Is Inconsistent
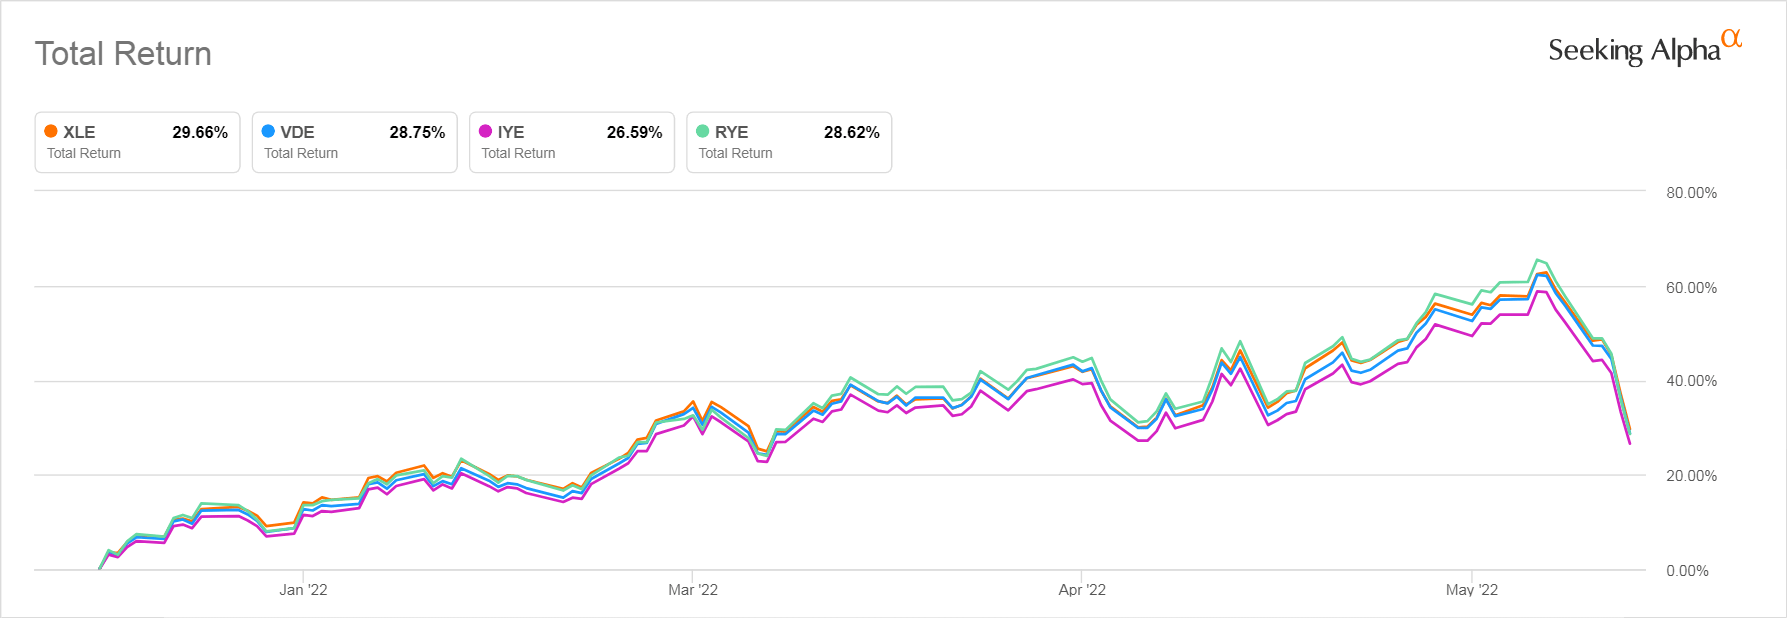
When I compared XLE’s performance since the beginning of this year, I found that it very slightly outperformed two competing Energy ETFs: Vanguard’s VDE and the equal weighted RYE. It returned a more significant 3.07% more than did IYE, the iShares’ Energy Sector ETF.
XLE, VDE, IYE, and RYE Total Return YTD – 6/17/22
Seeking Alpha
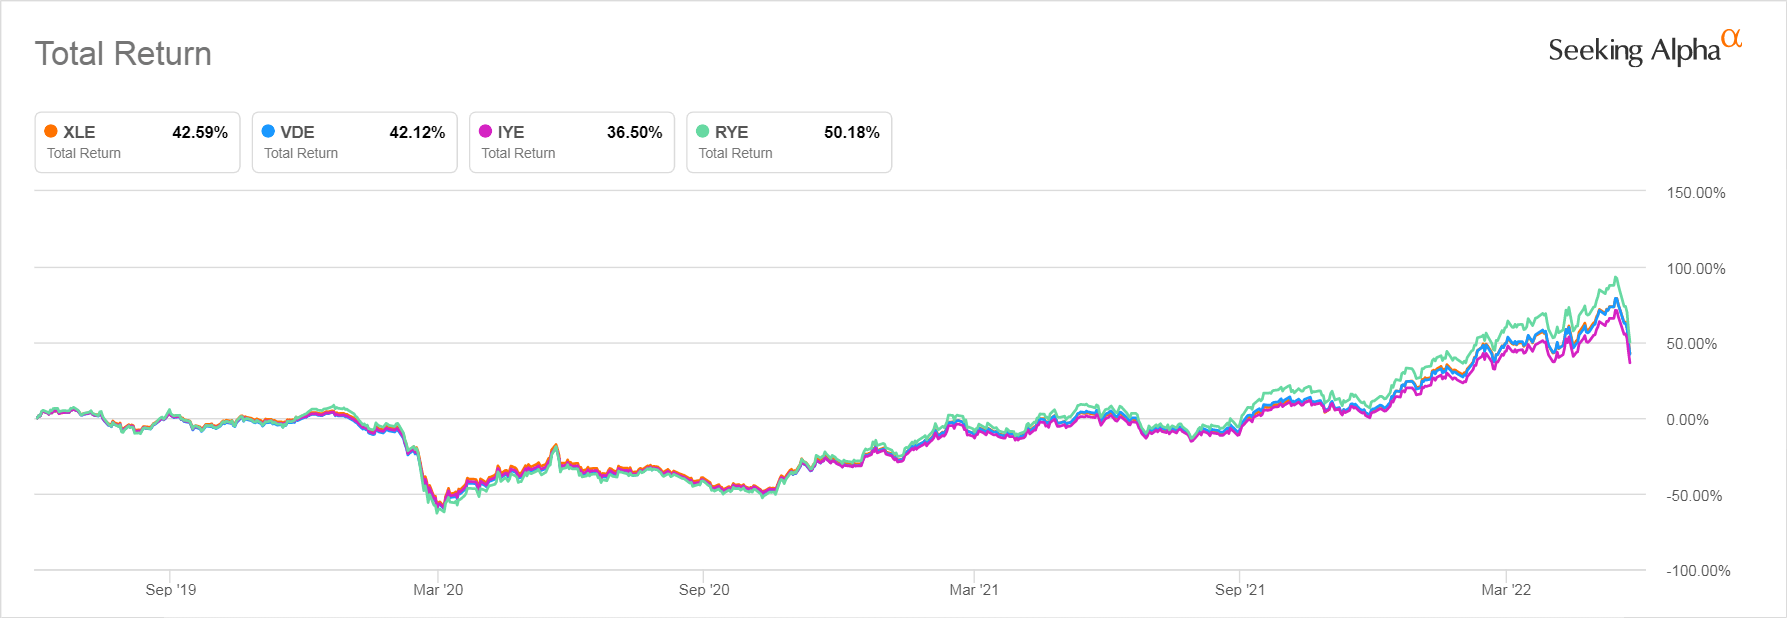
However, XLE’s performance over the longer term is not consistent. When we look at the most recent 3-year period, we find that the equal weighted RYE, provided a far better return than did the other ETFs we are considering. RYE returned 7.59% more over this 3-year period than did XLE. XLE and Vanguard’s VDE returned very similar amounts. And once again, IYE, lagged the other ETFs significantly over this longer time frame too.
XLE, VDE, IYE, RYE 3-Year Total Return
Seeking Alpha
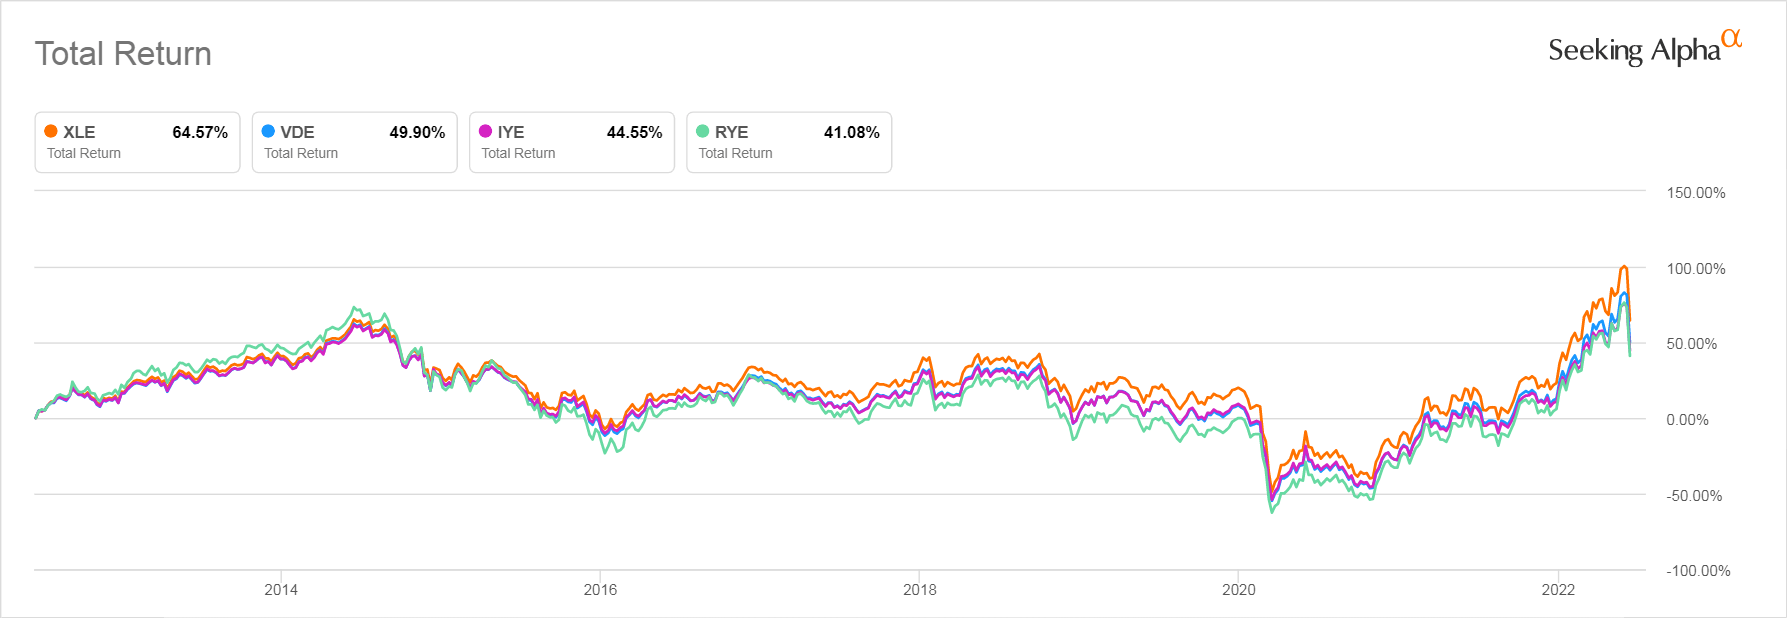
Going back even further, to 2012, XLE does dramatically outperform the others. I have my suspicions as to why, which will be explained later in this article. IYE continues to lag XLE and VDE, but the worst performer through this period is the equal weighted RYE.
XLE, VDE, IYE, and RYE 10-Year Total Return
Seeking Alpha
The inconsistent way that these ETFs have performed relative to each other tells us that there is no way to pick one Energy Sector ETF that can be depended on to always outperform the others through all different kinds of markets.
XLE’s Stocks Key Metrics
We get very little information about the stocks held in XLE from State Street Global Advisors, its provider. They tell us only that the Price/Earnings ratio of the index that XLE follows is currently 14.19 and that the ETF itself has an estimated forward P/E ratio of 8.20. They also tell us that the weighted harmonic Price/Book ratio of the ETF as a whole is 2.27 and that the Price/Cash flow of the index XLE follows is 7.30. This makes it look as if the ETF is very well-valued.
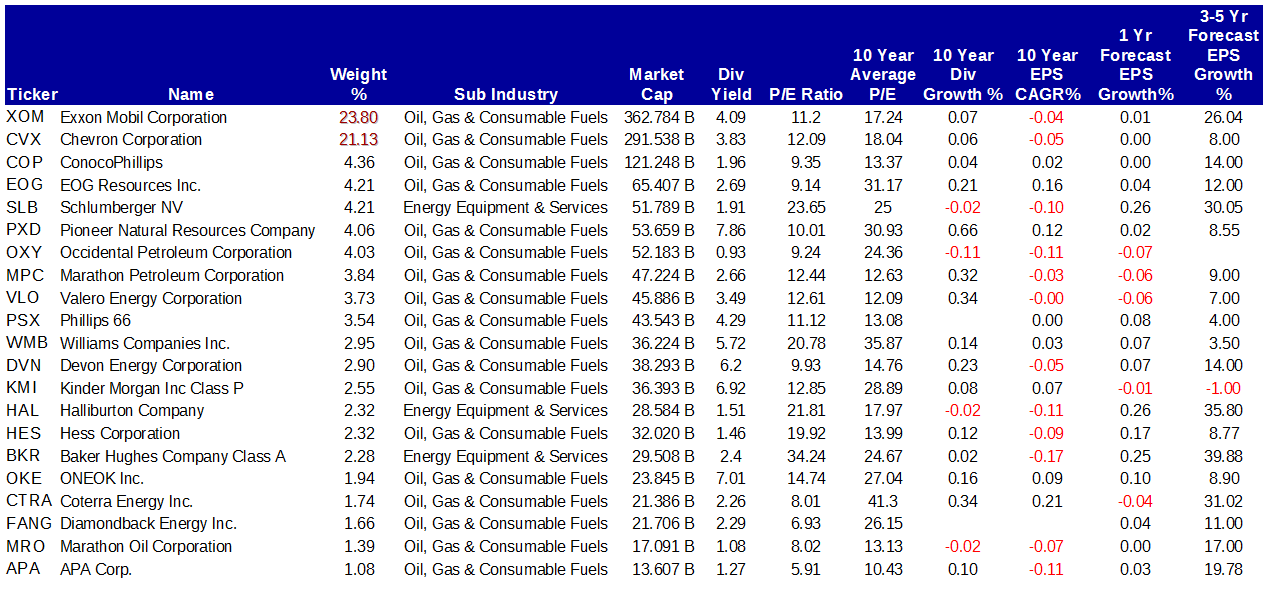
We can download the list of XLE’s 21 current holdings from SSGA’s product page and run them through Fast Graphs to learn a bit more about the stocks in this index, including what percentage of the whole ETF each stock makes up and what analysts currently expect each stock’s performance to look like over the rest of this year and over the next 3-5 years.
Some Pertinent Metrics for the Stocks Held in XLE as of 6/17/2022
fastgraphs.com
The first thing that stands out is that XLE’s performance is dominated by just two stocks, Exxon Mobil (XOM) and Chevron (CVX), each of whose weight dwarfs all the other stocks held in XLE as each, on its own, makes up over 21% of the total value of the whole ETF. The weight of the next largest holding, ConocoPhillips (COP) is less than one fifth of the weight contributed by either Exxon Mobil or Chevron.
Next, we notice that all but three of these companies are Oil & Gas drillers or pipeline companies. The Equipment and Services sub-industry stocks make up only 8.72% of the value of the entire ETF.
Finally, we notice that analysts are predicting very little earnings growth for most of these companies over the next year. The 3-5-year forecasts are more optimistic, but then the further away a forecast extends the more optimistic analysts’ projections usually are, as they are only trimmed as the report for that period nears.
Even for this future period the growth expectations for most of these stocks are fairly modest, with the three Energy Equipment & Services sub-industry stocks, Schlumberger (SLB), Halliburton (HAL), and Baker Hughes (BKR) being forecast as having the annual earnings growth rates over 30%. Of the oil stocks, only XOM and Coterra Energy (CTRA) are predicted to grow at an impressive rate.
When we sum up how much of the whole value of XLE is found in these few fast-growing companies, excluding XOM, we find they only currently make up 10.55% of XLE’s value. Thus, even if their price was to double, they would not dramatically raise the price of XLE.
This is especially true since another nine stocks that make up a much larger weight of its holdings are predicted — optimistically — to grow their annual earnings at only an annual rate of less than 10%. Those nine stocks together make up 56.72% of the total value of XLE. They are Chevron, Pioneer Natural Resources (PXD), Marathon Petroleum (MPC), Valero Energy Corporation (VLO), Phillips 66 (PSX), Williams Companies Inc. (WMB), Kinder Morgan (KMI), Hess (HES), and ONEOK (OKE).
This heavy concentration in just two stocks and one sub-industry and the relatively modest growth expectations for all of the stocks in that industry, save for Exxon Mobil, made me wonder whether the diversification this ETF offers provides any real benefit to investors.
Buying Equal Amounts of XLE’s Top 2 Stocks Has Outperformed XLE Over All But One Time Frame
To see how useful XLE’s mediocre diversification has been for investors, I compared the performance of XLE against that of Chevron and Exxon Mobile over a series of time frames.
The 10-Year Period
That review made it clear that over the past 10-year period, a portfolio made up of equal amounts of Chevron and Exxon would have dramatically outperformed XLE, returning 91.37% compared to XLE’s 64.57%. In every other time period except one, holding equal amounts of the two individual oil stocks would have outperformed XLE. The only exception I could find, using Seeking Alpha’s Charting Comparison tool, is the 3-year period starting in June of 2019 where XLE outperformed by 3.15%, but performance over that interval is heavily skewed by the pandemic.
But before you get too excited about investing in these two largest oil stocks, due to their outperforming XLE, you need to remember that over the same decade when an equal weighted holding of XOM and CVX would have returned 91.37%, the S&P 500 returned 175.26%, almost double the amount.
XLE, XOM, and CVX 10 Yr Total Return
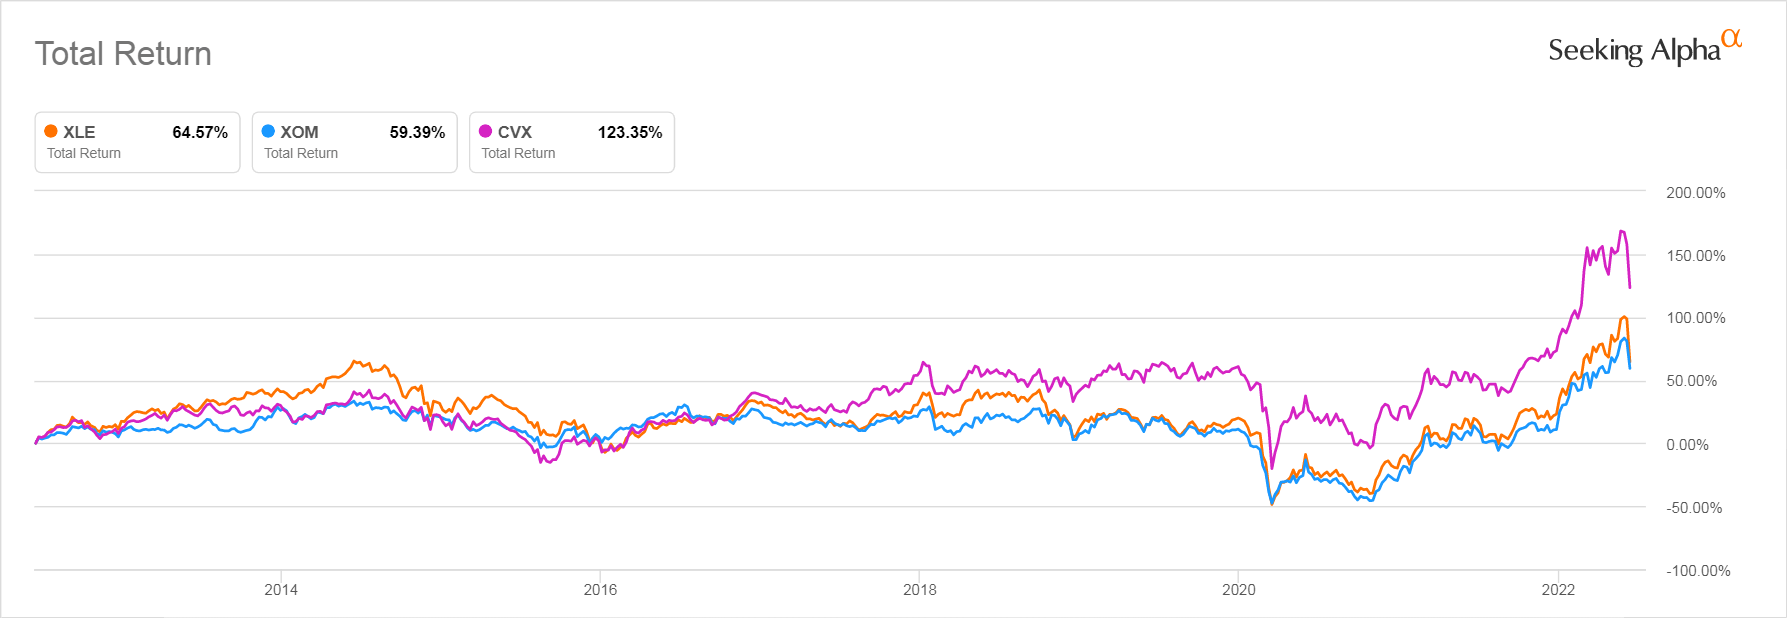
Seeking Alpha
The Past 6 Months Since the Russian Invasion Shrank the Oil Supply
Over the past six months, which is the period when oil prices have taken off, the difference in performance between XLE and a portfolio of the two oil stocks is not very different, but holding the two oil stocks alone would have still slightly outperformed XLE by 1.575%
XLE, XOM, CVX, and S&P 500 – 6 Month Total Return as of 6/17/22

Seeking Alpha
When Energy Stocks Declined Individual Stocks Still Outperformed XLE
The outperformance of holding equal amounts of XOM and CVX also held true during the past month when oil stocks have seen their prices plunge.
XLE, XOM, CVX, S&P 500 1-Month Total Return

Seeking Alpha
Holding the two individual stocks in equal amounts would have resulted in a loss of 10.465% slightly less than the loss of 11.43% you would have suffered with the ETF.
Clearly, you are not benefiting significantly from the poor diversification that XLE provides.
Is XLE A Good Inflation Hedge?
As the performance charts we just reviewed make clear, XLE was a very good hedge against surging oil prices for those who invested in it back six months ago, at the end of 2021, even if it wasn’t as good an investment as an investment in Exxon Mobil and CVX, the U.S.’s largest oil companies.
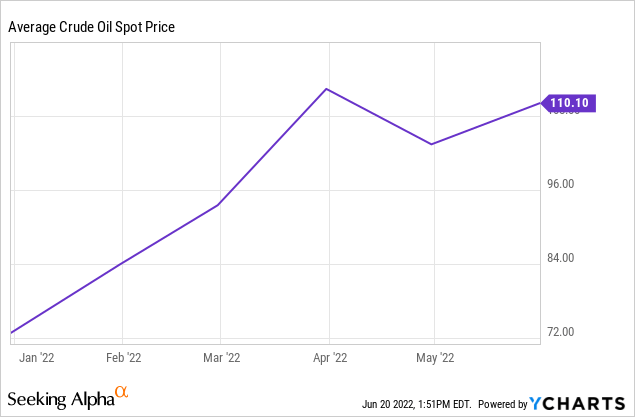
But be honest, back in December of 2021 did you have any clue that Russia was going to invade Ukraine on February 2, 2022, forcing the West to boycott its oil production, and causing the price of oil to double?
Unless you are a specialist in Eastern European political affairs, my guess is the answer is “no.” And I bring this up because inflation was already surging at the end of December for reasons that had nothing to do with oil.
Crude Oil Price Movement Since December 2021
Other Factors Besides Oil Prices Are Driving Inflation
The inflation that got started in 2022 was due to many factors. We can debate the fine points, but most investors will agree there are significant factors driving the inflation that began in late 2021 that have nothing to do with oil.
Several of these factors, which had nothing to do with the Russian invasion, are still driving inflation today. Several of these are:
- The huge amounts of money that the Fed pumped into the system which made stock and crypto prices surge to extreme levels, convincing a lot of workers they were rich and did not need to return to work. This has forced employers to raise wages and salaries.
- Shortages of many products and raw materials for manufactured goods due to lack of production during the several COVID-19 surges that spurred outbreaks that sent many workers into quarantine.
- The expansion of Work-From-Home which got highly-paid urbanites competing to buy up property in more rural areas around the country. This has greatly inflated property prices, which has made home buying impossible for locals who typically earn less, driving up the demand for rental housing and rents.
- The extreme 2022 Chinese COVID-19 lockdowns which halted the manufacturing and shipping of a huge percent of the hard goods American companies sell, including the computer chips found in everything from cars to “smart” light bulbs.
- Resurgent pent-up demand for all the things people had been denied during lockdowns like rental cars, hotel rooms, and plane tickets due to global populations bursting out of their homes after a year of lockdowns.
The Russian invasion of Ukraine’s impact and the subsequent boycott of Russian oil and gas by the Western Bloc countries added to these pre-existing inflationary factors. It has made inflation persist by raising the price of oil because that raises shipping costs for everyone who sells hard goods and also raises the price of the many products developed from petroleum.
But oil isn’t the only commodity that has been hit hard by the boycott of Russia, because, as investors are now learning, Russia and Ukraine were major sources for many vital raw materials. Ukraine is a huge grain producer. Russia is a major exporter, of Nickel, palladium, aluminum, platinum, steel and copper and also of the phosphates used world-wide for fertilizer.
With all these factors in mind, you can see that investing in oil alone isn’t going to protect you against all disruptions caused by a perfect storm of shortages hitting the Western world.
A Broader Commodity Investing Strategy Might Be a Slightly Better Hedge
Investing in an ETF that has a broader exposure to Commodities like the Invesco DB Optimum Yield Diversified Commodity Strategy No K-1 ETF (PDBC) might be a better way to protect yourself from commodity-driven inflation. PDBC invests in oil but also in several other important commodities, which has given it better performance over the past six months during which inflation has ramped up.
XLE vs PDBC Total Return – Past 6 Months
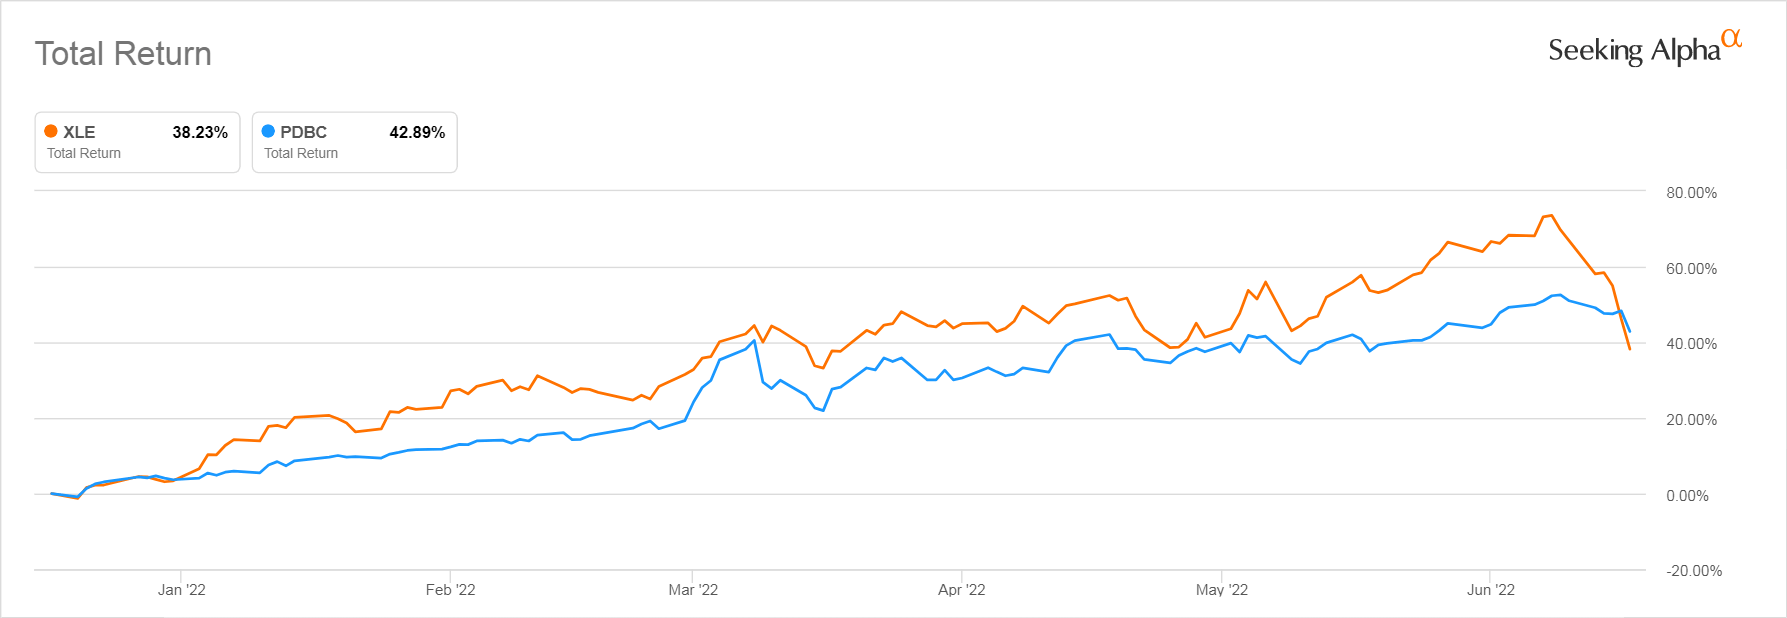
Seeking Alpha
The fact that inflation has continued to rise while oil prices have flattened out some in the past month as evidenced by the 11.43% decline in XLE we see in the 1-month chart above, suggests that investing in oil is not the magic bullet for fighting our current bout of inflation.
Even investing in Commodities will have a limited benefit. The impact of rising wages, bubbly property and rents, and the other, the non-commodity, pre-Russian invasion factors we cited are what is driving the Fed to increase rates in a way that many people believe will induce a recession which by reducing demand will send down the demand for commodities of all types.
Is XLE A Safe Investment?
That 11.43% one month decline we cited earlier should give pause to anyone who is thinking of buying XLE now for anything, but a very short term bet on oil prices. It is far from being a sure thing.
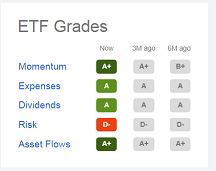
You might have noticed that Seeking Alpha’s Quant feature rates XLE as a Strong Buy. But this feature is, of necessity backwards looking. And though there is no doubt that XLE has had excellent momentum and Asset Flows over this past year compared to other ETFs, and that we all wish we had bought it back in, say, October, the Quant feature reminds us that its Risk level is extremely poor.
XLE Quant Rating
Seeking Alpha
A closer look at how the Quant feature assesses Risk is instructive:
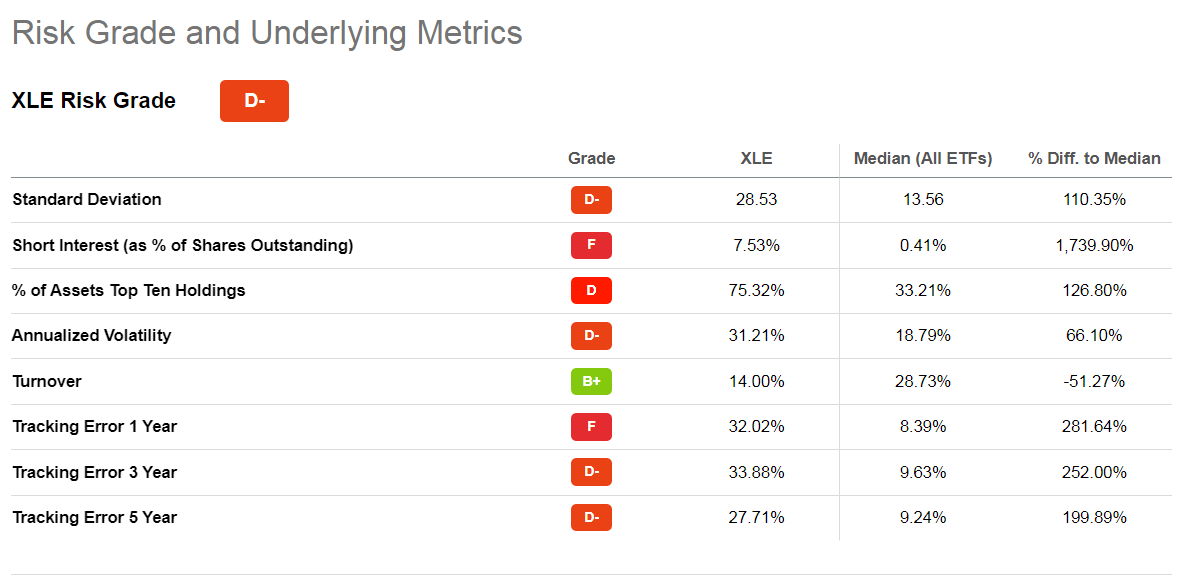
Seeking Alpha
The over-concentration in a few stocks that we already discussed is one problem cited here. So is the relatively high short interest, the sharp volatility, and its standard deviation (which I assume refers to its price action.) Then you have the tracking error, which may point to trading costs, salaries, and incidental expenses that are being taken out of the ETF’s NAV in addition to the declared 0.10% expense ratio.
As we saw when we discussed its performance earlier in this article, investors who jumped on the XLE band wagon just a month ago have lost more than did investors in the S&P 500 ETF. And remember, too, that investors in XLE who invested over the past decade did very poorly compared to both the top Oil stocks and the broader market. Safe is not the word I would use for an investment in XLE!
Is XLE Worth Investing In Long-Term?
Oil company earnings are highly cyclical. Just look at this Fastgraph of Chevron’s price, earnings, and dividends over the past 20 years — and remember that Chevron has dramatically outperformed XLE over the past decade.
Chevron 20 Year Price, Earnings, and Dividend History
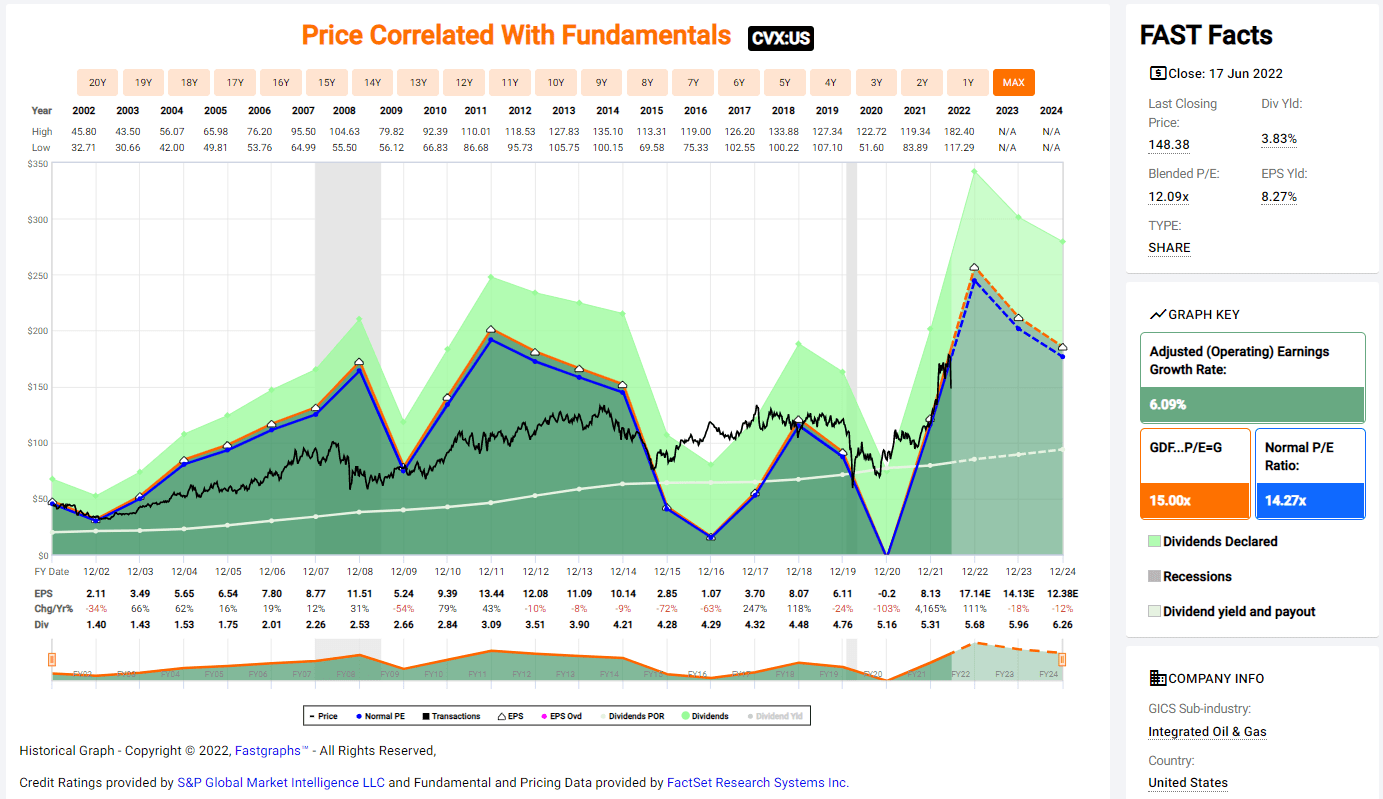
fastgraphs.com
The way in which oil company earnings rise and fall over longer periods of time make the oil-stock dominated XLE a poor investment for the buy-and-hold investor. It is more suitable for those who speculate over the short-term using ETFs.
So if you want to make a quick in-and-out bet on oil prices rising, by all means, buy XLE, especially if you are investing in a tax-advantaged retirement account where you won’t have to pay capital gains taxes on a short-term gain.
Oil Stocks Traditionally Appeal Because of their Dividends: XLE’s Are Disappointing
I mentioned that I would get back to why XLE outperformed its Energy Sector rivals over the past decade. The reason now should be clear. Its heavier concentration on just two stocks, XOM and CVX, likely means that it earned higher dividends than its competitors. You can see the current dividend yield of its 21 constituents in the table we looked at earlier in this article.
Though, as you can see, XOM’s current yield is still high, it’s important to know that XOM was yielding 5.70% at the end of 2021, before its price ran up in the beginning of 2022. CVX was yielding 4.52%. Their yields have dropped due to the run up in their prices since then but are still relatively high.
Those dividends matter because the mediocre price performance of oil stocks over much of the past two decades, has made their main appeal to investors their higher-than-market dividends. During the past decade of repressed rates, retirees have flocked to high dividend stocks to replace the income they could no longer earn from safer Fixed Income. The more concentrated the high dividend-paying oil and pipeline stocks have been in an Energy sector ETF, the more likely that its dividends would have contributed to a greater total return. With XLE’s very small number of holdings and its concentration in just a few stocks, the largest of which have always paid higher-than-market dividends, it is no surprise it outperformed over the low-rate decade.
But because it holds more than just these high-yielding stocks, the yield of XLE as a whole has never been as good as that of its top stocks. SSGA tells us that its distribution yield over the past 12 months has only been 3.24%, while XOM’s has been 4.08%. So again, investors who are investing in oil sector stocks for the dividends would do better to just buy the two top stocks in XLE.
You Can’t Count on GICS Not To Change XLE’s Holdings
As mentioned earlier, the people who decide what stocks go into what GICS sectors attempted to move Alternative Energy stocks into the Energy Sector this year but were persuaded to leave it as it is. That is probably because fund and ETF providers didn’t want to see the 2022 surge in the value of their oil sector offerings diluted by adding the other kinds of energy-producer stocks.
But if the oil sector lags again and alternative energy picks up, GICS will probably be allowed to add those energy stocks to its energy sector. This would remedy the problem of its current very small number of holdings and make it more attractive to younger investors. But it may leave investors in a taxable account trapped by capital gains in an ETF that no longer invests in what they thought they had invested in.
Is XLE Stock A Buy?
The answer seems pretty clear. Buy XLE if you want to make a short-term speculation on how the oil industry will perform. Even there, you might do better just buying XOM and CVX directly rather than this very poorly diversified ETF.
ETFs that invest in a broader range of commodities like PDBC are more likely to protect you against short term commodity shortages due to political developments, including oil. But the inflation we are seeing in the U.S. and Europe right now has too many different causes besides oil for an investment in oil stocks to be all you need to survive it.
The big money has already been made in XLE by those who bought it back before most of us knew what Russia had planned and what the Western Powers would do to attempt to hinder them.
Remember, too, that the more expensive oil becomes, the more incentive there is for nations to ramp up efforts to boost the production of energy from alternative sources that don’t expose them to the whims of the likes of Putin or the rulers of Saudi Arabia.
The great age of oil is probably behind us. Oil companies will not disappear, and will remain profitable for decades to come, but they will most likely go back to being slow growing legacy companies that are of most interest to investors who want to earn higher than average dividends.
And if you are a U.S. investor who wants to buy into the oil business right now, you’d probably be best advised to buy equal shares of the two biggest American companies, Exxon Mobil and Chevron rather than this over-concentrated, lower-dividend yielding ETF.
Be the first to comment