

J. Michael Jones
Company Snapshot
Truist Financial Corporation (NYSE:TFC) is a US-based super-regional bank that offers a range of services and products to both its commercial and consumer clients. The company is also noted for its insurance (a top 7 global player) expertise to both sets of clients.
TFC Annual Report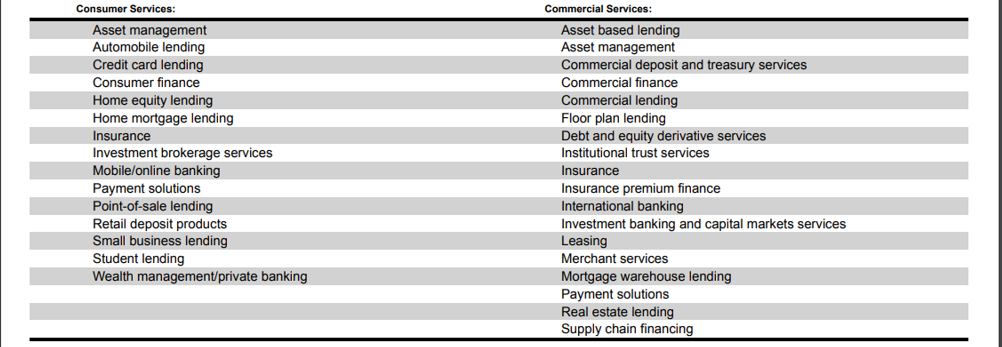
TFC has over 2500 offices and is considered to be the seventh largest commercial bank in the US. It has also built up a strong presence in its core markets, as exemplified by the fact that it is a top 3 bank in 17 out of its top 20 markets (Florida and Georgia are the top 2 markets jointly contributing 41% of TFC’s deposits).
Is Truist Financial’s Dividend Profile Good?
Towards the end of last month, Truist announced that they would be hiking their quarterly dividend (subject to board approval) by 8.3% to 0.52 per share (This would come into play by Q3). Whilst it isn’t a windfall of sorts and is below the average hike of 10% announced by other banks in this space, I still feel it should be taken well considering the circumstances.
Firstly, it is better than the 6.66% hike seen last year. Besides, if one considers YCharts estimates for FY22, that would imply an annual forward dividend payout ratio of 45%, which is much better than the typical 30% payout ratios seen in the banking sector. Crucially, also consider that on account of merger-related developments linked to the Kensington Vanguard acquisition, and a pickup in risk-weighted assets, TFC’s CET-1 ratio of 9.4% (as of Q1-22) was below the bank’s previously announced target of 9.75%. In light of these conditions, one could have been forgiven for expecting no dividend growth to have come through!
So, what has given TFC the confidence to push through with a high single-digit dividend hike? Well, for that you have to commend the company for faring reasonably well under the US Fed’s stress test. Whilst its CET-1 ratio of 9.4% is below the previously announced internal target, under the Fed’s severely adverse scenario, it is still 2500bps higher (excess capital) than the Fed’s minimum requirement of 7% (including a stress capital buffer of 2.5%). The other important point to note is that this specific stress buffer figure of 2.5% has been maintained for TFC for yet another year (from Oct 1st for a year); not all banks were able to maintain the same SCBs; for instance, Citi Bank will see a higher SCB of 4% from last year’s level of 3%.
Fitch Ratings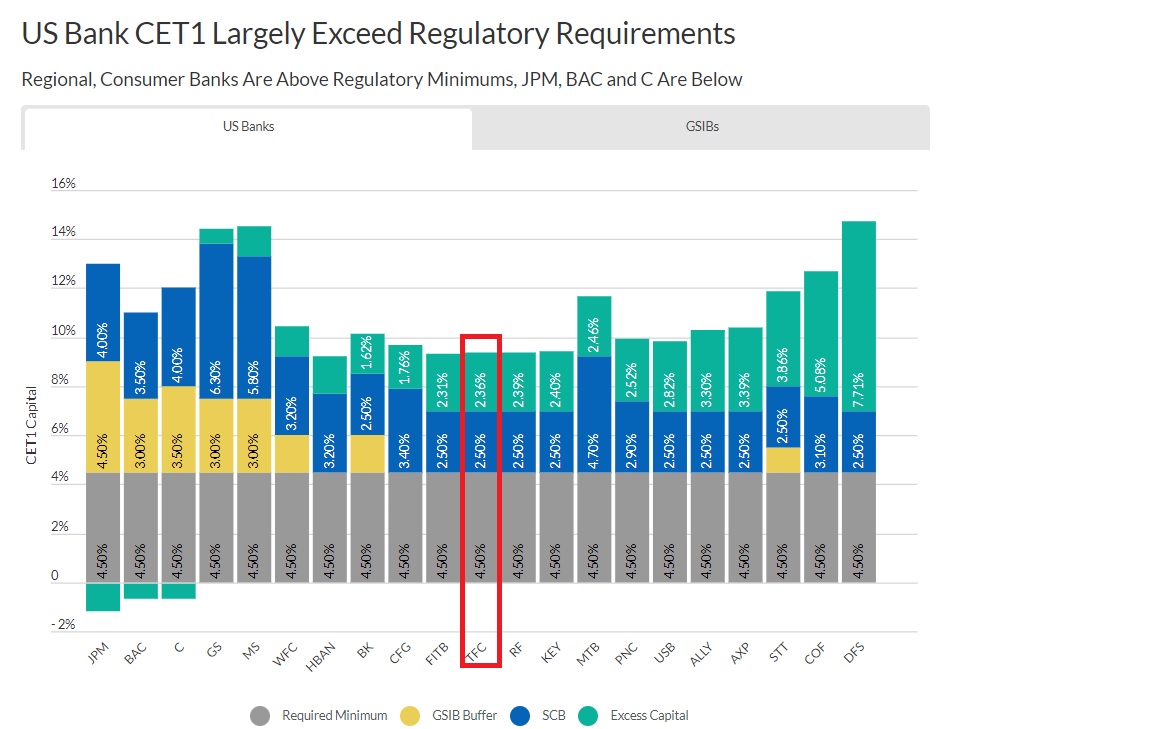
Besides, under the Fed’s severely adverse scenario, TFC’s loan loss rates were not expected to spike, and would be maintained at 5.7% for yet another year; that is quite unlike most of the other super-regional peers. The 5.7% figure is also incidentally the lowest amongst all the other major super-regional peers (loan loss rates for super-regional banks averages 7.4%).
Fitch Ratings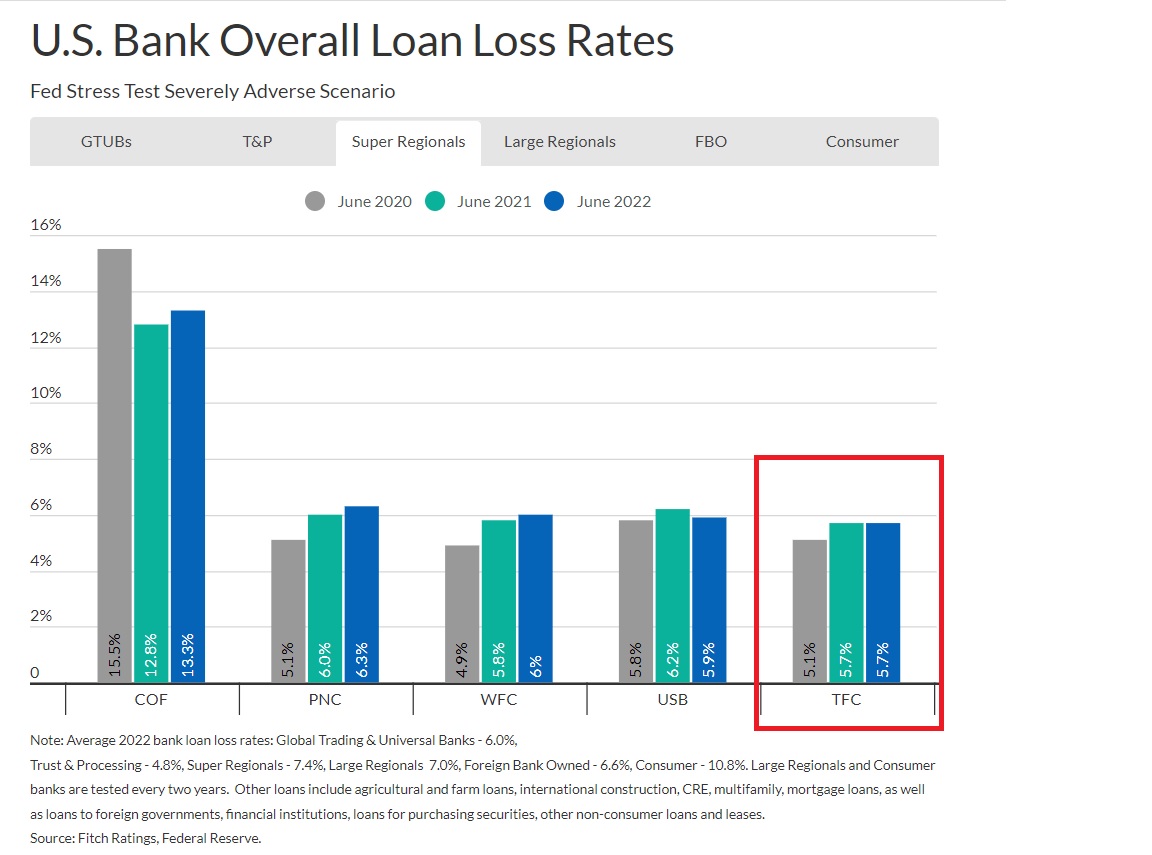
Whilst these recent stress test results have augmented TFC’s distribution profile, structurally there’s a lot to like about TFC’s dividend position. A quarterly dividend of 0.52 per share would translate to a solid forward yield of almost 4.4% at current prices. This is better than what you typically find in this sector (3.3-3.5%), and it is also substantially better than TFC’S own historical average of around 3.5%. TFC’s dividends are also quite reliable as it has been keeping at it for almost a quarter century (whereas most peers in this space have been only doing this for 13 years)
What To Expect From The Upcoming Q2 Earnings?
Truist Financial Corporation will also be announcing its Q2-22 earnings on the 19th of July and will be hoping to make up for a relatively disappointing performance in Q1-22 where it failed to meet topline expectations for the first time in 11 quarters. Just for some historical context, adjusted revenue declined by 4.4%, and was worse than the management’s guidance of a 1-2% decline. Failure to meet Q1 expectations may explain why a trust deficit has opened up, and why current revenue consensus expectations for FY22 (2.56%) are still below the management’s guidance of 3-4% annual growth.
Nonetheless, for Q2, analysts are still expecting negative revenue growth, albeit at a much smaller level of -0.5%. The GAAP EPS Q2 figure is expected to come in at 1.06, implying -9% earnings growth.
Prima facie, despite some fairly underwhelming headline numbers, there are certain nuances worth keeping an eye on. NII weakness likely bottomed out in Q1 and the quarters ahead (starting from Q2) will reflect sequential improvement even as the Fed continues to tighten aggressively. A gradual 100bps ramp-up could boost TFC’s NII by 4.3%, whereas in a shock scenario this could be up by 7.9%. Whilst the April hike of 50bps was on expected lines, it’s fair to say that the June hike of 75bps was unexpected, so potentially we could expect some upside surprises with the NII.
Q1-22 Presentation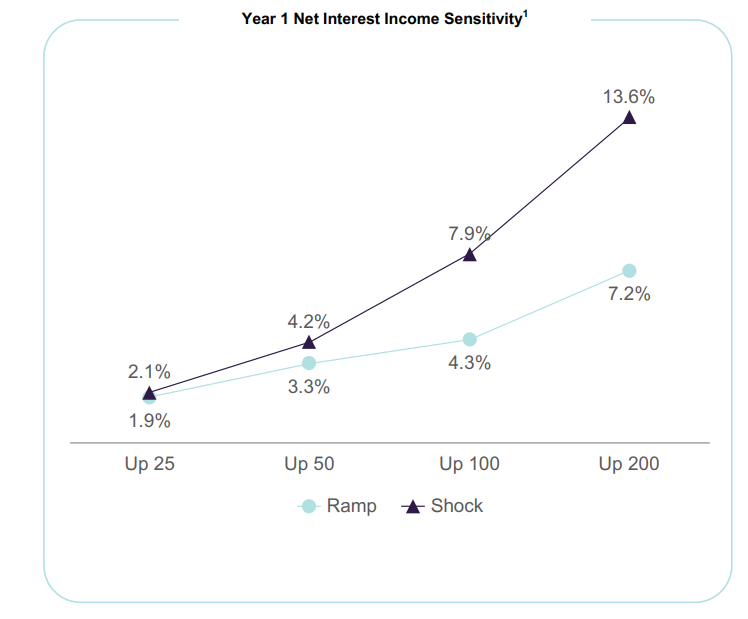
Weakness in non-interest income was one of the shocks in Q1 and investment banking/trading, in particular, proved to be worrisome, declining by 31% on a sequential basis and 25% on an annual basis. I don’t think Q2 will see the same level of weakness here and management had also flagged a healthy order pipeline at the end of Q1; nonetheless, TFC will be hoping to offset any weakness here with ongoing momentum in insurance revenue which had grown by 16% in Q1.
One other area where we could see significant improvement, is with regard to costs and operating leverage. For the uninitiated, TFC is in the process of bringing through another $500m of cost savings linked to its long-term plan of hitting $1.6bn of annualized cost savings by the end of FY22. So far whilst much of the adjustments linked to branches and FTEs have already been made, what’s left is developments tied to the decommissioning of various data centers and applications. Expect some progress here in Q2 as they are planning to trim their data centers and applications by 50% and 30% respectively before the end of the year.
What Are Some Of The Risks Associated With The TFC Story?
Whilst still a tiny figure, TFC’s net charge-off ratio (NCOs as a function of loans) of 0.25% tilts towards the higher end of the peer set range of 0.1%-0.28%. This is only likely to worsen to levels of 0.3-0.4% going forward.
TFC also has strong exposure to C&I loans (commercial and industrial) which account for the largest share of its total loan book (47%). Some components within the recent Composite PMI readings in the US point to some likely weak loan appetite ahead; new orders recently declined for the first time in two years. This is a shame, as industry-wide C&I loans in the US have only recently been witnessing positive growth after 13 straight months of negative or no growth!
FRED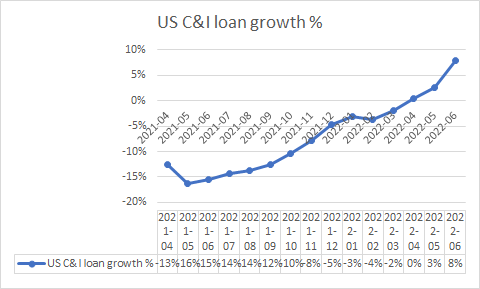
TFC’s non-interest income component, a notable contributor to pre-provision profits has been sliding sequentially since peaking in Q2-21. Expect these pressures to persist on account of lower mortgage refinancing activity and the advent of Truist One Checking Account that was introduced in Q2, which will result in a total obliteration of overdraft fees.
Q1 report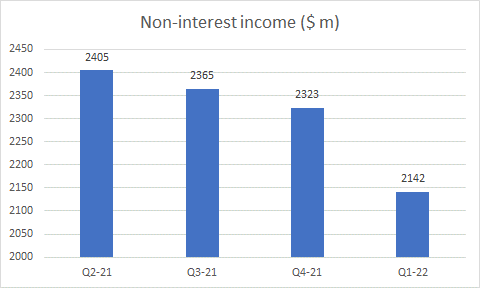
Closing Thoughts – Is TFC Stock A Buy, Sell, or Hold?
There are some promising aspects of the TFC stock that make it worth considering; NII weakness has bottomed out and will only improve from here, merger integration costs will dim, and operating leverage will come through in H2-2022. I’ve also covered how consensus is currently a little conservative compared to management guidance and there’s potential for some upward revisions here, which could prove to be a useful catalyst. Then, whilst I’ve already touched upon TFC’s comforting dividend profile, don’t also forget the buyback angle. TFC has an ongoing $4.2bn buyback plan that is due to expire in three months; at the end of Q1-22, they had only used up 38% of that war chest, so plenty of ammunition is still left to support the share price.
YCharts
The valuation picture too doesn’t look too prohibitive. TFC currently trades at a forward P/E of 9.56x, which is 12% cheaper than the stock’s long-term average of 10.83x. TFC’s forward P/E multiple is also lower than most of its other super-regional peers including, Wells Fargo (WFC), US Bancorp (USB), and PNC Financial Services (PNC) all of whom trade at double-digit P/Es.
Seeking Alpha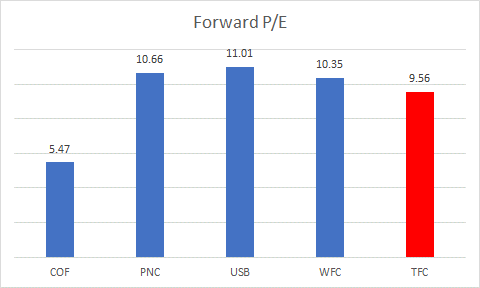
From a forward price to book value perspective, the valuation angle is equally compelling which TFC trading at a 12% discount to its long-term average of 1.21x, and an 8% discount to the super-regional peer set average of 1.15x.
Seeking Alpha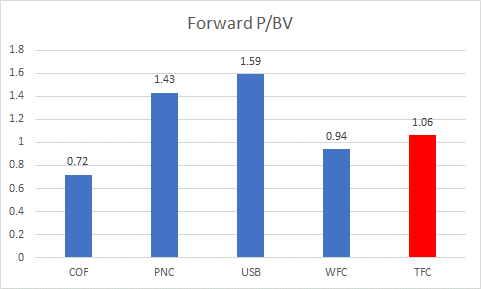
On the standalone TFC chart, the bears have had the upper hand for most of 2022, but post some strong selling in March and April, we’ve now seen a series of pin bar candles (long wicks), indicating some buying support around the sub $47 levels.
Investing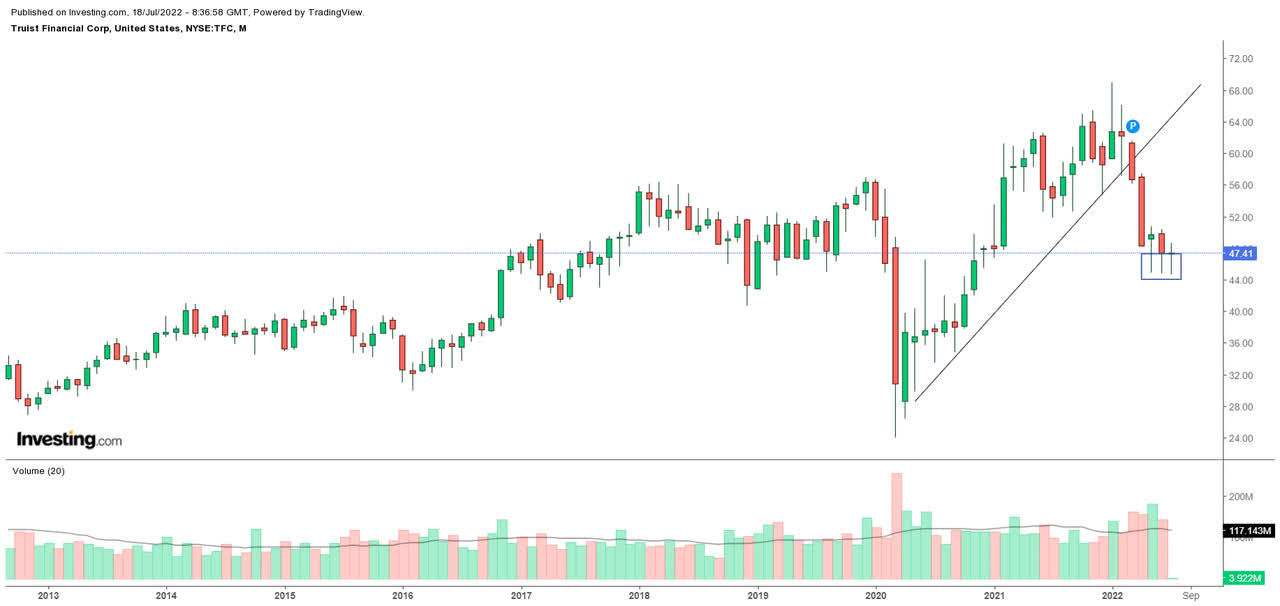
Also consider that TFC offers decent risk:reward relative to the broad US regional banking space. Compared to the iShares US Regional Bank ETF (IAT), the TFC stock’s relative strength is closer to levels last seen during the GFC crisis of 2009.
Stockcharts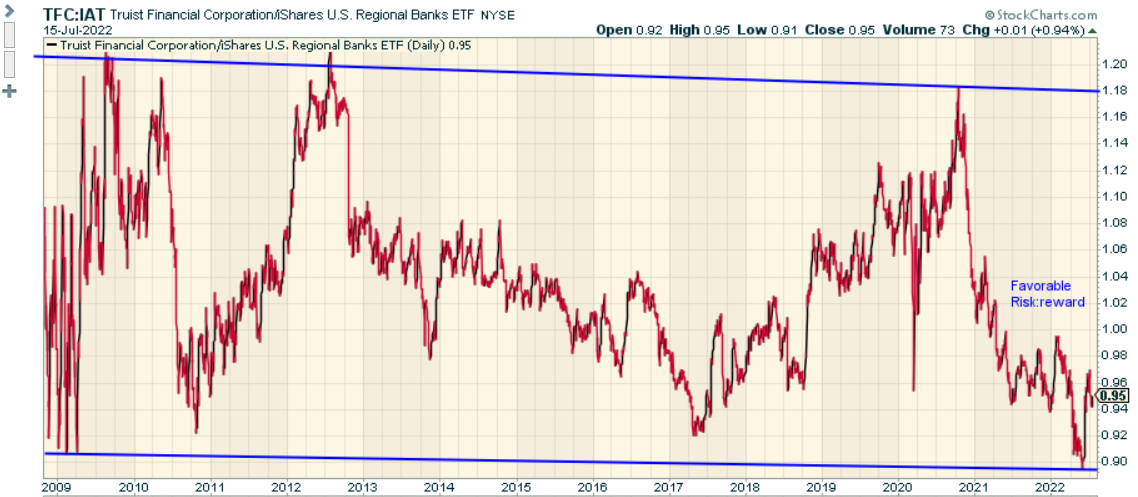
All things considered, at current price levels, I would rate the TFC stock a BUY.
Be the first to comment