

Justin Sullivan
After riding high following its public debut, Rivian (NASDAQ:RIVN) has come under increasing pressure. Although it shot as high as $172 last November, it plunged all the way to $24 just a few weeks ago. Now it’s back to $32, following reports that manufacturing is finally ramping up.
In part, it’s just the market punishing all growth stocks, but Rivian has issues of its own. Production was delayed more than once and 6% of its workforce was just laid off.
But most of these issues have already been explored by other authors. I certainly recommend those articles to you, but I want to look at Rivian a little differently. I’m honestly not too worried about their engineering or their workforce issues.
But I do have a different question that I want to explore: how will Rivian, or for that matter any other EV maker like Tesla (TSLA) or Lucid Motors (LCID) compete with the other kind of electric car?
Breaking Down The American Car Fleet
I am speaking, of course, of PHEVs (Plug-in Hybrid Electric Vehicles) which combine a gasoline engine with a much smaller battery, usually anywhere from 5-20 kWh. Rivian doesn’t produce PHEVs, and neither does Tesla; I think this is not only a mistake, but potentially a fatal flaw in their business model. The gap in efficiency and cost between EVs and PHEVs is so large that as electric cars, of both kinds, continue to penetrate the market, the shift from wealthy consumers who buy for social status or “green cred” to middle-class buyers who buy for economics and savings will probably swing demand strongly away from the former and towards the latter.
The primary difference between the two approaches is of course that a pure EV will always be electric while a PHEV will run electric until its (much smaller) battery is empty and then switch to gasoline. The implications of this for the lifetime value of the car and its economics obviously depends on how many miles will come from each fuel source.
Fleet Mileage
The distribution of miles across the American vehicle fleet at any given time is rather interesting. While average miles travelled per vehicle is 40 miles per vehicle-day, the distribution is uneven, with 61% of vehicle-days coming in below that mark. I’ve reproduced the relevant figures in the table below.
| Vehicle -Miles | % of Vehicle-Days | Vehicle -Miles | % of Vehicle-Days | Vehicle -Miles | % of Vehicle-Days |
|
0-10 |
12.5% | 40-50 | 11% | 80-90 | 2% |
| 10-20 | 17% | 50-60 | 8% | 90-100 | 2% |
| 20-30 | 17% | 60-70 | 5% | 100-200 | 6% |
| 30-40 | 14.5% | 70-80 | 4% | 200+ | 1% |
One complicating factor here is that this data was taken only from PHEV households. This means that it may predispose towards people who have vehicle-day mileage requirements that fall within the battery range of PHEV vehicles. That means that they probably under-represent at both ends of the spectrum, over indexing in the middle. In a standard Gaussian distribution this wouldn’t matter much, but because we know the curve slants so strongly towards the low end it could produce a number considerably too high.
Testing The Data
To test this, I extrapolated the figures above into a segmented linear distribution model with averages at the medians and derived a cumulative average excluding the residual segment, the uncapped 200+ segment whose range doesn’t have a maximum for us to derive a median from. Most studies define a US “long-distance road trip” as being between 100 and 500 miles, so we should probably define this group to be no less than 300 miles. I’ll ballpark the residual average there for now.
I then plugged the numbers into a table and tallied up how many Vehicle Miles Travelled it would create across the country’s population of roughly 260 million vehicles if the data were accurate. I expressed the segment weights as days per 100 instead of percentages, which is of course the same thing.
Extrapolation of VMT (Author’s Calculations)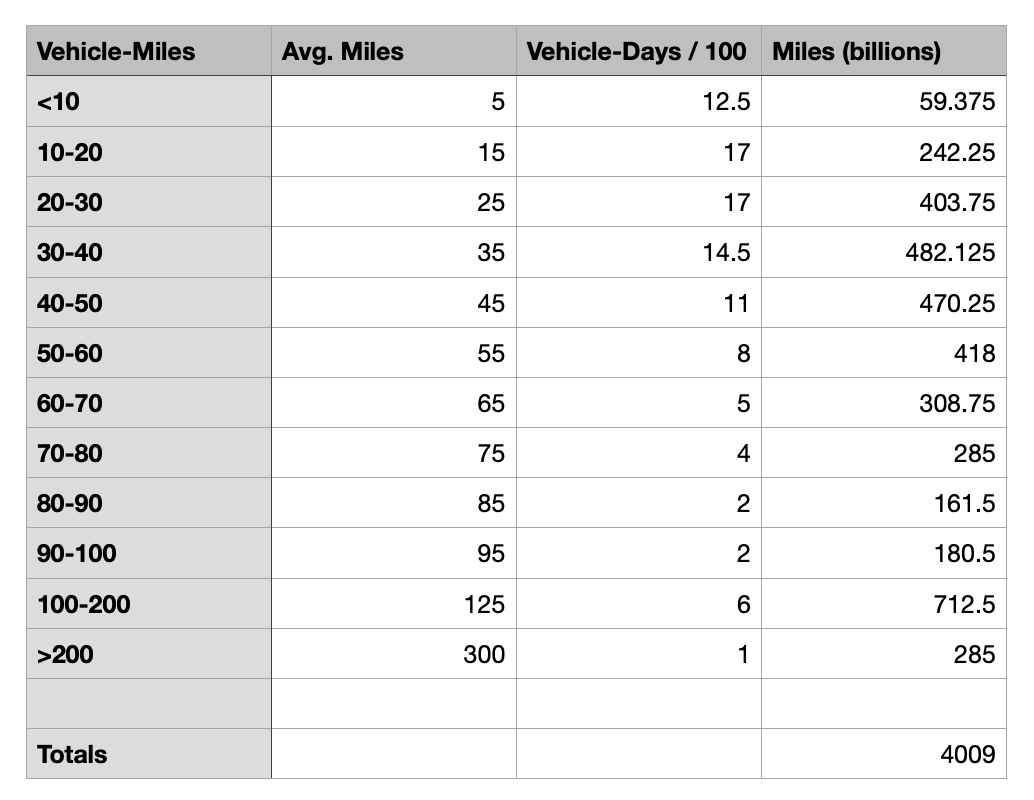
The result was indeed too high. An unadjusted extrapolation produces a VMT total of over 4 trillion. We know that’s too much. I’ve generally shied away from using post-COVID statistics because I’m not sure they’re normalized yet, although I know I’ll have to get over that at some point. For now, I’m going to use the 3.3 trillion VMT number the country was just short of in February 2020 when COVID struck. This is only slightly different from the 3.2 trillion I was using in my other research. Obviously, there is a discrepancy with our extrapolation.
Adjusting The Numbers
The explanation, as I’ve already indicated, is that this survey base is too inclined to take longer trips than the average American car owner. I was a little surprised how difficult comprehensive data like this was to find, at least from reliable sources. But there was one scientific study in Seattle which found that instead of 12.5%, 5-mile vehicle-days are actually over 20% of the total, and 10-30 miles, which we have at 34%, is more like 36%.
To reflect these adjustments, I increased the relative weights of the lower-bounded segments. I did this by adding additional days to their weightings while leaving the base days of the upper segments intact, so that you can see how much relative weight I added. Column D shows the percentage of total days of the new, higher sample base. The results are listed in Column F, with the original miles numbers in Column E.
Revised VMT Chart (Author’s Calculations )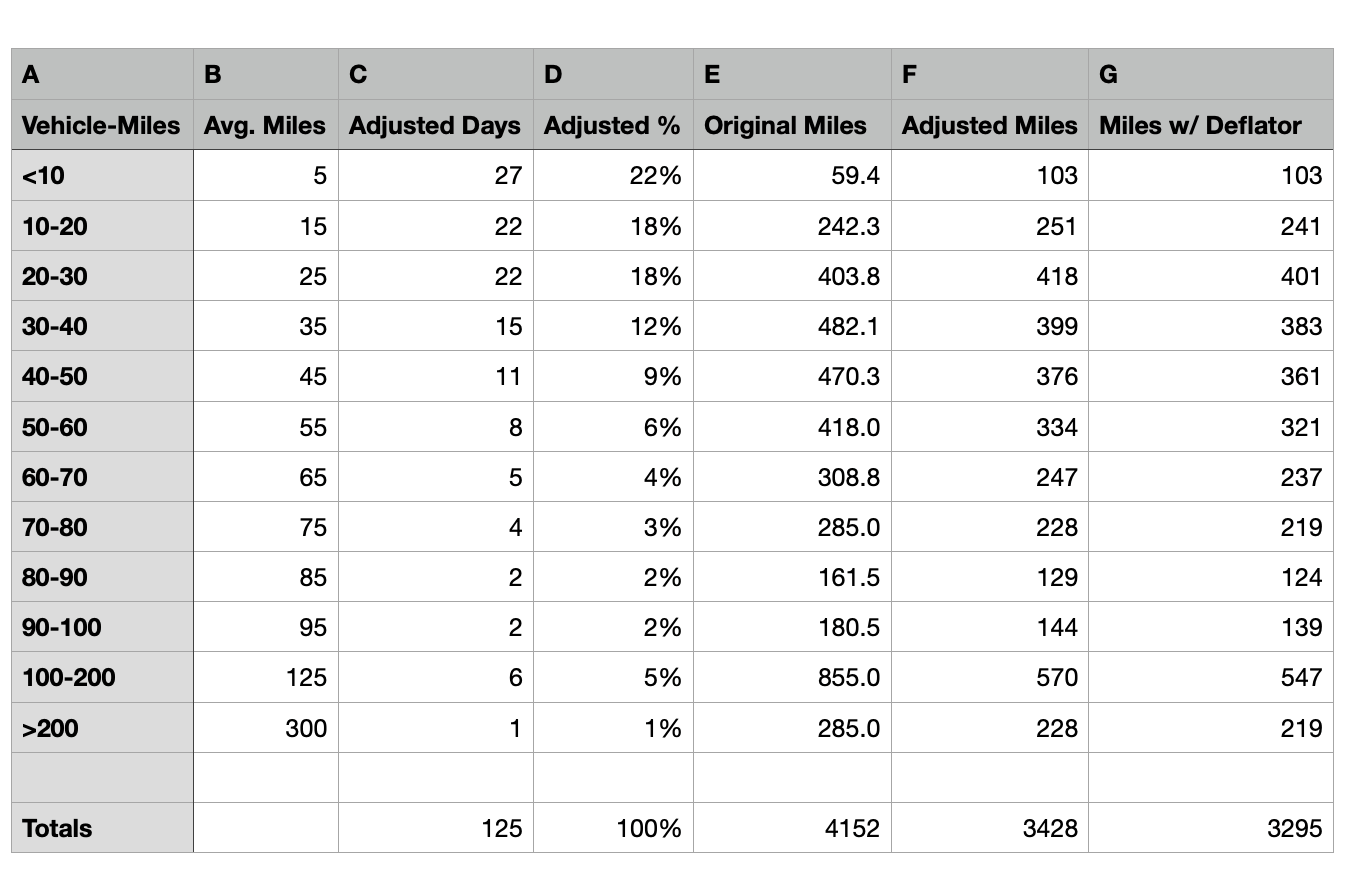
This gets us much closer. At a cumulative total of 3.43 trillion VMT it almost perfectly matches the Department of Transportation’s report. There is still a small variance, which is not surprising considering the limited data, as well as the fact that we are basically guessing at the mileage number for the last segment. It’s possible I set it too high, but to get it down to 3.3 trillion I’d have to cut the average mileage of the residual segment to the same 125 miles average as the preceding segment. Since this is the over-200 mile segment that doesn’t make much sense.
The variance isn’t that significant. But I do want things to line up. At this point, I can’t think what to do but apply a deflator. For the final column, every segment except the first – which is already so low that deflating it would basically confine the car to the garage – has a 4% deflator applied to the calculated total, giving us our final number.
Calculating Savings
The table tells us the distribution of miles, and through that the distribution of gasoline consumption. For EVs, this is a complete chart, then; since EVs never use gasoline, any miles travelled by definition represent gasoline savings.
But for PHEVs, it doesn’t tell us the distribution of gasoline savings across different battery sizes. Not yet. The reason is that even if a PHEV travels beyond the range of its battery, it won’t use liquid fuels for the whole trip. Only that portion of the trip which follows the battery being depleted. So on an 85-mile trip, a 55-mile battery will still get full use. Meanwhile, a 55-mile battery actually doesn’t deserve full credit for the savings created on a 55-mile trip, for the same reason: if the battery had been a 35-mile battery instead, it would have cost the driver 20 miles of gasoline, not 55.
If we defined 55-mile battery savings as equal to the miles travelled in the 55-mile vehicle-day segment, we’d be wrong twice. What we need is to calculate, for each battery size, how much extra fuel we save over the preceding size.
To account for this, I created another table where each segment is expressed as the marginal miles added over its immediate predecessor. Consumers tend to measure their fuel operating costs in gallons rather than miles, so I’ve also included a conversion to gasoline savings. The ‘Base’ is the number of vehicle-days nationwide, assuming just over 260 million vehicles.
For our purposes, I am assuming fuel economy is constant across segments, which allows me to plug in a linearly-extrapolated corresponding gasoline savings for each segment. US drivers consumed 8.8 million barrels a day of gasoline in 2021, which pencils out to about 135 billion gallons per year. I divide total VMT by that number and then divide the marginal and cumulative miles saved by each segment by that number to produce a gas savings. Miles and gasoline are both expressed in billions.
Gasoline Savings Chart (Author’s Calculations)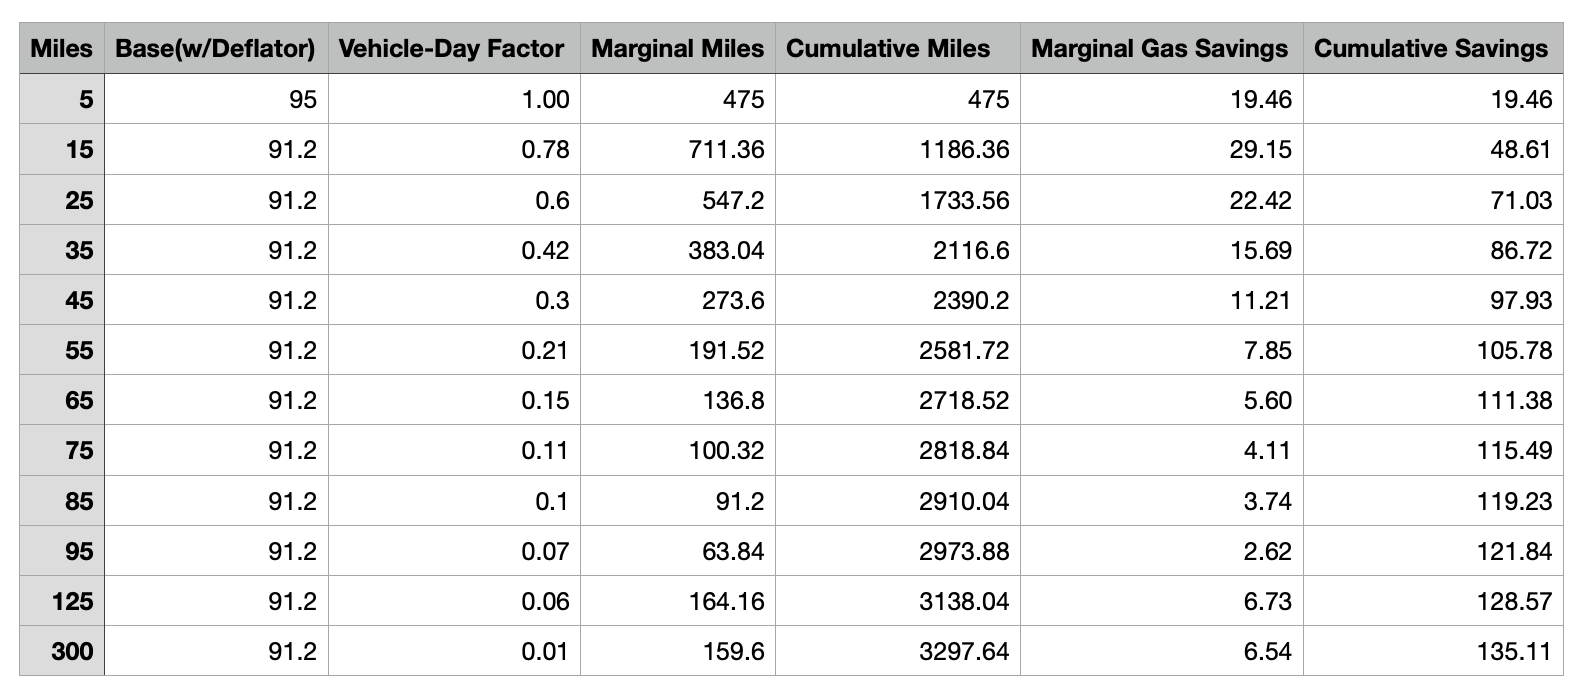
Analysis Implications
As you can see from our finished product, the asymmetrical distribution of miles across vehicle days produces some pronounced slants in the savings created by lithium-ion batteries. First of all, as one would expect, there is no point along the curve where the rate of savings is higher than the preceding battery size; the smaller number of the 5-mile segment to the 15-mile ignores the fact that it only requires half as much lithium to add 5 miles as to add 10 more – the marginal addition of the 15-mile segment – so the rate of savings in the initial column is actually 950 billion on a 10-mile basis.
If that was a little too convoluted, a simple illustration is this: assume that it takes 3 kWh to go 10 miles. The 5-mile battery at the top of our table is saving 475 billion miles with 1.5 kWh. If I create two more 5-mile batteries, requiring 3 kWh, and put them in two more cars, I will save another 950 billion miles. If I take that same 3 kWh and use it to extend the battery in my existing car, I will save the 711 billion listed in the second row of the table. The returns on lithium just get worse from there.
So adding more battery capacity to an existing EV or PHEV never saves as much gasoline as putting lithium into another car.
By itself, there is nothing particularly surprising about this: we see the same law of diminishing returns all over the market in all different industries. But it still illustrates an important point: from the perspective of reducing gasoline consumption – which is the whole objective of EVs, regardless of whether your particular motives are environmental, economic or national-security based – the most efficient distribution of lithium is to spread it evenly over the vehicle fleet, not concentrate it in a fraction of the fleet with ever larger batteries.
Implications for Rivian’s Strategy
This is precisely the opposite of the strategy Rivian and other EV-only automakers like Tesla and Lucid are pursuing. The way Rivian approaches the market, a small segment of consumers buys an electric-only model with a massively sized battery, while everyone else continues to buy gasoline-only models with no batteries from other manufacturers.
This strategy is, of course, merely a duplicate of the one Tesla has been pursuing for a decade, so Rivian is hardly off the well-beaten path with this approach. But respectfully, there is one major difference between then and now: back when Tesla was just getting started, no one besides Tesla sold Electric Vehicles. Which meant that Tesla didn’t have to worry about being particularly efficient with its lithium production because no one besides them was buying lithium, and the idea of shortages was only a distant prospect.
The situation today is very different. Pretty much everyone and their mother is trying to sell electric cars. And, as I noted last week, there is only so much lithium to go around. But not everyone is selling EVs like Rivian and Tesla. Some, like Ford (F) and GM (GM) are selling PHEVs, which because they are so much more efficient can bid more for the same lithium supply than Tesla and Rivian reasonably can. Which means that efficiency will soon be the name of the game, getting as many bucks for the pound as possible.
One Final Question
Of course, the mere fact that lithium will always be relatively more efficient spread evenly than concentrated, does not by itself establish that lithium is being marketed inefficiently by Rivian. Lithium offers at least some benefit at all segments of our table, so as long as it is producing more savings than it costs a buyer may be tempted even if they can’t use it as well as someone else who, for whatever reason (low-income, lack of interest) isn’t buying.
But that just raises the question: do lithium batteries save money? We need one last table.
Big Green Means Big Red
In order to test this point, we need to calculate savings – which we’ve already done – but we also need to calculate costs. We can’t just plug in the cost per kWh of lithium battery cells. Not only does that ignore the work Rivian does integrating them into the actual cars, but it also ignores that adding more batteries, i.e., more weight, to a car increases various associated costs like the amount of structural support the chassis requires, and perhaps certain safety features needed to accommodate the higher electrical output.
I tried to determine the amount of associated costs, as well as direct costs, that come with a bigger battery, but this proved surprisingly difficult to do. Even when a detailed breakdown of costs is provided, manufacturers and even independent experts rarely spell out exactly how much of those costs are fixed and how much are “ramping” as engine output or battery storage goes up.
A Single Source
There is one interesting data point that I could find. In 2016, Nissan (OTCPK:NSANY) began selling its Leaf at a base price (lowest trim) of $29,010 before any tax credits. Since all its other trims had a 30 kWh battery, Nissan decided midway through the year to upgrade the base S to the same 30 kWh. But it didn’t upgrade anything else in the vehicle. So presumably, when it announced that it was also hiking the price of the S to $32,450, this higher price was solely owing to the bigger battery.
At $3,440 of new costs, this pencils out to approximately $573 per kWh. At the time, in 2016, the price of lithium-ion batteries was $273 per kWh. So Nissan was selling at exactly a $300 per kWh premium to the battery cost itself.
I know it’s not much to go on. Nissan could have hiked the price higher because of demand or just to experiment with higher margins. But I am convinced that we need some kind of multiplier to account for the other costs that more battery weight creates, and I don’t have a lot to go on.
One Final Table
If we plug in this $300 per kWh as a fixed per-kWh cost alongside the battery costs themselves, which have fallen to $132 per kWh for the moment – though they’re expected to go back up even by those who don’t anticipate a drastic bidding war – then each kWh of battery capacity adds $432 to the cost of the car. I will assume relatively efficient electric drive efficiency and pencil in 4 miles per kWh.
The hardest part might be deciding what gas price to use, to convert gallons to dollars. Right now, obviously, gas prices are ridiculously high, but the Ukraine War won’t go on forever, whatever the outcome. President Biden seems increasingly inclined to remove the artificial constraints on shale production – though the government isn’t the source of all those artificial constraints – so there seems good reason to think that whatever the long-run price of gasoline is, it is probably less than what is being charged now. I used a $3.50 and $4.50 base, so you can decide for yourself. I don’t think a long-term price above $5 is realistic. All numbers are in billions.
ROI Of Larger Batteries (Author’s Calculations)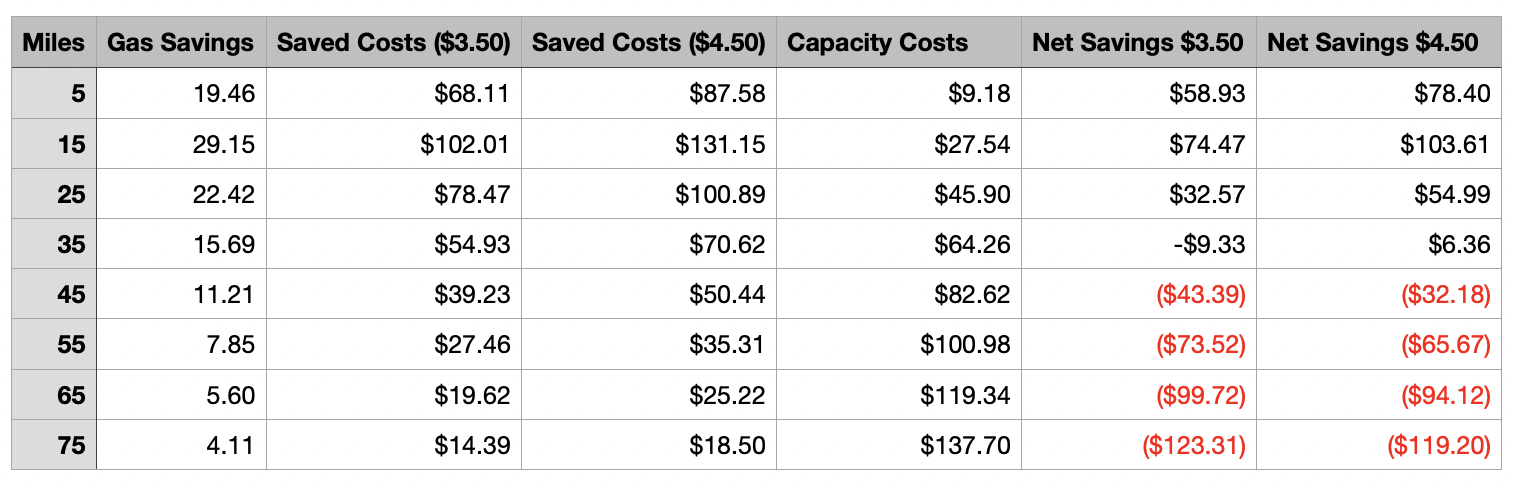
As you can see, returns are extremely high in the first two tiers and more than adequate in the third. Past that, however, returns not only drop off, they fall into negative territory and never recover. I stopped at 75 miles because it just kept getting uglier.
This means that not only is lithium relatively inefficient at higher capacities, but is inefficient in absolute terms as well. Any battery size over 35-mile range – around 9 kWh of capacity – produces negative incremental returns on marginal capacity additions. With Rivian selling 135 kWh batteries, the 126 kWh producing negative returns accounts for an imputed $54,000+ of the car but only delivers a fraction of that amount in savings. And this is nothing to do with engineering or battery efficiency or anything else that Rivian might reasonably expect to fix later with more time or greater efficiencies of scale. It is, rather, intrinsic to how its customers drive and live.
Conclusion
In my opinion, a coming bidding war for lithium will substantially increase its price over current levels. But even if you disagree with me about that, a more fundamental problem is that most of the lithium in these batteries is already producing a negative economic return, even if the price doesn’t budge. Any fall in gasoline prices back below $4 average would further compromise the economic case for these batteries.
My view is that PHEV is fundamentally superior to EV, regardless of carbon regulations or gas prices. It just seems like too big a gap to close. I believe that pure EVs are going to come under increasing pressure as the benefits of PHEV become more clear to consumers and, perhaps, to regulators as well. Accordingly, I am avoiding Rivian, and considering opening a short position.
Be the first to comment