

cagkansayin
Several recent articles in mainstream media including this one in Barron’s have noted that bonds are now officially in a bear market. What does that mean and what are the implications for possible bond investors? For decades the 60/40 stock/bond portfolio was the standard for conservative investors. Vanguard prominently displayed tables like this one showing that going back to 1926 having a 40% allocation to bonds greatly reduced the frequency and severity of drawdowns without reducing returns by much (about 1.5% annualized). Those tables were also structured so as to suggest that investors should be mainly in stocks when they are young but add bonds in 10% increments as they grew older and approached retirement.
Why, then, have there been articles for several years arguing the 60/40 stock/bond ratio no longer works and bonds make no sense as part of your portfolio? The simple answer is that bonds have done so well for so long that their major source of return – the coupon they pay – is so low that they no longer fill the role of ultra safe investments with a modest return. The long term (100 year) average return of bonds is about 5%, half that of stocks. Bonds as exemplified by the Vanguard Total Bond Market Index ETF (NASDAQ:NASDAQ:BND) started 2022 with a coupon yield of 1.7%. For this reason investors cautiously holding cash were inclined to hold money market funds or short term CDs while waiting for a better opportunity.
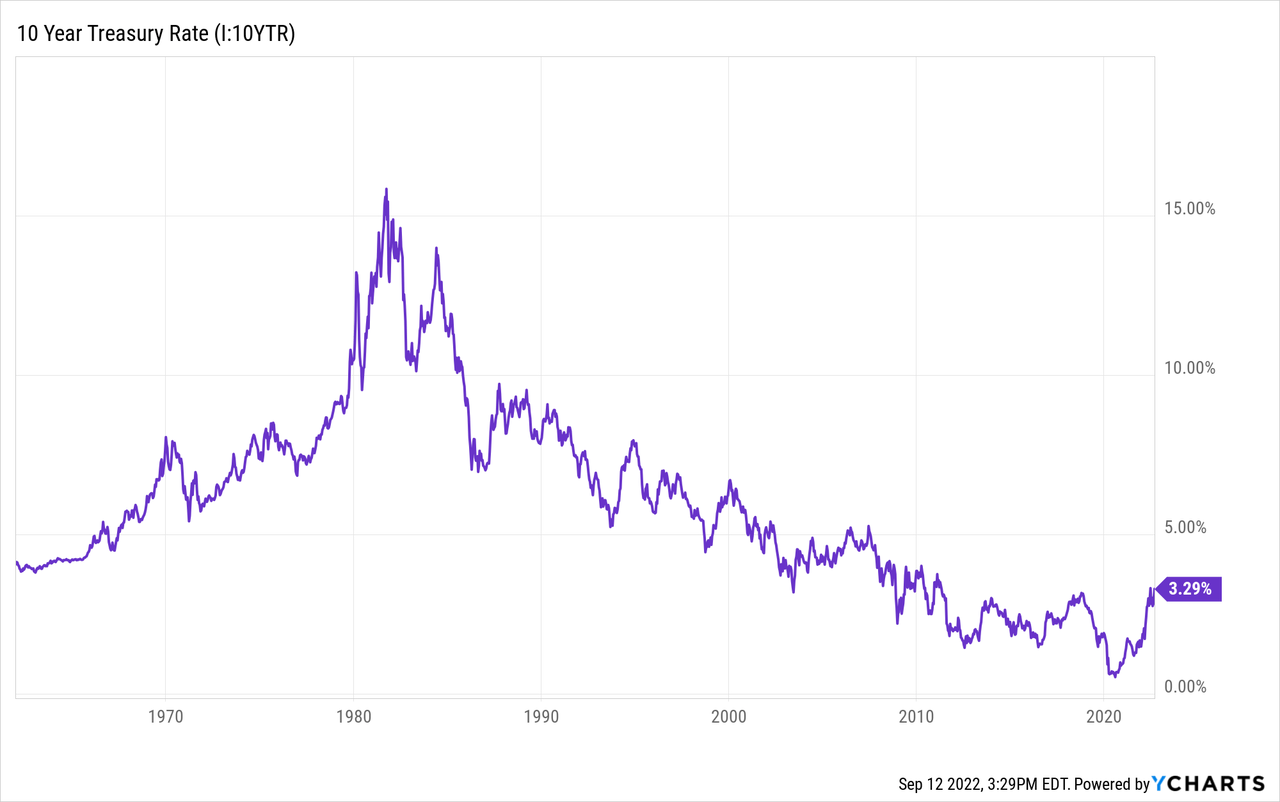
A forty-year bull market in bonds basically took away the coupon return and ended the role they had played in many portfolios. A few years ago Bill Gross, the former bond king and inventor of buying bonds for total return, acknowledged that much of his success came from the great good luck of having his career coincide with the great bond bull market. The great bond bull market began in 1981 with the 10 year bond rate around 16%, a rate which continued to fall with astonishing persistence until it reached a bottom on March 8, 2020 with the 10 Year rate at .32%.
The chart below shows the long-term history of 10-Year Treasury Interest Rates going back to 1960. Its accelerating rise through 1981 includes the high inflation of the 1970s. If you invert the chart, you will get a picture of the 1981-2021 bond bull market. Notice the sharp peak from which it began. You can see the actual bottom of rates (the peak of the bond bull market) when the 10-Year Note fell to .318% on March 8, 2020. It was followed by the small run-up of rates into the present. Investors should make a mental map of this chart and keep it in mind whenever thinking about rates and bonds:
On January 21, just seven and a half months ago, I published this article on bonds arguing that bonds of all durations offered such a meager return that they weren’t worth the risk of rising rates. At that time neither individual bonds nor the diversified Vanguard Total Bond Market ETF were a good bet for either short-term or long-term investors. If you follow bonds at all, you know that this advice was timely. Now, however, the situation has changed as the Fed increased rates and as a result bonds deserve a second look.
Some Basic Facts About Bonds
Here are a few important basic facts about bonds:
- Bond yields and bond prices are inversely correlated. When yields go up, bonds go down and vice versa. That’s not a projection or prediction. It’s a simple mathematical fact.
- You may own either individual bonds or bond funds.
- If you own an individual bond you know exactly what you are going to get and when you are doing to get it. Many who own individual bonds do so in a ladder, staggering the time of maturity and rolling over to a new bond when an old one matures.
- Bond funds are convenient. If you don’t have a thorough understanding of bonds, you might prefer using a low cost index fund or ETF like the Total Bond Market ETF. Its average maturity targets 5-10 years.
- Both individual bonds and bond funds have a “duration,” which reflects the different times you receive your return, combining periodic coupon payments with the final return of face value.
- Higher coupon rates produce shorter duration as more investor money returns earlier. You will notice in the tables below that the portfolio duration for the BND ETF dropped slightly as the average coupon yield increased.
- Macaulay duration estimates how many years it will take for an investor to be repaid the bond’s price by its total cash flows. (You can look this up on Investopedia – Duration Definition.)
- “Modified” duration measures the price change in a bond given a 1% change in interest rates. I always take a quick look at this form of duration when considering a fund or an individual bond.
- Bond returns are a combination of coupon payments and capital gains or losses which result when a bond falls or rises in price. When rates rise as they are doing currently, bond prices decline and may produce capital losses as they have so far this year.
- A general rise or fall in rates is reflected not only in newly issued bonds but in all traded bonds. If a bond was issued when yields were 2% and rates then rise to 3% its price must decline to the price at which the current yield to maturity including properly discounted coupon payments rises to 3%.
The inverse relationship between bond prices and interest rates is helpful when understanding the relationship between stocks and bonds. Warren Buffett has often described stocks as “equity bonds” as in this famous 1977 article in Fortune. Buffett treats stocks as a special case of bonds which differ because they are perpetual (which with one or two rare exceptions bonds are not) and because they have the potential to increase their earnings and dividends in the future, which bonds cannot do. Bonds are generally perceived as safer while stocks have produced higher return in the long run. Rising inflation is bad for both bonds and stocks while falling inflation is good for both unless stemming from a recession.
Do Bonds Provide Diversification And Smoother Returns?
The short answer to this question is sometimes. A better question might be: how often have stocks and bonds trended in opposite directions? Those Vanguard allocation tables notwithstanding, there have been very few such occasions. Except for a period as short as days and weeks, bonds and stocks have seldom trended in opposite directions. Bonds have won big when safety was the main thing. Stocks do better with economic growth and moderate inflation.
Owning high quality bonds was extremely helpful in the 1929 Crash and the first years of the Deflationary Depression of the 1930s. Prescient Wall Streeters who dumped stocks and bought bonds before the Crash made out like bandits as bond prices actually rose and the extreme deflation made dollars go farther. In the recent major bear markets of 2000-2003 and 2007-2009 a large bond position served as a safe haven and saved investors from market losses of as much as 50%. Bonds were little help in the inflationary 1970s when the same rising rates that pulled down stock price/earnings ratios also dragged down the prices of bonds issued at lower rates.
Interestingly, in the great bull market from 1982 to early 2000 stocks did brilliantly but bonds did almost as well. The fact that they were so closely correlated shows how powerful the impact of declining rates was on both stocks and bonds. Exact measurement is easier for the S&P 500 than for bonds. From the low point in 1982 to 2000 stocks grew at an annualized 18.66%. You didn’t do much worse with 10-Year Treasury Notes, however, which produced a roughly 16% annualized return from their low in September 1981.
You can say that the roughly 3% difference in favor of stocks was the added reward of earnings and dividend growth which bonds don’t have or you can simply call it the risk premium for stocks which you were willing to sacrifice for the greater safety of bonds. Another way to look at it is that the S&P 500 Price Earnings ratio was 7.73 on January 1, 1982, but had risen to 29.04 by January 1, 2000. That means that the S&P P/E ratio had increased at about a 7% annual rate over the course of the bull market, quadrupling. This amounts to a lower earnings and dividend yield which resembles the lower coupon yields on bonds.
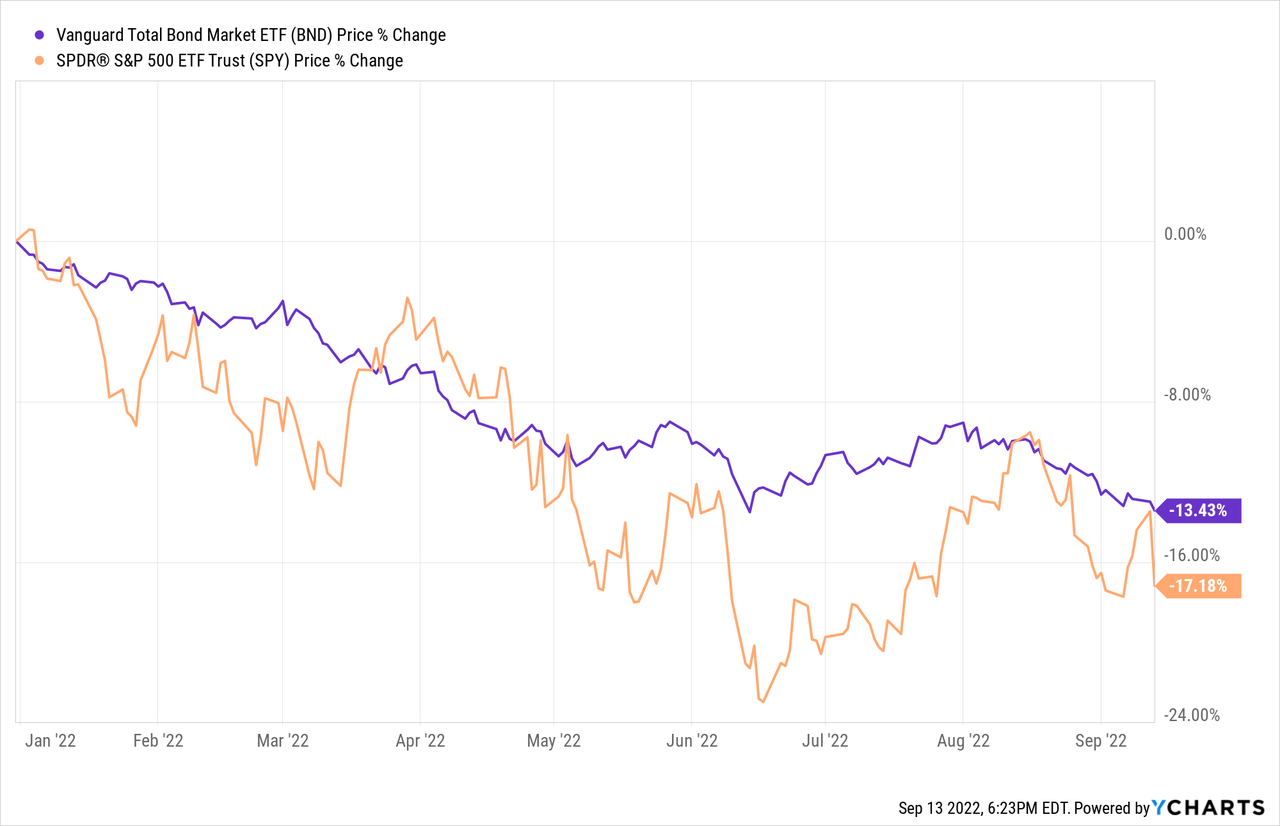
Notice that bonds have trended in the same direction as stocks so far in 2022 and provided little defense in a bear market for both precipitated by rising rates.
Individual Bonds Versus Bond Funds
The Vanguard Total Bond Market ETF is designed to track the performance of the Bloomberg U.S. Aggregate Float Adjusted Bond Index. It invests by sampling the index but nevertheless holds over 10,000 bonds. With its focus on quality and low expense ratio of .03%, BND would be a good choice for investors who desire their bond allocation to be handled conveniently by professionals.
In the first table the major number to note is that average yield to maturity doubled since the beginning of the year, rising from 1.7% to 3/4%. Remember that bond prices and rates are negatively correlated. Over that same period, the return on the Total Bond Market ETF has been -10.80% even including the positive coupon return.
Fixed income characteristics as of 12/31/2021
| BND | 12/31/21 | 9/13/22 |
|---|---|---|
|
Yield to Maturity |
1.7 |
3.4 |
|
Average Coupon |
2.6 |
2.6 |
|
Average Effective Maturity |
8.8 |
8.9 |
|
Average Duration |
6.9 |
6.7 |
BND holds bonds with a high level of safety, being 74% in Treasuries and AAA or AA rated corporates but 26% of its holdings are rated A or BBB. That’s still generally safe. Investors who want absolute safety from their bond position might prefer just the highest quality.
Distribution by credit quality (% of fund) as of 9/13/2022
| US Government | 67.1 |
| AAA | 3.8% |
| AA | 3.0% |
| A | 11.7% |
| BBB | 14.4% |
The last table (below) deserves special attention. While the average maturity of the portfolio is 8.9 years, it is composed of bonds with a wide range of maturities. The general shape of this distribution is an asymmetrical “barbell” with 44.3% maturing in 1 to 5 years and another 32.2% in 5 to 10 years. The curve then slumps in the interval from 10 to 20 years before rising gently in the categories of 20 to 25 years and Over 25 Years. While targeting an average of 5-10 years BND contains some much longer maturities.
Distribution by Effective Maturity as of 12/31/2021
| BND | |
| Under 1 Year | 1.1% |
| 1 – 5 Years | 44.3% |
| 5 – 10 Years | 32.2% |
| 10 – 15 Years | 2.2% |
| 15 – 20 Years | 4.9% |
| 20 – 25 Years | 5.9% |
| Over 25 Years | 9.4% |
| Total | 100.0% |
Several of the above observations figure in my preference for individual bonds. Bonds in my portfolio have the purpose of providing decent return with absolute safety. For this reason I prefer to simply own Treasuries with some government insured CDs. Because I make my own investment choices and am about to turn 78, I prefer to keep maturity dates at 10 years or less. The conclusion suggests some strategies for my preferred approach of buying individual bonds.
Is Right Now A Good Time To Start Buying Bonds?
Note that this subhead and the headline of the article are identical. When things get a lot cheaper you should start thinking about buying them. Bonds have reached that point. Investors starved for yield finally have their shot with the safest asset in the world: US Treasuries. It may be a good moment to start buying while holding enough reserves to benefit if the rates become even more favorable. The only question is which maturities to focus on and how to time your purchases.
The Fed is the key player here, and inflation is the underlying force driving Fed decisions. Having been slow to accept the fact that inflation is not transitory, the Fed is determined not to undershoot the necessary action again. The market is gradually accepting that the Fed means what it says about raising rates until it stamps out inflation the way hippos stamp out fires. As I write this, the market indexes are down 4-5% for the day in response to a fairly innocuous inflation report in which inflation came in a tick or two higher than expected. The yields on short Treasuries shot up with recognition that the Fed would raise rates at least .75% this month and likely quite a bit more in the future.
The 2-Year Treasury yield ended the day above 3.74%, its highest rate since 2007. This created an interesting divergence from the 10-Year Note yield which was also up strongly finishing at a 3.42%. Thus the 2-10 yield curve has reached 32 basis points. The more interesting divergence, though, was the fact that the 10-Year yield failed to reach its June 14 high of 3.49% while the 2-Year has powered up to exceed its June high by 29 basis points. The real action, of course, was in very short maturities which are most directly affected by the rate the Fed controls directly. Market action felt as though the shortest parts of the yield curve were dragging up the more distant maturities which followed a bit grudgingly.
There are a couple of ways to think about this. One is to follow the Fed directly in short maturities and hope to ride them upward as the Fed keeps raising rates. This will clearly work, at least for a short while. The only downside is that the Fed will stop at some point allowing very short maturities to fall back. In that case, one might prefer a position in longer maturities to lock in pretty good current rates.
The best current rates are 3.74% for the 6-month, 3.84% for the 12-month, and 3.74% for the two-year. The 6-month enjoys a high rate because the next Fed hike will exert a quick influence. For others the 5-Year Note at 3.58% and 10-Year Note at 3.42% might work well to lock in the current rate for investors with a longer perspective. This approach, with commitments at both ends of the curve, is called a “barbell.”
So there are several possible strategies:
- Take advantage of the immediate opportunities in the shorter maturities with a bond ladder starting with a maturity as short as two or three months and then proceeding in 6 month intervals (or other intervals if you prefer) out to 2 years.
- Lock in pretty darn good rates at 5 and/or 10 years. My focus would be on 5 years.
- Combine the two strategies.
- Simply buy a yield you are satisfied with at a maturity that suits your purposes.
- Start with half of your available cash so that you have a reserve if an improved opportunity presents itself. This has been my approach thus far.
None of these approaches carry a risk of actually losing money. The risk is entirely a matter of opportunity cost, and the barbell solution if you are investing enough to buy bonds at that many maturities. My actual favorite approach is strategy #4. It implies buying a yield and maturity that feels right.
One final point: before taking meaningful action you might consider waiting to see what action the Fed takes at its next meeting. Don’t forget that the overall objective here is to boost overall portfolio return with absolutely safe bonds.
Be the first to comment