

Andrii Yalanskyi/iStock via Getty Images
A sharp sell-off to start the year has pushed down municipal bond (“muni”) valuations and muni closed-end funds (“CEFs”) to discounts, presenting an attractive entry point for investors seeking tax-exempt income.
Bottom line
- Muni bonds and muni CEFs were down in 4 of the first 5 months of 2022, leading to one of the worst drawdowns in history1
- After navigating a severe correction to start the year, we believe that higher absolute yields and attractive valuations may provide a favorable entry point for investors seeking tax-exempt income
- Investors should consider muni CEFs for exposure to actively managed muni bonds with the potential for monthly, tax-exempt income and opportunities to buy funds at a discount to net asset value (“NAV”)
Surging inflation and expectations for policy tightening from the U.S. Federal Reserve (the “Fed”), including significant interest rate increases to combat inflation, have pushed yields higher across the curve and pressured fixed income assets. This dynamic has driven muni bond prices down with the S&P Municipal Bond Index returning -6.7% year-to-date through May 2022.
We believe the recent volatility has moved muni valuations to a more attractive level relative to other fixed income asset classes. Additionally, we believe seasonal trends are set to turn more favorable with supply-and-demand technicals improving into the summer. We believe that muni CEFs may be a good way to get exposure to the asset class given certain structural advantages that can enhance income in addition to the ability to buy CEFs at a discount to NAV.
Is now the time to buy muni bonds?
Despite recent volatility in the asset class, we believe there are better times ahead for munis:
Favorable supply dynamic: We believe the supply and demand dynamics that negatively impacted the market in early 2022 should improve in the coming months as outflows moderate from tax-time weakness. We also anticipate a seasonally favorable net negative supply environment through the summer in which reinvestment income (from maturities, calls, and coupons) largely outpaces issuance.
Tax equivalent yields: The recent increase in muni yields, both on an absolute basis and relative to treasuries, have made tax equivalent yield levels even more attractive. Muni income is exempt from federal taxes and investors can potentially receive additional tax benefits by purchasing state and local tax-exempt bonds issued by states and municipalities in which they reside. This can be particularly beneficial for residents of states with higher income tax rates, such as New York, New Jersey, and California. Notably, muni CEF offerings span both national and single state strategies.
Strong fundamentals: Muni credit fundamentals remain strong and we are seeing low default rates on muni debt given the resilient U.S. economy. Robust revenue growth and improving financial operations have prompted the upgrade of several high-profile muni credits and ample liquidity in rainy day funds, and unspent federal aid provides states with a cushion to deal with unforeseen spending needs and/or future revenue downturns.
Muni CEFs for income
Unlike open-ended mutual funds, the “closed” structure provides greater flexibility in the types of investment strategies portfolio managers can use. This structure allows for the use of leverage in muni CEFs, which can enhance income and return potential. Muni CEFs borrow money at short-term interest rates and invest the proceeds in muni bonds that pay higher yields, increasing earnings of the fund and supporting higher distributions relative to a muni bond or mutual fund. Additionally, muni CEFs are currently trading at a discount to NAV which further increases the yield to investors.
Given these structural benefits, muni CEFs are currently offering a median tax equivalent yield of 8.9% which is higher than the current yield of individual muni bonds and muni mutual funds (Exhibit 1).
Exhibit 1: Muni CEFs offer investors higher yields
Tax equivalent yields
Source: Barclays, Lipper as of 5/31/2022. Municipal bonds is represented by AAA 30-year muni’s bond yields, Municipal mutual funds are represented by the Lipper General and Insured Municipal category, Municipal CEFs are represented by the Lipper General and Insured Municipal (Leveraged) category. Tax Equivalent yield is using a 40.8% tax rate. Past performance is not indicative of future results. You cannot invest directly in an unmanaged index.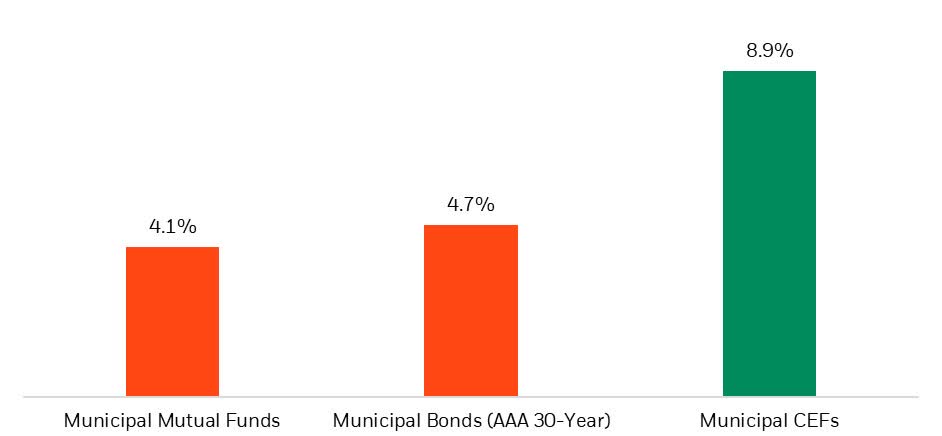
The leverage dynamic
One consideration when investing in leveraged muni CEFs is that leverage costs are generally linked to short-term interest rates. When short-term rates increase, so do leverage costs. It is also important to keep an eye on the shape of the yield curve. Because muni CEFs borrow at short-term interest rates and typically invest in muni bonds with longer maturities, a flatter yield curve (i.e. narrower spread) could negatively impact the earnings of a leveraged CEF. Currently, the yield pick-up on leverage is still favorable at 190 basis points, compared to the 5-year average of 110 basis points (Exhibit 2)2. However, if short-term rates continue to increase and the spread narrows, fund earnings may decrease and subsequently lead to distribution cuts.
Exhibit 2: Leverage Effectiveness
Source: Bloomberg, BlackRock as of 6/1/2022. The yield pickup on leverage is defined a 30yr AA muni less SIFMA plus 55bps of corresponding fees.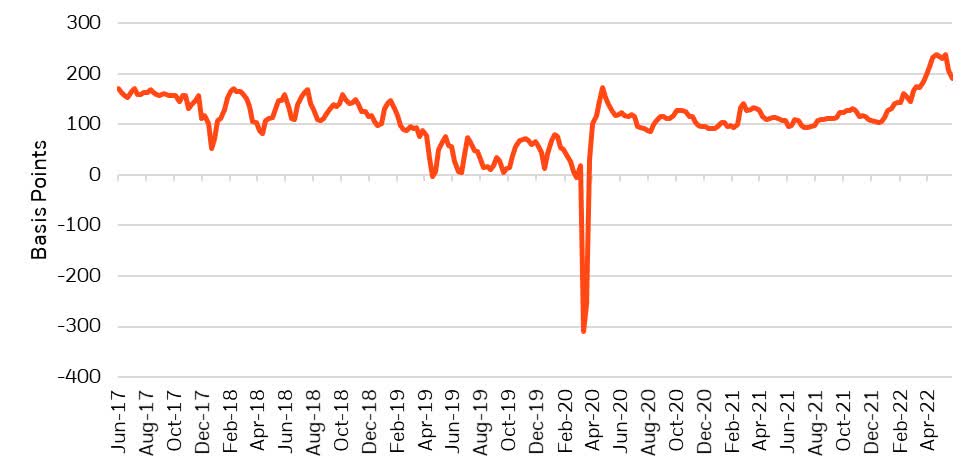
We have already seen borrowing costs increase as the Fed raised short-term rates in March and May 2022. The SIFMA Municipal Swap Index, a common base rate used to calculate muni CEF leverage costs, ended the month of May at a rate of 0.79%, which is 73 basis points higher than it was at the start of 2022. This dynamic is something to pay attention to in the back half of 2022 should the Fed continue to raise short-term interest rates.
Muni CEF valuations
While muni bond returns are down year-to-date, muni CEFs have underperformed muni bonds for two main reasons: 1) leverage magnified negative returns and 2) selling pressure in the secondary market widened discounts causing market price underperformance relative to NAV. In 2022 through the end of May, the median muni CEF returned -12.8% on NAV and -16.9% on market price3. Muni CEFs started the year at a median discount of -1.5% and widened to -6.8% by the end of May (Exhibit 3). While discounts can widen further from here, muni CEFs currently trade wider than the 15-year industry median discount of -4.8%, potentially offering a good entry point for investors.
Exhibit 3: Muni CEFs are trading at wider discounts than their 15-year median
15-Year Premium/Discounts
Source: Morningstar as of 5/31/22. Median premium/discount of the Morningstar US CE Muni National Long Category.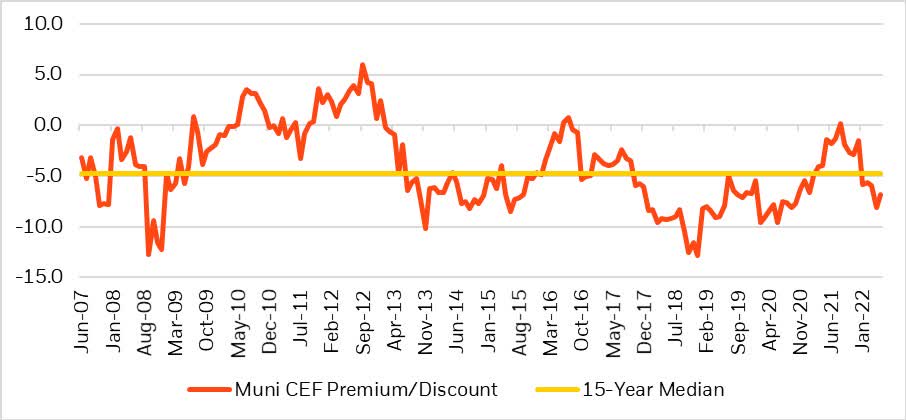
This isn’t the first time we have seen negative performance in muni CEFs, but it has been rare over the past 25 years. In that time, we have only seen five calendar years of negative market price performance in the Muni CEF space: 1999, 2007, 2008, 2013, and 20184. Most of these sell-offs were accompanied by a large rally in the following year, as investors took advantage of higher yields, larger discounts and depressed asset prices. The average calendar year return for muni CEFs after a negative year was 15.7% on market price (Exhibit 4).
Exhibit 4: Muni CEFs market price returns (1997 – 2021) – 25 years
Source: Morningstar as of 12/31/22. Represents Median market price return of the Morningstar US CE Muni National Long Category. Past performance is not indicative of future results.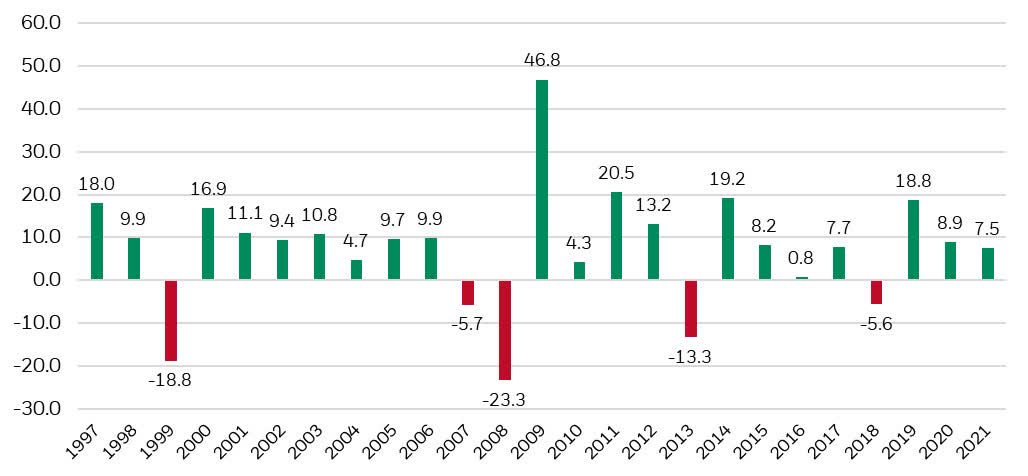
1 Source: Morningstar as of 5/31/2. Muni’s is represented by the S&P Municipal Bond Index and Muni CEFs are represented by Morningstar US CE Muni National Long Category.
2 The yield pickup on leverage is defined a 30yr AA muni less SIFMA plus 55bps of corresponding fees.
3 Source: Morningstar as of 5/31/22
4 Source: Morningstar as of 5/31/22
Editor’s Note: The summary bullets for this article were chosen by Seeking Alpha editors.
Be the first to comment